Your browser of choice has not been tested for use with Barchart.com. If you have issues, please download one of the browsers listed here.
Join Barchart Premier and get daily trading ideas and historical data downloads. FREE 30 Day Trial
Stocks | Futures | Watchlist | More
or

2-Year T-Note Sep '23 (ZTU23)

[[ item.lastPrice ]] [[ item.priceChange ]] ([[ item.percentChange ]]) [[ item.tradeTime ]] [CBOT]
[[ item.bidPrice ]] x [[ item.bidSize ]] [[ item.askPrice ]] x [[ item.askSize ]]
[[ rootItem.symbol ]]underlying price [[ rootItem.lastPrice ]] [[ rootItem.priceChange ]] ([[ rootItem.percentChange ]]) [[ rootItem.tradeTime ]]
Quote Overview for [[ item.sessionDateDisplayLong ]]
[[ rowChartData.labelLow ]]
[[ rowChartData.lowPriceFormatted ]]
[[ rowChartData.lowPrice ]]
[[ rowChartData.labelHigh ]]
[[ rowChartData.highPriceFormatted ]]
[[ rowChartData.highPrice ]]
since [[ rowChartData.lowDate ]]
since [[ rowChartData.highDate ]]
[[ value ]] [[ value ]]

2-Year T-Note Futures Market News and Commentary

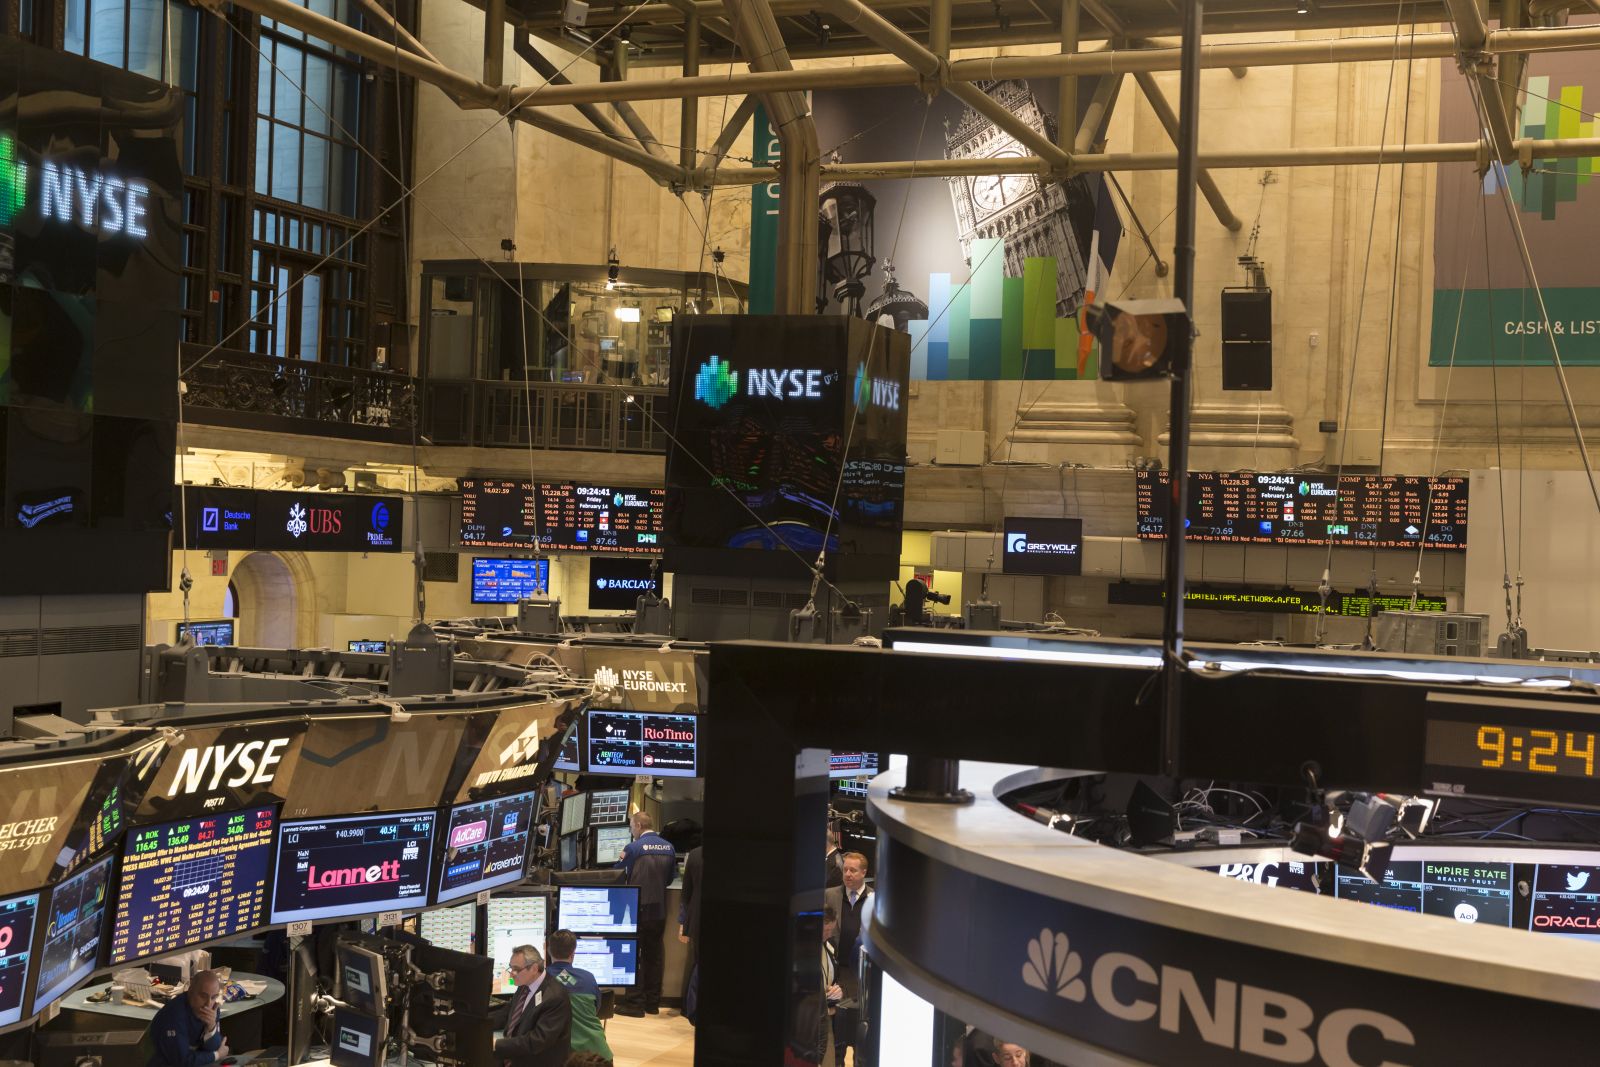
Stocks Retreat as Persistent Inflation Dents Fed Rate-Cut Hopes

The S&P 500 Index ($SPX) (SPY) Thursday closed down -0.46%, the Dow Jones Industrials Index ($DOWI) (DIA) closed down -0.98%, and the Nasdaq 100 Index ($IUXX) (QQQ) closed down -0.55%. 

US stock indexes Thursday closed moderately lower, led by weakness in technology stocks.  Meta Platforms fell more than -10% after forecasting Q2 revenue below consensus and raising its full-year total expenses estimate.  Also, IBM fell more than -8% after reporting lackluster Q1 revenue from its consulting division.  In addition, Caterpillar closed down more than -6% after saying it expects sales for Q2 to be lower compared to last year. 

Losses in stocks accelerated Thursday morning after bond yields jumped on signs of persistent inflation and labor market strength when Thursday’s US Q1 core PCE price index was revised higher and weekly jobless claims unexpectedly fell to a 2-month low, hawkish factors for Fed policy.  Also, the larger-than-expected downward revision to US Q1 GDP and up... Read more

Contract Specifications

See More
Contract
2-Year Treasury-Note
Contract Size
$200,000
Tick Size
One eighth of 1/32 of a point ($7.8125 per contract) rounded up to the nearest cent per contract; par is on the basis of 100 points
Trading Hours
5:00p.m. - 4:00p.m. (Sun-Fri) (Settles 2:00p.m.) CST
Exchange
CBOT
Point Value
$2,000
Margin/Maintenance
$1,265/1,150
First Notice Date
08/31/23
Expiration Date
09/29/23 (expired)

Seasonal Chart

2-Year T-Note Sep '23
Average Price Chart for 5 Prior Sep Contracts

Commitment of Traders Positions as of Apr 16, 2024

View Chart Details
Commercials - Long / Short
3,161,777 (+106,919)
2,346,320 (+126,720)
Non-Commercials - Long / Short
503,827 (+23,019)
1,450,130 (+23,032)
Dealers / Intermediary - Long / Short
150,893 (+29,081)
522,382 (+43,802)
Asset / Manager - Long / Short
2,160,485 (+451,422)
532,485 (-3,198)
Leveraged Funds - Long / Short
312,071 (-297,080)
2,085,697 (+146,336)
Other Reportables - Long / Short
524,589 (-3,604)
138,320 (+12,693)
Get Realtime - Quotes and Charts for Futures Traders. Learn More >>

Price Performance

See More
Period Period Low Period High Performance
1-Month
101-072 +0.25%
on 09/20/23
101-246 -0.28%
on 09/01/23
+0-022 (+0.07%)
since 08/29/23
3-Month
101-027 +0.39%
on 08/28/23
102-057 -0.68%
on 07/13/23
-0-065 (-0.20%)
since 06/29/23

More 2-Year T-Note Quotes

All Futures Prices
Please wait...

Most Recent Stories

More News
PTC Therapeutics: Q1 Earnings Snapshot

PTC Therapeutics: Q1 Earnings Snapshot

PTCT : 25.49 (+1.11%)
Stocks Retreat as Persistent Inflation Dents Fed Rate-Cut Hopes

The S&P 500 Index ($SPX ) (SPY ) Thursday closed down -0.46%, the Dow Jones Industrials Index ($DOWI ) (DIA ) closed down -0.98%, and the Nasdaq 100 Index ($IUXX ) (QQQ ) closed down -0.55%. US stock...

$SPX : 5,048.42 (-0.46%)
SPY : 503.49 (-0.38%)
$DOWI : 38,085.80 (-0.98%)
DIA : 380.92 (-0.92%)
$IUXX : 17,430.50 (-0.55%)
QQQ : 424.45 (-0.48%)
ZNM24 : 107-115 (-0.35%)
META : 441.38 (-10.56%)
AMZN : 173.67 (-1.65%)
MSFT : 399.04 (-2.45%)
GOOGL : 156.00 (-1.97%)
TXT : 84.90 (-9.69%)
Stocks Lower on Tech Stocks Weakness and Stagflation Fears

The S&P 500 Index ($SPX ) (SPY ) is down -0.41%, the Dow Jones Industrials Index ($DOWI ) (DIA ) is down -0.86%, and the Nasdaq 100 Index ($IUXX ) (QQQ ) is down -0.6%. US stock indexes are lower, led...

$SPX : 5,048.42 (-0.46%)
SPY : 503.49 (-0.38%)
$DOWI : 38,085.80 (-0.98%)
DIA : 380.92 (-0.92%)
$IUXX : 17,430.50 (-0.55%)
QQQ : 424.45 (-0.48%)
ZNM24 : 107-115 (-0.35%)
META : 441.38 (-10.56%)
AMZN : 173.67 (-1.65%)
MSFT : 399.04 (-2.45%)
GOOGL : 156.00 (-1.97%)
TXT : 84.90 (-9.69%)
TLT Is Coming Into Key Support Within A Corrective Decline

TLT Is Coming Into Key Support Within A Corrective Decline, from where we should be aware of a continuation higher.

Stocks Tumble on Tech Stock Weakness and Signs of Persistent Inflation

The S&P 500 Index ($SPX ) (SPY ) this morning is down -1.42%, the Dow Jones Industrials Index ($DOWI ) (DIA ) is down -1.43%, and the Nasdaq 100 Index ($IUXX ) (QQQ ) is down -1.83%. US stock indexes...

$SPX : 5,048.42 (-0.46%)
SPY : 503.49 (-0.38%)
$DOWI : 38,085.80 (-0.98%)
DIA : 380.92 (-0.92%)
$IUXX : 17,430.50 (-0.55%)
QQQ : 424.45 (-0.48%)
ZNM24 : 107-115 (-0.35%)
META : 441.38 (-10.56%)
AMZN : 173.67 (-1.65%)
MSFT : 399.04 (-2.45%)
GOOGL : 156.00 (-1.97%)
TXT : 84.90 (-9.69%)
Staying Ahead of the Yield Curve

Learn more about the popular 2/10 spread and how you can trade a steeper or flatter curve with futures contracts.

Hess: Q1 Earnings Snapshot

Hess: Q1 Earnings Snapshot

HES : 161.45 (+1.46%)
Lincoln Electric: Q1 Earnings Snapshot

Lincoln Electric: Q1 Earnings Snapshot

LECO : 227.93 (-4.07%)
Imax: Q1 Earnings Snapshot

Imax: Q1 Earnings Snapshot

IMAX : 17.46 (-1.13%)
S&P Global: Q1 Earnings Snapshot

S&P Global: Q1 Earnings Snapshot

Barchart Trading Guide

The Barchart Trading Guide is a Sell Signal with a Weak Signal Strength.

Key Turning Points

3rd Resistance Point 101-155
2nd Resistance Point 101-155
1st Resistance Point 101-155
Last Price 101-155s
1st Support Level 101-155
2nd Support Level 101-155
3rd Support Level 101-155

See More

52-Week High 104-290
Fibonacci 61.8% 103-142
Fibonacci 50% 102-318
Fibonacci 38.2% 102-175
Last Price 101-155s
52-Week Low 101-027

See More

Want to use this as
your default charts setting?
Save this setup as a Chart Templates
Switch the Market flag
for targeted data from your country of choice.
Open the menu and switch the
Market flag for targeted data from your country of choice.
Want Streaming Chart Updates?
Switch your Site Preferences
to use Interactive Charts
Need More Chart Options?
Right-click on the chart to open the Interactive Chart menu.

Free Barchart Webinar