Maximize Long Call Profits with Charts That Show It All
What if I told you that you could profit from a stock’s upside without actually buying the stock and for just a fraction of the price? Well, you can do that with call options. I’ll break down how the long call strategy works, the risks, rewards, breakeven prices, the metrics you need to watch, and how Barchart’s new charting and analytics tool can help you succeed in the trade.
What Is a Long Call?
First, let’s define what a call option is.
A call option is a contract that gives you the right but not the obligation to buy an underlying security at a specific price, called the strike price, on or before a specific date, known as the expiration date.
As the buyer, you pay a fee for that contract. That’s called the premium. A long call makes money when the underlying asset rises above the strike price at expiration. Traders typically buy calls for two main reasons: to speculate on a potential price increase in an asset they don't yet own or to lock in a future purchase price in case the asset becomes more expensive.
Core Mechanics
Let’s use an example to explain the core mechanics of the strategy.
Let’s say you buy a $100 call option on XYZ that expires in 30 days for $3 a share. Since options are priced per share and each contract covers 100 shares, the total initial cost would be $300. This initial premium paid represents your maximum loss for the trade. No matter what happens, you are only on the hook for this much.
Next, let’s talk about the breakeven price. Since you paid $3 per share for the option, you’ll need the stock to rise $3 above the strike price, or $103, to break even. Any price movement above $103 results in a profit.
Speaking of which, long calls have theoretically unlimited profit potential since a stock’s price can rise indefinitely. The profit on a long call is the stock’s price at expiration minus the strike price, minus the premium paid. But you don’t have to wait until expiration to make a profit. You can sell your long call at any time before expiration to lock in gains or cut your losses.
The higher the stock climbs above your strike price, the more expensive your call option becomes. So, while your risk is capped at the premium you paid, and your upside is open-ended- there’s theoretically unlimited upside with long calls - which is why it’s such a popular strategy for bullish traders looking to maximize gains with limited capital.
Wouldn’t it be nice if we could visually understand the mechanics of a long call trade if, say, it was plotted on a chart? Well, that’s exactly what Barchart’s new P&L charts offer. To access the charts, open any stock profile page you want, and then look to the left and click long call/put under the options strategy menu.
From there, you’ll be brought to the long call tab, and you’ll see a list of potential call options. Look for the chart icon beside the expiration date on any of the trades, and the new charting tool will appear.
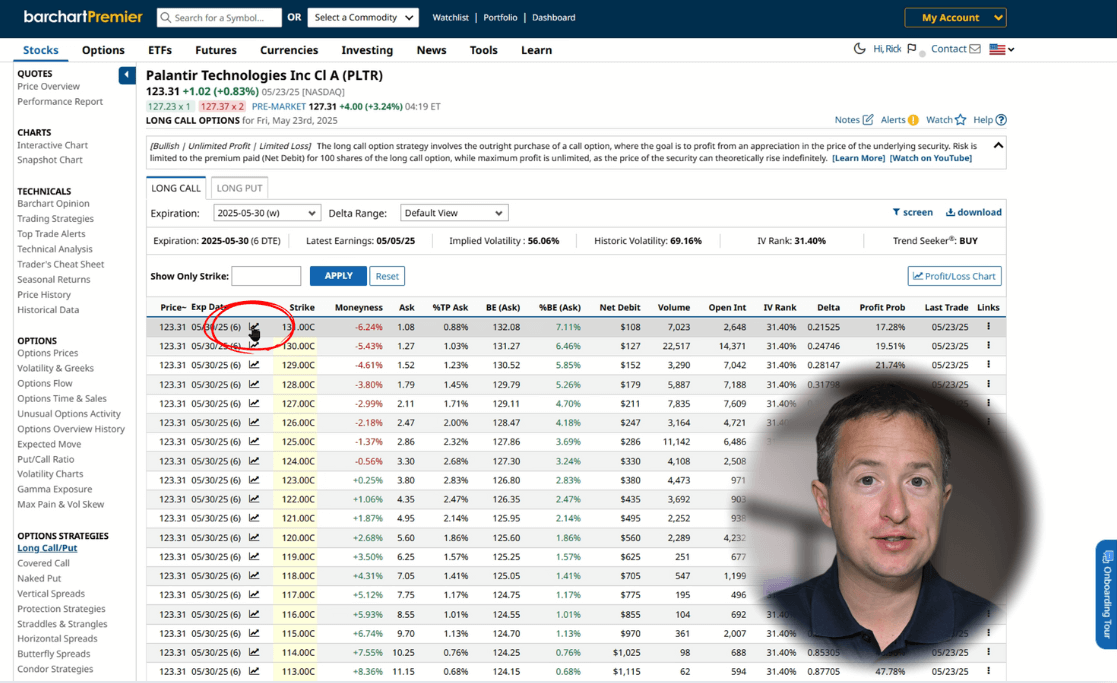
P&L Charting with Barchart.com
The first tab is the profit and loss chart, which displays crucial trade information. The maximum loss is red, green shows profit, and the dashed green line marks your breakeven price. A solid green line shows the current underlying price for quick comparison. You can hover over the graph to show profits and losses at different price points.
Below the chart, you’ll see a full breakdown of your trade setup. This includes the trade structure, outlining the pricing and positioning for each leg, and the breakeven price, along with how far the current price is from that level. There’s also moneyness, which for this trade is the percentage distance between the last price and the strike, displayed right next to the last price.
The panel also highlights your net debit, probability of profit, volume, and other key data. Everything is right there, interpreted and ready to help you assess the trade at a glance.
Greeks on Long Calls
The next tab is for the Greeks. Options Greeks are metrics used to assess how various factors: like time, volatility, and the underlying’s trading price. These factors affect option prices. For single-leg trades, you’ll see individual values for Delta, Gamma, Theta, Vega, Rho, and Implied Volatility (IV). These metrics help highlight your trade’s directional bias and overall risk exposure.
Delta measures how much an option’s price is expected to change for every $1 move in the underlying stock. Long calls have positive delta values, between 0 and 1, meaning if all things are equal, the premium increases as the stock price goes up. For example, a delta of 0.70 means the option's premium should rise 70 cents for every $1 increase in the stock price.
Delta also gives a rough estimate of the option’s chance of expiring in the money. So, a 0.70-delta call implies about a 70% probability of finishing above the strike price at expiration.
Now, because options are time-sensitive contracts, their value decreases a little each day, assuming nothing else changes. This is called theta or time decay. Long calls have negative theta, which means they gradually lose value as expiration approaches.
Time decay speeds up the closer you get to expiration, so buying deep out-of-the-money calls with only a few days left is like burning your money in a fireplace and I would avoid trades like that if I were you.
Next is vega. Vega tells us how much an option’s price is expected to change when the implied volatility of the underlying asset changes. For long calls, higher volatility usually increases the option’s premium, because bigger price swings raise the chance the stock will move above the strike price.
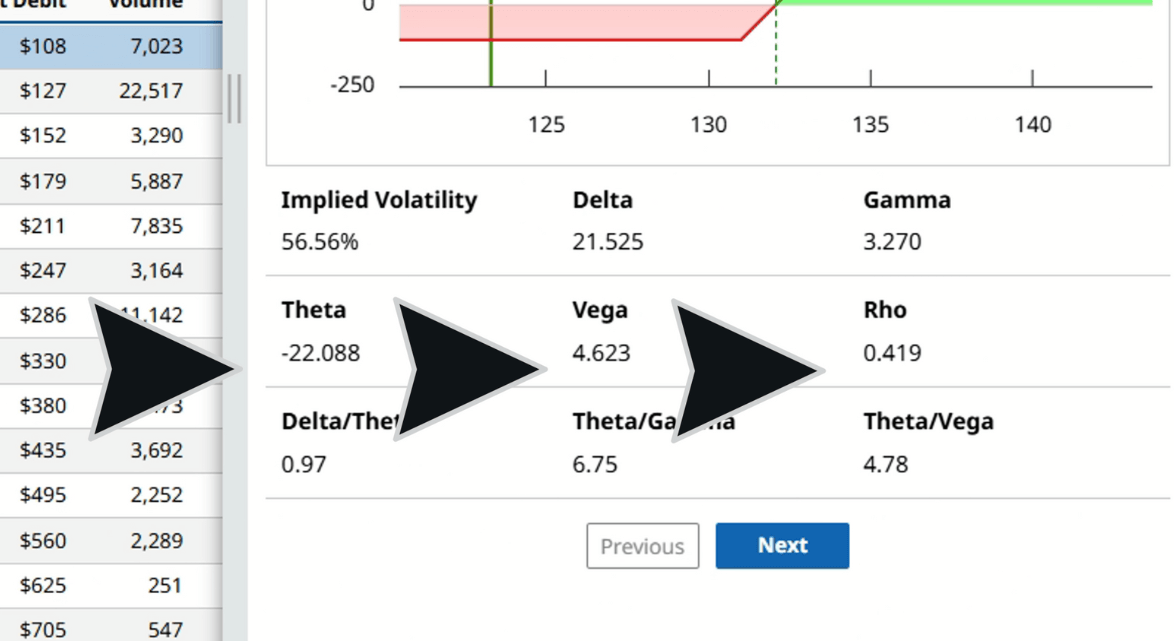
As you can see, all the necessary Greeks for long calls are displayed right here for easy reference.
Expected Move
Now, let’s head over to the Expected Move tab. This feature projects the range where a stock is likely to trade on your selected expiration date. It’s based on 85% of the price of the at-the-money straddle, and that range is automatically calculated and displayed both as a price range and a percentage move. No need for calculators or spreadsheets today.
At the top, you’ll see a 6-month historical price chart, which gives you a visual sense of how the market has behaved recently. Just below that, the expected move range is plotted, offering a side-by-side view of past price action and future projections. Past and upcoming earnings events are also marked on the chart when available.
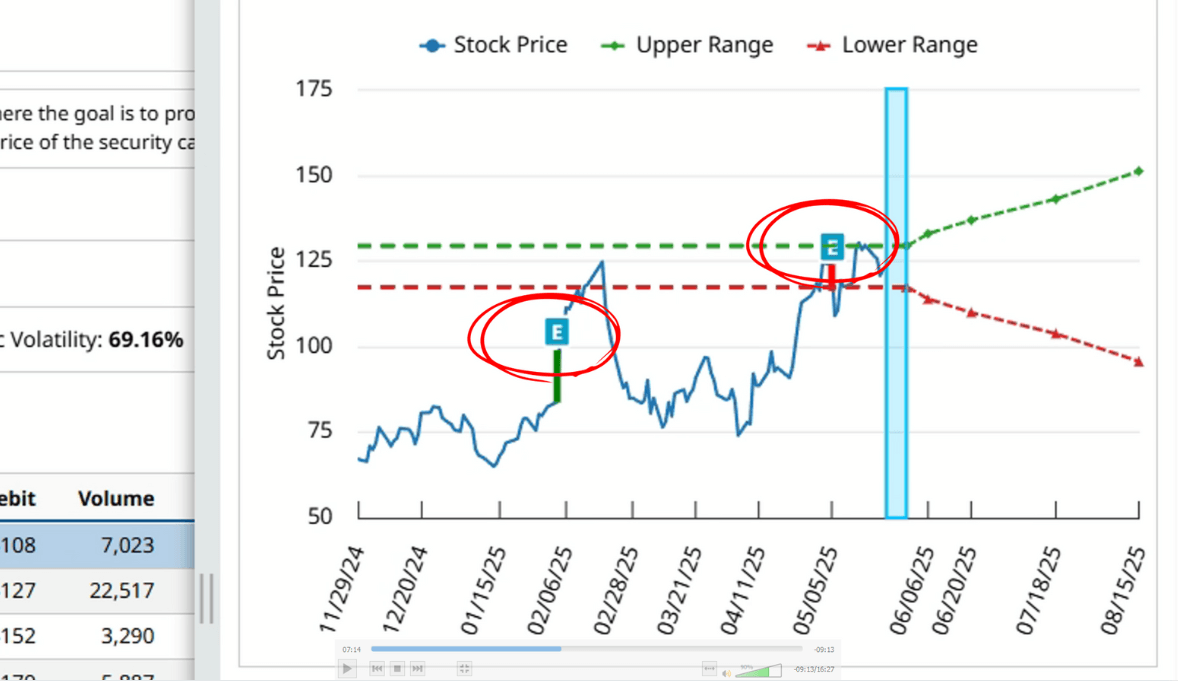
You’ll also find important contract details like expiration date, days to expiration or DTE, and implied volatility. It even includes the actual earnings move from the past four quarters, so you can compare real past volatility against the current projection. Together, these details help you review the trade’s setup with greater confidence.
So how do you apply this for long call trades? Well, you can choose a strike price near the lower end of the range to speculate on upward price movement while boosting your profit chances. Alternatively, you can choose a different strike price within the range to lock in a potential future purchase price if you want to control the asset without owning it outright. Finally, some traders buy cheap, deep, out-of-the-money call options, kind of like a lottery ticket. Sure, some might profit, but it’s not a repeatable strategy. That’s why we have the Expected Move.
Volatility
Next we have the volatility tab where several key details are displayed. Let’s start with IV.
Implied Volatility or IV, reflects the market’s expectation of how much a stock might move in the next 30 days. It doesn’t tell you which direction, just how significant the move could be.
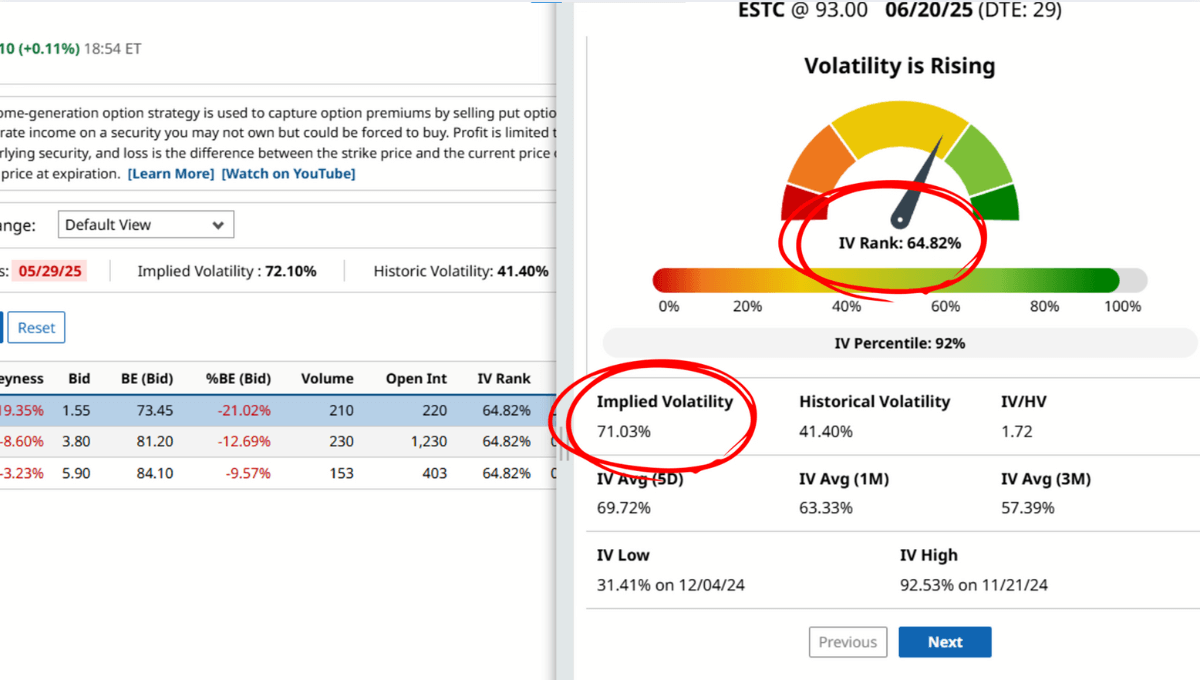
IV Rank shows how current IV compares to the past year, helping you gauge whether options are relatively cheap or expensive. For example, if IV is high relative to the last 12 months, IV Rank will also probably be high, meaning premiums are elevated.
Barchart displays both IV Rank and its interpretation up top, with ranges categorized as Very Low to Very High. The IV figure itself is based on the nearest monthly expiration with at least 30 days to go, ensuring consistency in measurement.
For even deeper insight, the tab shows a horizontal IV percentile plot, which tells you how often IV has been lower over the past year. While IV Rank tells you where the current IV sits in its range, IV Percentile tells you how frequently it's been lower, which both help understand volatility in the context of your specific trade.
Barchart also factors in short-term volatility trends, displayed as rising or falling, based on key metrics like volatility comparisons across different time periods and relationships between historical and implied volatility. No need for complicated calculations and comparisons between 5-day IV and IV over HV - because all the details are here, stated, interpreted, and ready for use.
For long calls, low but rising volatility is preferred since options will be cheaper and you get to benefit from rising IV.
Trend
The last tab to check out is Trend. This is your go-to for gauging stock momentum across short, medium, and long timeframes. It shows the stock’s position relative to the 20, 50, and 100-day moving averages, and I find it to be a favorite among technical traders.
If the asset price is above the moving average, that’s considered bullish, and below means bearish. You’ll see this visualized with color-coded arrows: green for bullish, red for bearish, and the angle of the arrow shows how strong the signal is based on how far the price has moved from the average.
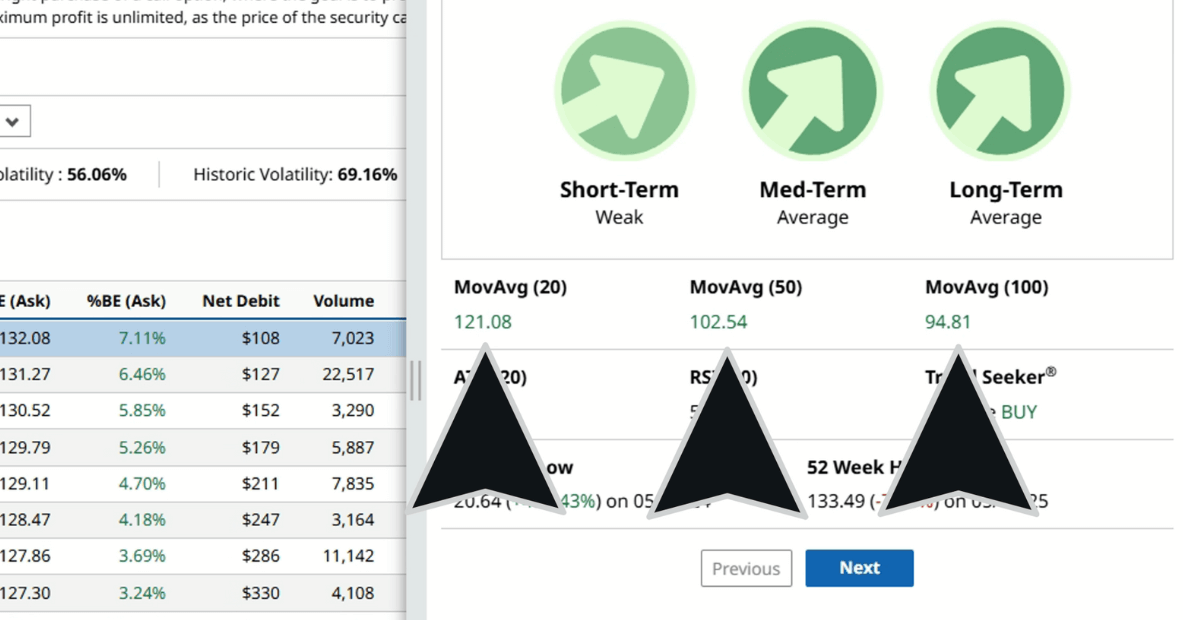
Below that, the actual moving average values are listed, helping you confirm whether the market is trending or range-bound.
You also get some helpful technical indicators right here. ATR, or Average True Range, reflects volatility over the past 20 days and can be used to set stops or targets.
RSI, the Relative Strength Index, shows momentum strength. High readings suggest overbought conditions, and low readings suggest oversold. Traders can also use RSI as a leading indicator when trends start to shift.
Barchart also includes Trend Seeker. This is a proprietary tool that combines volatility, wave theory, and the 50-day EMA to come up with a clear Buy, Sell, or Hold signal.
Lastly, 52-week highs and lows are included to help spot key support or resistance levels. This tab gives you a quick, technical look at the trend strength and direction without needing to plug dozens of technical indicators into your charts.
Building a Smart Long Call Trade
So now that we’ve covered the charting features, let me show you how to use them to build a long call trade.
First, let’s find a stock that you’re bullish on. Let’s use Microsoft for this example. The stock has had a pretty good run since its latest earnings report and the stock is trading around $450 at the time of recording.
So, let’s go to Microsoft’s stock profile page, then click long call/put. On the results page, let’s change the days to expiration to June 27, which is 34 days from the time of recording.
Now we have a list of trades, click on the chart icon on any of them to pull up the charting feature. Now, we need to look at two tabs: trends, and expected move.
On the trends tab, we can see that the technicals are showing a bullish bias on all time periods. Let’s jump to the expected move tab, and here, we can see that MSFT is expected to trade between $430 and $470 by June 27. And we can use these numbers as a baseline for selecting strike prices.
Now, most traders looking to play this bullish move have a few choices: they can buy an in or at-the-money call or an out-of-the-money call. An out-of-the-money call, like the $460 strike, would cost less. However, the stock needs to move way higher than $460 to break even, making this a higher-risk, higher-reward play.
On the other hand, an ITM call, such as the $435 or $440 strike, they’ll cost more upfront. However, because these options already have intrinsic value, they require less movement in the underlying stock to be profitable. It’s a more conservative play, with a higher probability of success but at the expense of a lower potential return than an out-of-the-money call.
Of course, you can also set your strike to your preferred buying price, if you’re looking to lock in MSFT shares because you expect it to do well in the next few weeks.
In this example, let’s say we go for somewhere in the middle, like $455. To look for 455-strike trades, type in the value here and click apply. And there we go.
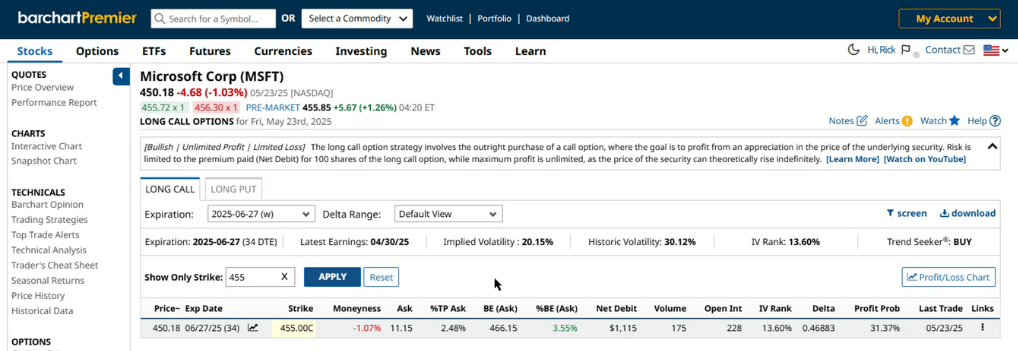
This trade suggests buying a 455-strike call on MSFT, which expires in 34 days. The contract will cost $11.15 per share or $1,115 per contract and the breakeven price is $466.15. Delta is 0.47, and the probability of profit is 31.37%.
Then, you can open the chart feature once again, review greeks, volatility, and other details. If this trade doesn’t fit your trading strategy, you can click reset here, open the chart again, then cycle through the trades by clicking on next until you find the trade you’re looking for. It’s that easy.
Why Visualization Gives Traders an Edge
Barchart’s new charting tool is an excellent complement to your trading strategy. With it, you can select your strike price based on actionable data, visualize your trade, monitor the Greeks, check real-time volatility, confirm future trends based on technical indicators, and more.
No more guesswork, no more juggling multiple charts, graphs, and spreadsheets for calculations. Everything you need to know is right here, always just a few clicks away.
Finishing Up
Long calls are a simple yet powerful way to profit when you expect a stock to rise with limited and clearly defined risk. With it, you can profit from a larger position for a fraction of the costs and benefit from upward price movement - all without buying a single share.
And with Barchart’s new P&L visualization tools, there’s no more guessing. You get instant clarity on potential profit, breakeven points, risk, the Greeks, volatility, trends, and so much more.
So here’s a challenge for you: Pick a stock you’re bullish on, check out the new P&L charts, and walk through the trade setup. Then, buy the call from your brokerage’s paper trading or practice account and see how it works out. Review and backtest, hone your technique, and when you’re ready and confident with your strategy, try it live!