Understanding Gamma: The Secret Force Behind Price Movement
Most traders learn about Gamma the hard way—through frustrating losses that seem to defy logic.
Consider this scenario faced by a short-term SPY options trader. The SPY opens the week at $600. Seeing an opportunity, the trader buys a $610 call that expires that Friday for $5.00.
As Monday moves along, the SPY jumps to $605. That $5.00 call option is now worth $7.00, a nice $200 gain. Unfortunately, it doesn't last. By Monday's close, the SPY finishes back at $600 while the call option returns to $5.00.
Three days later, the SPY opens at $600. Because of time decay, the $610 call option is now worth $3.00. Almost immediately, the SPY jumps to $607, and you think, “Great! I can sell my call option for a profit.” Yet, when you look at the option chain, that same $610 call option is only worth $4.50, even though the SPY trades at $607.
Instead of feeling victorious, you're left puzzled—and a little frustrated. How could your gains be smaller than they were on Monday? After all, the SPY only gained $5 on Monday. Today, it's up $7.
The answer lies in option Gamma, a powerful yet often misunderstood force in options trading.
While option Delta measures how much an option's price changes with a $1 move in the stock, Gamma explains how Delta itself changes as the stock moves. It's this dynamic multiplier that caused your option price to behave differently across similar stock movements.
Gamma not only drives individual option prices but also shapes market behavior on a larger scale, influencing everything from routine price action to dramatic Gamma squeezes. Without a solid understanding of Gamma, traders risk being blindsided by its effects—missing out on opportunities or struggling to manage risk effectively.
In this comprehensive guide, we'll explore:
- How Gamma amplifies price movements and why it's critical for traders.
- Why Gamma exposure is a key focus for market makers.
- How to use Barchart's tools to analyze and incorporate Gamma into your strategy.
- The mechanics of Gamma squeezes and how to identify them.
- Practical strategies to trade smarter with Gamma in mind.
Whether you're a seasoned trader or just starting with options, mastering Gamma will help you make better decisions and stay ahead in the market.
What is Gamma, and Why Does it Matter?
In options trading, Delta gets most of the attention, but Gamma is the quiet force working behind the scenes to shape every position's behavior.
If Delta measures the speed of an option's price change, Gamma measures its acceleration. More specifically, Gamma tells you how much an option's Delta changes for every $1 move in the underlying stock.
While this might sound abstract, understanding Gamma is essential for managing risk and maximizing profits in any options strategy. Let's break it down step by step, with the help of the SPY options chain and the Gamma vs. Delta chart below.
Gamma in Action: SPY Options Chain Example
Below is an options chain for SPY calls expiring on January 17, 2025, showing strike prices from $585 to $594. The SPY is currently trading at $589.49, making the $590 strike near-the-money.
The table includes key data like Delta, Gamma, Theta (time decay), and implied volatility (IV).
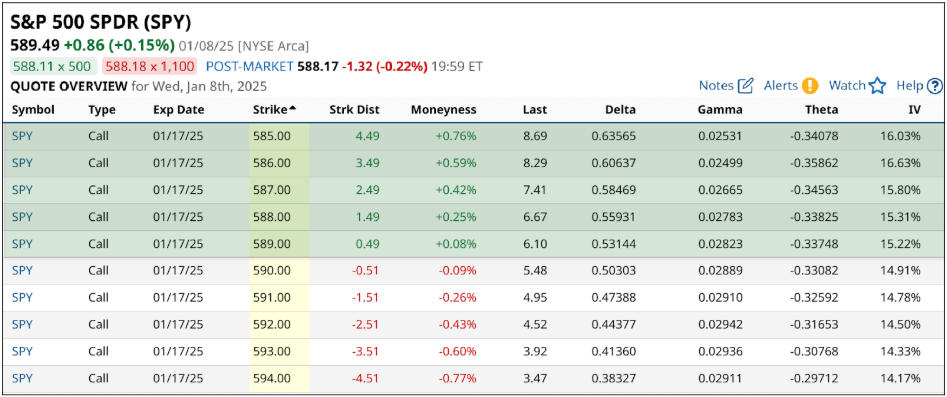
Let's focus on the $590 strike call, which is essentially at-the-money (ATM):
- Delta: 0.50
- Gamma: 0.029
If SPY rises from $589.49 to $590.49, Delta will increase by Gamma's value, going from 0.50 to approximately 0.53. This means that for the next $1 move, the option's price will change by $0.53 instead of $0.50. Conversely, if SPY falls to $588.49, Delta will decrease to around 0.47.
The SPY options chain provides a numerical look at Gamma's impact, but the chart below visually illustrates how Gamma and Delta behave as options move from out-of-the-money (OTM) to in-the-money (ITM).
Gamma vs. Delta: A Visual Representation
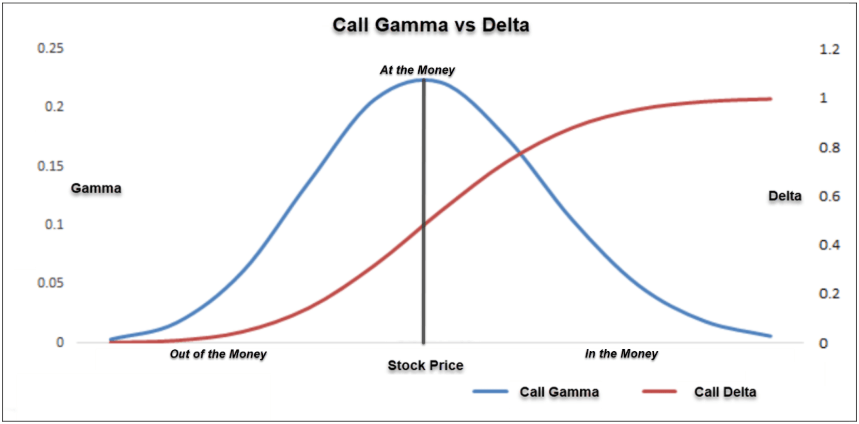
The chart above illustrates how Gamma and Delta behave as the stock price moves from OTM to ITM. Here's what to observe:
- Gamma (blue curve): Gamma is highest at the at-the-money (ATM) point, where Delta changes most rapidly. As the stock price moves away from ATM (either ITM or OTM), Gamma decreases significantly.
- Delta (red curve): Delta starts near 0 for deep OTM options, increases steeply near ATM, and approaches 1 as the option moves ITM.
As options move ITM, Delta approaches 1, meaning the option behaves more like the stock itself, and further changes in Delta slow down.
For OTM options, Delta remains low, reflecting reduced sensitivity to price moves, which naturally results in smaller Delta shifts and lower Gamma.
This behavior explains why ATM options are highly sensitive to price movements—they experience the most significant shifts in Delta, driven by high Gamma.
Why Does Gamma Peak Near the ATM Strike?
You might wonder: Why is Gamma highest at ATM strikes and lower for ITM or OTM strikes?
The answer lies in the sensitivity of Delta. At ATM strikes, Delta is around 0.50, meaning the option price is equally influenced by upward or downward moves in the underlying stock. This balance causes Delta to shift more rapidly in response to price changes, maximizing Gamma.
For ITM options (like the $585 strike), Delta is already high (~0.64), meaning the option behaves more like the stock, and Delta changes more slowly.
For OTM options (like the $594 strike), Delta is much lower (~0.38), reflecting lower sensitivity to stock movements, which also results in smaller Delta shifts and lower Gamma.
Key Aspects of Gamma
- At-the-Money (ATM) Gamma is Highest
The $590 strike has one of the highest Gammas in the table (0.029), making it highly sensitive to SPY's movements. Gamma decreases for both ITM and OTM strikes, as seen with $585 (0.025) and $594 (0.029). - ITM Options:
Behave more like the underlying stock, with Delta stabilizing near 1. Gamma has minimal impact, making these options better for long-term or conservative strategies. - OTM Options:
Have low Delta, which adjusts more gradually. While their Gamma is higher than ITM options, these positions are highly speculative and sensitive to volatility. - Time Decay Increases Gamma Near Expiration
As expiration approaches, Gamma for ATM options becomes even more pronounced. This leads to sharp changes in Delta, creating what's known as “pin risk,” where stock prices gravitate toward popular strike prices at expiration. This is due to the hedging activity required by market makers as Gamma increases at these strikes. - Gamma is Dynamic
Gamma evolves with stock price changes, time decay, and implied volatility. Traders who understand these shifts can proactively adjust their positions to take advantage of Gamma or mitigate its risks.
Understanding this dynamic prepares us to explore how Gamma's collective effects influence the broader market.
To monitor Gamma effectively, tools like Barchart's Greeks column allow you to track Gamma and Delta across strike prices. Incorporating this into your analysis helps you identify opportunities and manage risks with precision.
Understanding Gamma Exposure (GEX)
Gamma Exposure (GEX) is one of the most powerful yet under appreciated forces driving market behavior.
Think of it like the tension in a series of rubber bands stretched across different strike prices. As prices approach certain levels, the tension in these “bands” can either pull the price back, creating stability, or snap under pressure, releasing sharp and unexpected energy.
For traders, understanding GEX helps identify where these forces are most concentrated—levels where price may stabilize, spike, or break down entirely.
By analyzing GEX, traders gain insight into how market makers hedge their positions and how these hedging activities shape price action.
Let's exploreSPY's Gamma Exposure to see how this works in practice.
What is Gamma Exposure?
At its core, Gamma Exposure reflects the total Gamma held by market participants, particularly market makers. These participants must hedge their Delta positions as prices move, creating either stabilizing or amplifying effects:
- Positive Gamma Exposure (Long Gamma): Market makers hedge by buying stock as prices fall and selling as prices rise, reducing volatility and stabilizing prices.
- Negative Gamma Exposure (Short Gamma): In contrast, market makers sell stock as prices fall and buy as prices rise, amplifying volatility and creating larger price swings.
Using Gamma Exposure charts, traders can pinpoint levels where hedging activity may influence price movement. Let's examine SPY's current Gamma Exposure to understand how this works.
A Closer Look at SPY: Gamma Exposure by Strike
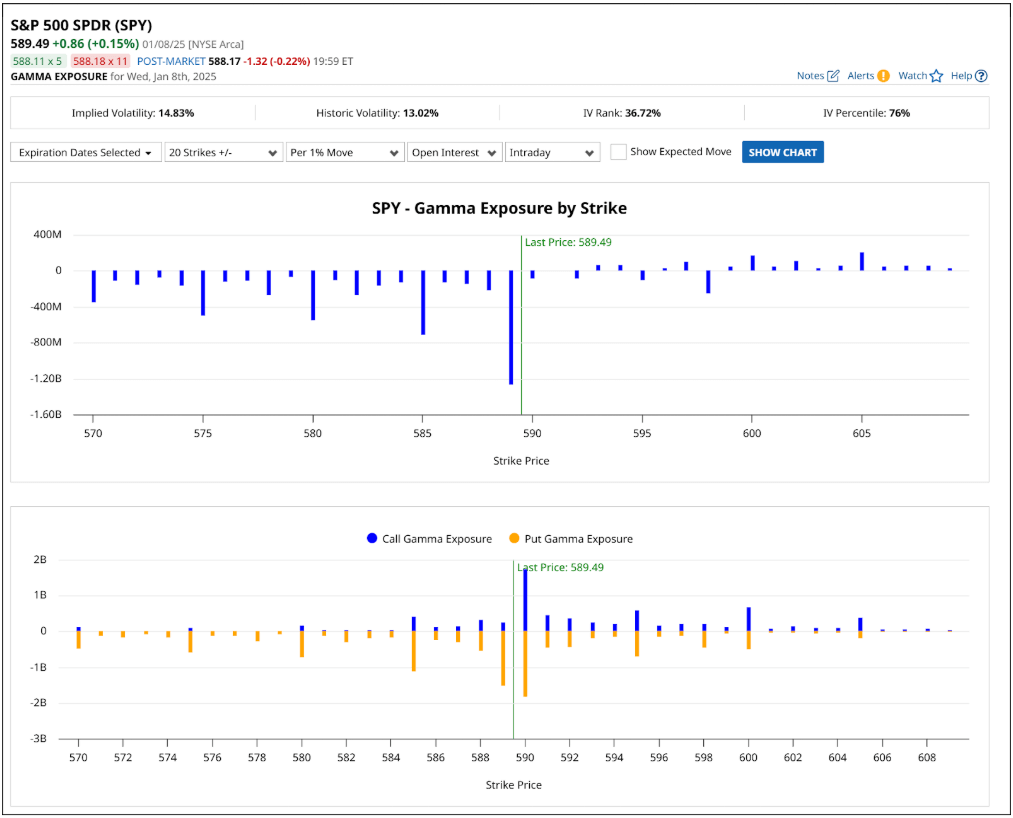
The chart above displays SPY's Gamma Exposure (GEX) by strike price, with SPY currently trading at $589.49:
- Top Graph: Net Gamma Exposure (Call Gamma minus Put Gamma). This view highlights whether positive or negative Gamma is dominating the market.
- Bottom Graph: Separate call (blue) and put (orange) Gamma exposures. This breakdown helps traders see how market makers' hedging may vary at different strike levels.
Here's what the chart reveals:
- Stability at $590
At the $590 strike, we see significant positive call Gamma exposure (blue bars). This indicates that market makers are heavily hedging at this level, creating a stabilizing effect often referred to as “pinning.” Prices are likely to remain near $590 as expiration approaches, barring any major catalysts. - Volatility Risk Below $589
Below $589, concentrated negative put Gamma exposure (orange bars) suggests that if SPY drops further, market makers may need to sell stock aggressively to hedge their short put positions. This could amplify any downward move, increasing volatility and potentially driving prices lower.
Turning GEX Insights into Trading Ideas
The Gamma Exposure chart isn't just theoretical—it's a practical tool for identifying trading opportunities. Based on SPY's current setup, here are two scenarios to consider:
- Scenario 1: Stability Around $590
Heavy positive Gamma exposure suggests SPY may remain anchored near $590. Traders could take advantage of this stability by deploying low-volatility strategies, such as credit spreads or iron condors, to capture premium in a range-bound environment. - Scenario 2: A Drop Below $589
If SPY breaks below $589, the negative Gamma exposure signals heightened volatility risk. This could present an opportunity for bearish trades, such as buying puts or using debit spreads, to profit from an acceleration in the downward move. Watch for confirming signals, such as increasing volume or sustained price breaks below $589.
Why Gamma Exposure Matters
Gamma Exposure helps traders see beyond traditional technical analysis by revealing how hedging dynamics influence price behavior. Here are the key takeaways:
- Support and Resistance Levels: Strikes with high positive Gamma exposure often act as magnets, stabilizing price movements as expiration nears.
- Volatility Indicators: Strikes with heavy negative Gamma exposure point to areas where volatility may spike, especially during breakouts or trending markets.
By incorporating Gamma Exposure into your trading toolkit, you can anticipate market behavior more effectively and align your strategies with underlying forces. For SPY, the $590 strike stands out as a critical level for stability, while $589 signals a potential volatility zone.
Gamma Squeezes Explained
Gamma squeezes are among the most dramatic events in the options market, capable of triggering explosive price moves that catch even seasoned traders off guard. Understanding how these squeezes develop and identifying the conditions that lead to them can provide a significant edge in both profiting from and protecting against these events.
What is a Gamma Squeeze?
A Gamma squeeze occurs when rapid buying of call options forces market makers to hedge their positions by purchasing the underlying stock, creating a feedback loop that accelerates price increases. Here's how it works:
- The Catalyst: Traders begin aggressively buying call options, often on stocks with low float or high short interest.
- Market Makers' Response: To offset their short call positions, market makers hedge by buying shares of the underlying stock.
- The Feedback Loop: As the stock price rises, the Delta on the call options increases. This requires market makers to buy even more shares to stay Delta-neutral, further driving up the price.
- Acceleration at Key Strikes: If the price moves near heavily traded strikes with high Gamma exposure, the hedging activity intensifies, leading to even sharper price increases.
This cycle can create a self-reinforcing loop, where price movement feeds on itself until external factors—such as profit-taking or regulatory intervention—break the cycle.
Historical Example: GameStop (January 2021)
A textbook example of a Gamma squeeze occurred with GameStop in early 2021. Retail traders purchased massive volumes of call options, forcing market makers to buy shares to hedge their positions.
- As GameStop's price surged, the Delta on these calls increased, requiring even more stock purchases by market makers.
- This feedback loop drove GameStop's stock from $20 to over $400 in a matter of days, creating massive gains for some and devastating losses for others caught on the wrong side.
How to Identify Gamma Squeeze Potential
Spotting a potential Gamma squeeze requires careful observation of options activity and market conditions:
- Unusual Options Activity: Look for a sharp increase in call option volume and open interest, particularly in strikes just out-of-the-money (OTM). Rising implied volatility (IV) is another clue.
- Gamma Exposure Concentration: Using tools like Barchart's Gamma Exposure charts, identify strikes with high positive Gamma. Stocks trading near these levels are more susceptible to squeezes.
- Catalysts and Momentum: Earnings reports, unexpected news, or high short interest can act as triggers. Watch for price momentum building around these catalysts.
Managing Risk During a Gamma Squeeze
Whether you're trading into or against a Gamma squeeze, risk management is critical:
- Position Sizing: Use smaller position sizes to account for extreme volatility.
- Profit Targets: Set clear exit points to lock in gains during fast-moving markets.
- Avoid Deep OTM Options: While tempting for their leverage, deep OTM options often lose value rapidly if momentum falters.
Gamma squeezes can offer immense profit potential, but they are inherently risky. Approach them with caution and clear strategies for entry and exit.
Conclusion
Gamma is more than just a mathematical concept—it's a dynamic force that drives price behavior in the options market. From understanding how Gamma shapes Delta to using Gamma Exposure to identify key price levels, traders who master this Greek gain a significant edge.
Key Takeaways:
- Gamma's Role: Gamma measures the rate of change in Delta, creating opportunities for profit acceleration and risks for unprepared traders.
- Gamma Exposure: By analyzing Gamma Exposure, traders can anticipate price stabilization at key levels or heightened volatility near expiration.
- Gamma Squeezes: These events amplify price moves through feedback loops created by market makers' hedging. Identifying their potential can lead to lucrative opportunities but requires disciplined risk management.
By leveraging tools like Barchart's options analytics, including Gamma Exposure charts, you can incorporate Gamma analysis into your trading strategy. Whether you're a buyer seeking high returns or a seller managing risk, understanding Gamma ensures you're better prepared to navigate the market's complexities.
Frequently Asked Questions (FAQ)
What is Gamma in options trading?
Gamma measures the rate of change in Delta relative to a $1 move in the underlying stock. It shows how much Delta will adjust as the stock price changes, giving traders insight into how their option's sensitivity evolves.
Why does Gamma peak at at-the-money (ATM) strikes?
Gamma is highest at ATM strikes because Delta shifts most rapidly in this range. At ATM, the option's price is equally influenced by upward and downward moves, causing Delta to adjust quickly as the stock price moves.
What is the difference between positive and negative Gamma Exposure?
- Positive Gamma Exposure: Stabilizes prices as market makers buy stock when prices fall and sell stock when prices rise.
- Negative Gamma Exposure: Amplifies volatility as market makers sell stock when prices fall and buy stock when prices rise.
How can I use Gamma Exposure to improve my trading?
By monitoring Gamma Exposure charts, you can:
- Identify key levels where prices are likely to stabilize (positive Gamma).
- Anticipate areas of increased volatility or sharp moves (negative Gamma). This helps in selecting strategies like range-bound trades near stability zones or directional trades in high-volatility areas.
What is a Gamma squeeze, and how do I spot one?
A Gamma squeeze occurs when heavy call option buying forces market makers to hedge by purchasing the underlying stock, creating a feedback loop that drives prices higher. Look for:
- Unusually high call volume and rising implied volatility.
- High Gamma Exposure near key strikes.
- A catalyst such as news, earnings, or high short interest.