Barchart Trading Signals
What are Barchart Opinions?
Barchart Opinions show traders what a variety of popular trading indicators are suggesting in terms of going long or short. The Opinions takes up to 2 years' worth of historical data and runs the symbol's prices through thirteen different technical indicators. After each calculation, the program assigns a buy, sell or hold value for each indicator, depending on where the price lies in reference to the common interpretation of the study.
For example, if a stock's price is above the 150-Day Moving Average (a "Long-Term" indicator), this is generally considered an upward trend or a "Buy" trading signal. The Barchart Opinion for the 150-Day Moving Average, therefore, will also indicate a "Buy."
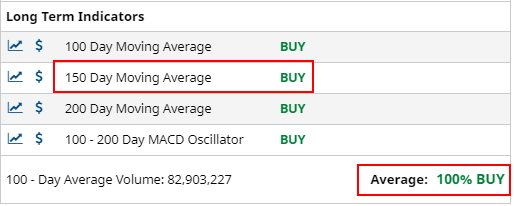
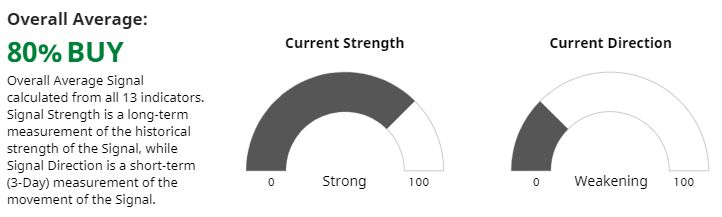
We also calculate an Average Short, Medium, and Long-Term Signal for each grouping of indicators. Finally, the average of all 13 indicators are rolled into an Overall Average Opinion. This tells you the overall Buy/Sell/Hold trading signal that all 13 indicators are suggesting. As shown below, the overall signal suggests a strong upward trend.
Why are "New" Opinions Being Introduced?
We chose these new trading strategies based on an in-depth study of the indicators that tend to work best - producing hypothetical profits - across a wide range of markets. Profitable trading strategies that use moving averages perform best, and they also happen to be the most intuitive and the easiest to understand. Conventional wisdom says when prices cross these key points they will trigger broader selling or buying in support of the new trend. These same moving average strategies tend to be ones used by large hedge funds, institutional investors and money managers, and are often the same ones you will see reported in the news as the most closely watched buy and sell signals.
When using any trend-following trading strategy, however, it is important to recognize that the success of the system depends heavily on whether a particular market is trending. If a market is moving in large and sustained moves, then the trend-following systems will tend to be more successful. On the other hand, if a market is moving in a choppy and sideways manner, then the trend-following systems will perform poorly due to false breakout signals.
Here is a quick guide for how each of the trading systems works. More information on all of our technical indicators can be found in our Education - Technical Indicators" section.
Moving Averages
The "Moving Average" trading strategy is always in the market and takes a long position when the market is above its moving average and a short position when the market is below its moving average. Looking at the "Moving Average 200" as an example, the system will go long when the market first closes above its 200-day moving average and will turn short when the market next closes below its 200-day moving average.
MACDs
The "MACD System" (Moving Average Divergence System) takes a long position when the shorter-term moving average (SMA) crosses above the longer-term moving average and switches to a short position when the shorter-term moving average crosses below the longer-term moving average. Looking at the "MACD System 20 - 50" as an example, the system will go long when the 20-day SMA moves above the 50-day SMA and will turn short when the 20-day SMA falls below the 50-day SMA.
Trend Seeker®
Trend Seeker® is a computerized trend analysis system, developed by Barchart.com. The system uses a combination of wave theory, market momentum and volatility in an attempt to find a general trend for a specific market. Trend Seeker® attempts to cut losers early and let winners run.