Short Straddles EXPLAINED: Collect Premiums in Neutral Markets
What if you could collect thousands in premiums with a trade that wins when a stock stays within a specific range? That’s exactly what a short straddle does. It’s a powerful income strategy for neutral markets, but it comes with unlimited risk if you don’t manage it correctly.
I’ll show you how the short straddle works, how to identify high-probability setups using Barchart, and how I manage the risks associated with this trade.
I’ll walk you through real examples, breakeven zones, the greeks, expected moves, volatility trends, and show you the exact profit and loss thresholds I use to decide when to take gains or cut losses.
This strategy can be incredibly rewarding if you know how to use it properly. Let’s get started.
What Are Short Straddles?
First, let’s get the definitions out of the way. An option is a contract that gives you the right but not the obligation to buy or sell an underlying security at a specific price, called the strike price, on or before a specific date, known as the expiration date. A long call gives you the right to buy an asset, while a long put option reserves the right to sell.
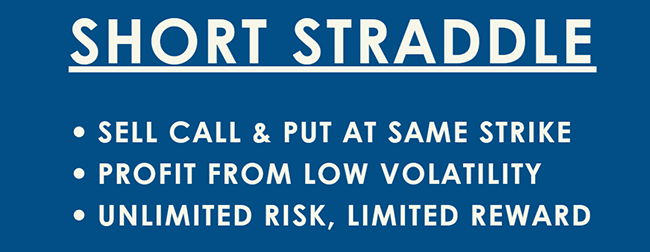
The short straddle is a neutral options strategy that involves selling a call and a put with the same strike price and expiration date. The resulting trade starts with a net credit, which the trader gets to keep in full if the underlying asset trades exactly at the strike price by expiration. Now, the chances of that happening are slim, but, having the underlying trade at exactly the strike is not really the goal. And I’ll explain why in a bit.
Core Mechanics
Let’s use an example to explain the core mechanics of the strategy.
Let’s say you sell a $100 strike call option and a $100 strike put option on XYZ, both expiring in 30 days, and each bringing in a premium of $3 per share. Since each contract covers 100 shares, you collect $600 upfront: $300 from the call and $300 from the put. This total premium received is your maximum profit.
Next, let’s talk about the breakeven points. Since you collected $6 in premiums, XYZ can move $6 in either direction before the trade starts losing money. That gives you a breakeven range between $94 and $106. As long as the stock stays anywhere inside that range at expiration, you make a profit.
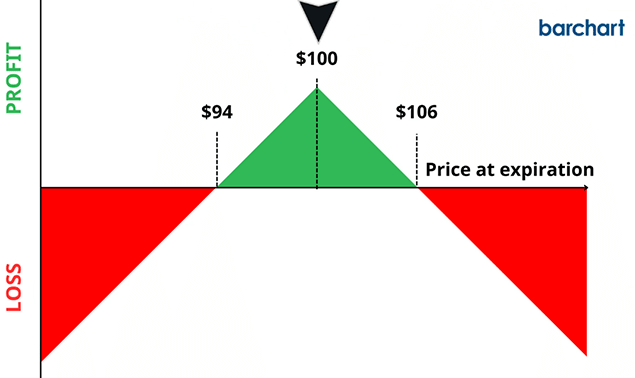
Now here’s the catch: unlike most income-generating strategies where your losses are capped, short straddles come with unlimited risk. If XYZ makes a big move in either direction - way above $106 or well below $94 - your losses can pile up quickly. So, you’re exposed in both directions.
Not only that, but you also face the risk of early assignment, especially if one leg of the trade becomes deep in the money. That’s why this strategy is best used when you expect very little movement around the strike price in the underlying stock.
But if the stock just sits there and doesn’t go anywhere, you win. Time decay works in your favor, and the closer it gets to expiration without movement, the more premium you get to keep. That’s the beauty and danger of a short straddle.
I like to refer to short straddles as a “Goldilocks” trade - because you’d want to sell them when the markets are not too hot, not too cold, and just right. They usually have roughly a 50-50 chance of profit, since you’re essentially betting that the stock will stay close to the strike price. So, it either will, or it won’t.
Finding Short Straddles With The Help of Barchart
So, how do you enhance your chances of success in trading short straddles? Finding potential trades can be difficult and definitely time-consuming, even if you already have an underlying asset in mind. This is where Barchart can help. Let me show you how.
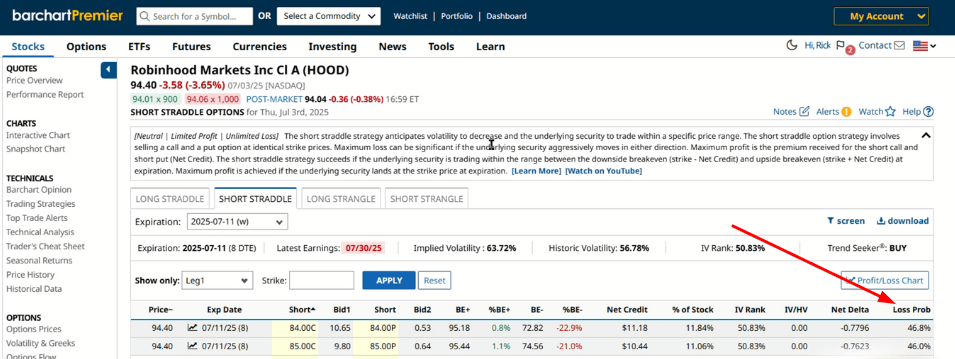
First, lets visit Barchart.com. From there, you can search for your specific underlying asset. Let’s say you want to sell short straddles on Robinhood (HOOD).
Once on the stock profile page, you’ll see all the details for the stock, including fundamental snapshots, analyst reviews, and more. For now, let’s go to the left-hand side and click Straddles and Strangles, then click the Short Straddle tab.
From there, you’ll get a list of potential straddle trades on Robinhood stock. The first thing you’d want to do is select your strike price. When selling options, I typically go for 30 to 40-day DTE trades, so it gives me more time to adjust the trade if necessary. Let’s go for August 8, 2025.
Now, we have a list of potential trades with several metrics and data available arranged in columns. What you’d want to do here is go to the loss probability column at the very end and click it until it shows the lowest to highest loss probabilities. We have a trade here that I like, with a 42% loss probability, so let’s use that as an example.
Trade Breakdown Using the P&L Chart
Everything you need to trade is right here. The screener recommends selling an 84-strike put and call on Robinhood stock for $4.35 and $15 per share, respectively, bringing your total credit to $19.35 per share or $1,935 total. The trade expires in 36 days.
In this case, the straddle is slightly skewed toward the downside, since both the put and call are struck at $84, while HOOD is currently trading at $94.40. This means the call is in the money, while the put is far out of the money. Why would a trader consider this setup?
Because the premium received—in this case, $19.35 per share—is so large, it creates a very wide profitability range. In fact, this trade profits as long as Robinhood stock stays between $64.65 and $103.35 by the expiration date. That’s a $38.70 range - lots of room for the underlying stock to move without causing a loss.
But again, the short call is in the money, so you face early assignment risk, and that’s something you need to monitor closely, and I’ll talk about risk management later.
Short straddles pay high premiums - but the chances of keeping the full premium are low because the stock would have to trade at exactly the strike price at expiration. What you want is for the stock to trade within the profit zone.
So, you’ve seen the results page has enough information to start selling short straddles. But if you’re anything like me, you’d want to dive deeper into the trade and collect every bit of information you can before pulling the trigger.
That’s where Barchart’s new P&L charting tool helps. To access it, you can either click on the Profit/Loss Chart button at the top, or the icon between the trading price and the expiration date.
P&L Chart
The chart shows all your trade details, including your setup, credit percentage, breakeven prices, net credit, and probability of loss. It also shows the P&L graph for the entire trade. The green section indicates profit, losses are red, and the arrows here show that losses go further since short straddles have theoretically unlimited downsides.
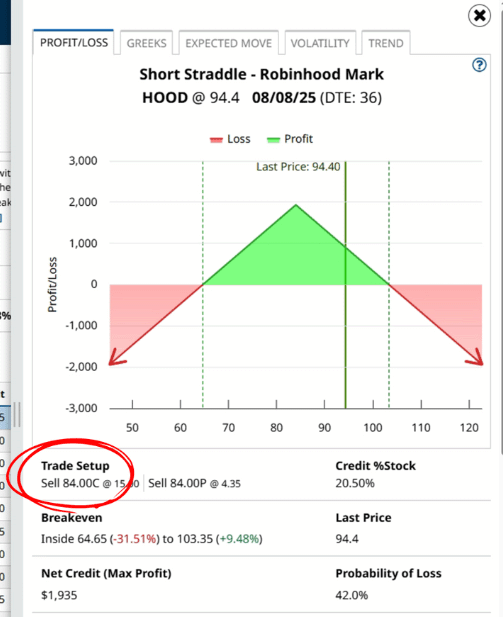
The dashed green line shows your breakeven prices - As long as the stock stays anywhere inside that range at expiration, you make a profit.
This is the range where you’d want the stock to end at expiration, so you can turn a profit. The solid green line shows the current trading price. Moving your cursor around the graph displays the specific price or loss for each price at expiration. The P&L chart is a convenient visual representation of your entire trade, helping you quickly understand the potential scenarios you face.
Greeks Tab
The next tab is for the Greeks. Options Greeks are metrics used to assess how various factors, like time, volatility, and the underlying’s trading price, affect option prices.
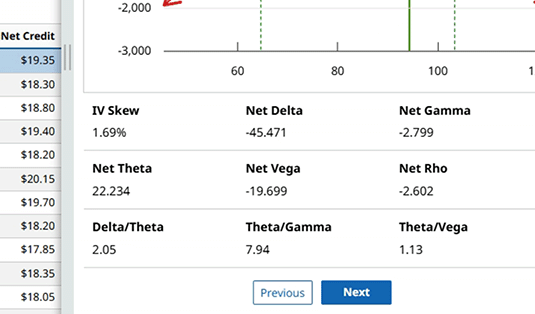
Since there are two legs in a short straddle trade, these are presented as net Greeks. In particular, keep an eye on Net Delta, which acts as a shorthand predictor of the probability of the trade expiring out of the money.
On the main screener, the default is between -0.1 and 0.1 to keep the trade as neutral as possible.
Since this trade has a -45.47 delta, it suggests there's approximately 55% probability it will expire worthless. In other words, a negative net delta close to -50 typically indicates a neutral, range-bound outlook, which is ideal conditions for a short straddle.
There’s also net theta, which indicates the daily loss in value of the trade, assuming everything else remains constant. A 22 theta suggests that the trade will lose 22 cents per day, and it being positive means that the loss has an overall positive impact on your trade. The less valuable the trade is as it approaches expiration, the less likely it is for the buyer to exercise the option.
Expected Move
Now, let’s head over to the Expected Move tab. This is one of my favorites because it projects the range where a stock is likely to trade on your selected expiration date. It’s based on 85% of the price of the at-the-money long straddle, and that range is automatically calculated and displayed both as a price range and a percentage move.
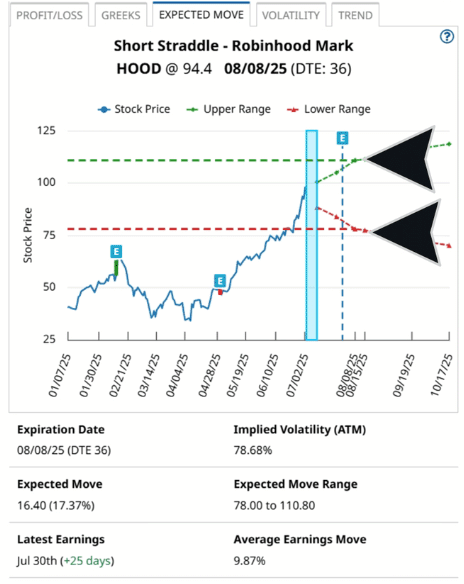
As you can see here, HOOD is expected to trade between $78 and $110.90, with the upside breakeven being $103.35 and $64.65 to the downside. This reinforces the slight downside skew of this straddle.
By the way, the expected move tab also shows the latest earnings and the actual earnings move from the past four quarters, so you can compare real past volatility against the current projection. Together, these details give you a full view of the stock’s price movement to gauge your trade.
Volatility Tab
Next is the volatility tab. This displays volatility metrics, including IV, IV rank, IV percentage, short-term volatility trends, and IV averages across various time periods.
What’s notable here is that IV is at 81%. However, IV rank is at 50.83%, historical volatility is about 57%, and the short-term volatility trend is falling.
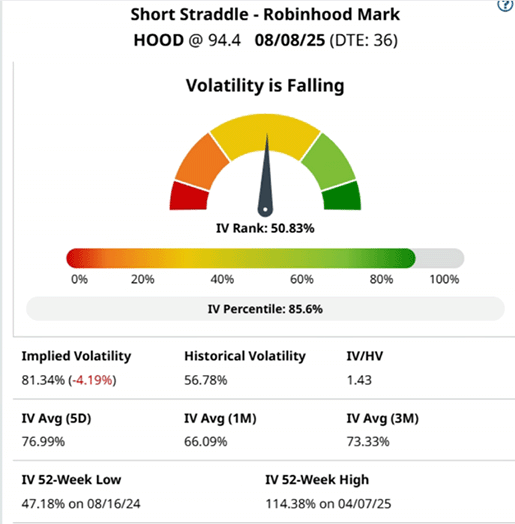
As far as short straddles go, this means that you are enjoying higher premiums due to high IV, while you face less volatility risk since IV rank is at the middle and IV itself is falling.
Trend Tab
Next is the trend tab, where you can see stock momentum metrics across short, medium, and long timeframes. It shows the stock’s position relative to the 20, 50, and 100-day moving averages or MA.
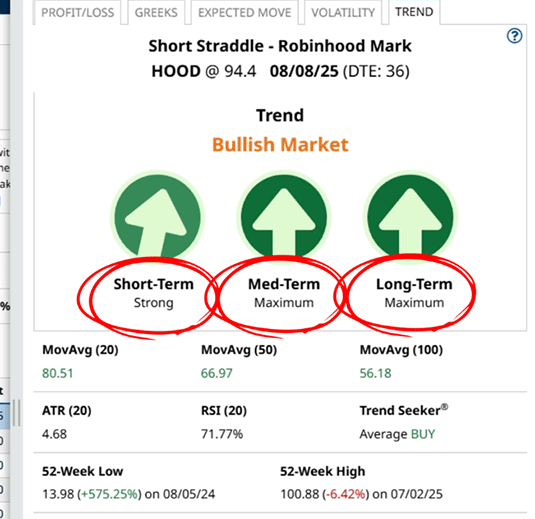
Buy ratings are based on moving averages, so this means that HOOD is trading well above its 20, 50, and 100-day MA. It also has a strong short-term trend and maximum trends across the medium and long term. This underscores the risk of this particular short straddle trade - you’re very exposed to upside price movement.
It also shows the relative strength index, which tags it as near oversold at 71.77%, and average true range of 4.68, which means HOOD has recently moved by an average of $4.68 per day. You can see how the trend tab is a favorite among technical traders.
Risk Management
But let’s go back to risk for a moment, specifically the identified upside risk. Remember that short straddles are at risk from both upside and downside. You also face the risk of early assignment, especially if either of the trades moves deep in the money.
So, how do you manage that?
The first thing to do is to monitor your positions. That means looking at price, delta, theta, and volatility as the trade progresses.
But what if the stock crosses above your breakeven price at either the upside or downside? I find it best to close out the trade altogether to cut your losses, and then if you want, you can sell another straddle at a later expiration date, or different strikes, or both.
Now, let’s fast forward a little to say, a few days before expiration and we see that Robinhood stock still trades within your breakeven prices, but one of the legs is in the money. What do you do?
Based on my experience, closing a profitable short position early is generally the best approach. For this particular example, I’ll close the short straddle if I can capture 70% to 80% of its max profit. Remember, I originally collected $19.35 combined for selling the call and put.
If I can buy back both of the short options for between $3.87 and $5.80, or 20% to 30% of the initial credit, I will. That way, I get to keep between $13.55 and $15.48 in profit and never have to think about an assignment again.

As for losses, I typically limit them to 150% to 200% of the net credit. That means if the cost to buy back the options reaches between $29 and $38.70, I’ll absolutely take the loss and close out the trade.
The point is, short straddles aren’t one-and-done trades. You need to monitor your positions, check your Greeks, watch for shifts in volatility, and adjust your trade as necessary.
Closing
Short straddles are a smart way to profit when you expect a stock to stay put. With this strategy, you collect a high premium upfront and benefit from time decay, all without having to predict which direction the market will move. However, it requires some decent price forecasting if you’re aiming for maximum profit.
That’s why reviewing trade details, whether through your own broker’s tools or using Barchart’s option screener and new P&L charting tool, is a must. The great thing about Barchart’s features is that you get immediate insight into your trade’s potential profit, breakeven zones, risk exposure, the Greeks, volatility levels, trend strength, and more, all in one place.
So here’s a challenge for you: Pick a stock you believe will stay range-bound. Use Barchart’s P&L charts to explore the trade details and understand the risk-reward profile. Then, try selling the straddle in a paper trading account. Monitor it. Practice managing the position. Adjust it if necessary. And once you’ve got the hang of it, and only when you’re confident, go live.