Short Iron Condor: Generate Income Without Picking a Direction
Did you know the short iron condor is one of the best option strategies for income generation when markets are generally neutral? Stick around as I break down the trade piece by piece and show you how Barchart’s new charting features can help you unlock the full potential of this income strategy.
What Is a Short Iron Condor?
A short iron condor, more usually known as just the iron condor, is a directionally neutral options strategy that combines two credit spreads: the bull put spread and a bear call spread, all using the same underlying security and expiration date. You collect a net credit at the start of the trade, and the goal is for all four options to expire worthless.
Core Mechanics
Now, let’s discuss the core mechanics of a short iron condor.
It’s a credit strategy, so the premium you receive at the beginning of the trade represents your maximum profit. This is calculated by subtracting the premium paid for the two short options from the total premium received. That happens if the stock stays between the short strikes until the expiration.
However, if the stock’s price moves beyond the long option strike in either direction, the trade will hit the maximum loss condition. To calculate the maximum loss, you can take the difference between the strike prices of one side of the trade (called the width of the spread) and subtract the net premium you received at the start.
The short iron condor has two breakeven prices, and they are calculated by adding the net credit to the short call strike and subtracting the net credit from the short put strike.
The short iron condor is a good strategy to use in sideways or neutral markets, though it is more complicated than other strategies.
P&L Charting
If that sounded complicated, let me show you how Barchart’s new charting feature and make trading short iron condors so much simpler.
To access the new feature, simply go to Barchart.com if you’re not there, open any stock profile page you want, and then look to the left, click Condor Strategies under the options strategy menu, then the Short Iron Condor tab.
From there, you’ll see a list of potential iron condor trades. Look for the chart icon beside the expiration date on any of the trades, and the new charting tool will appear.
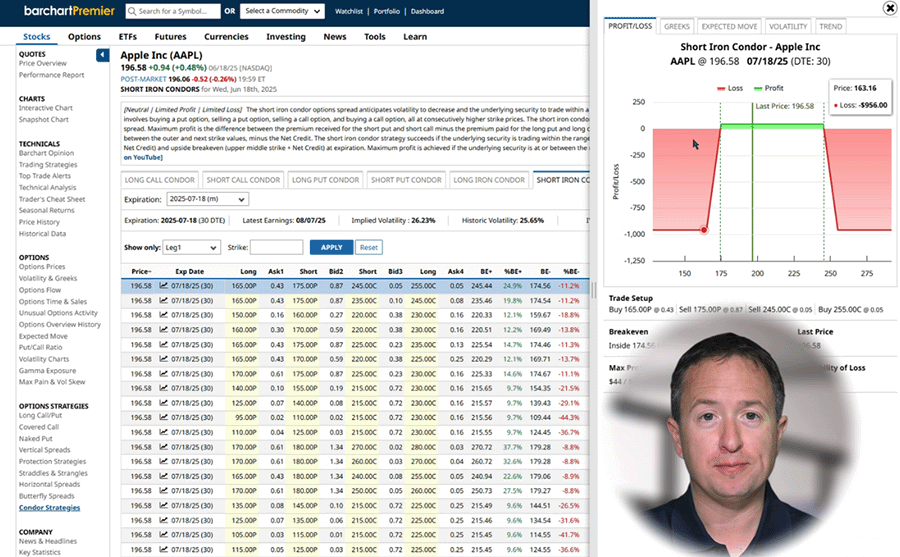
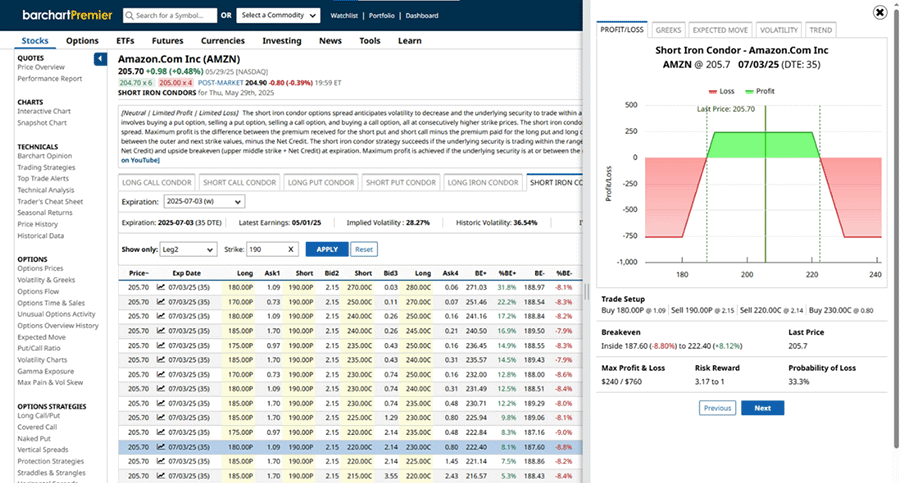
The first tab is the profit and loss chart, which displays crucial trade information. The maximum loss is red, green shows profit, and the dashed green line marks your breakeven price. A solid green line shows the current underlying price for quick comparison. You can hover over the graph to show profits and losses at different price points.
Below the chart, you’ll see a full breakdown of your trade setup, including strike prices and premiums. You’ll get a snapshot of essential trade metrics, including breakeven prices, max profit and loss, probability of profit, and risk/reward ratio. Everything is right there, interpreted and ready to help you assess the trade at a glance.
Greeks
Next tab is Greeks. Options Greeks are metrics used to assess how various factors: like time, volatility, and the underlying’s price. They all affect option prices. For multi-legged trades, such as iron condors, Greeks are displayed as net values and ratios based on those net values.
Net Delta shows your position’s directional exposure. Ideally, a short iron condor has a near-zero Delta, reflecting a neutral bias since you’re not betting on a price move in either direction. That said, low-delta trades are safer but cheaper, so you’ll have to balance profitability with risk based on your trading preference.
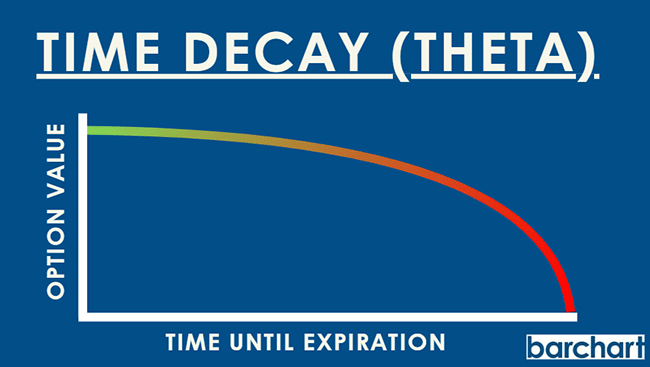
Net Theta is typically positive, meaning the position benefits from time decay. Since iron condors are credit spreads, each passing day that the stock stays within range can move you closer to maximum profit.
Net Vega is usually negative, indicating that an increase in implied volatility could hurt the trade. That’s because rising volatility expands the expected range of movement, increasing the chances that the stock breaks through one of your short strikes.
As you can see, all the necessary Greeks are displayed right here for easy reference.
Expected Move
Now, let’s head over to the Expected Move tab. This feature projects the range where a stock is likely to trade by your selected expiration date. It’s based on 85% of the price of the at-the-money straddle, and the range is automatically calculated and displayed both as a price range and a percentage move. No need for calculators or spreadsheets.
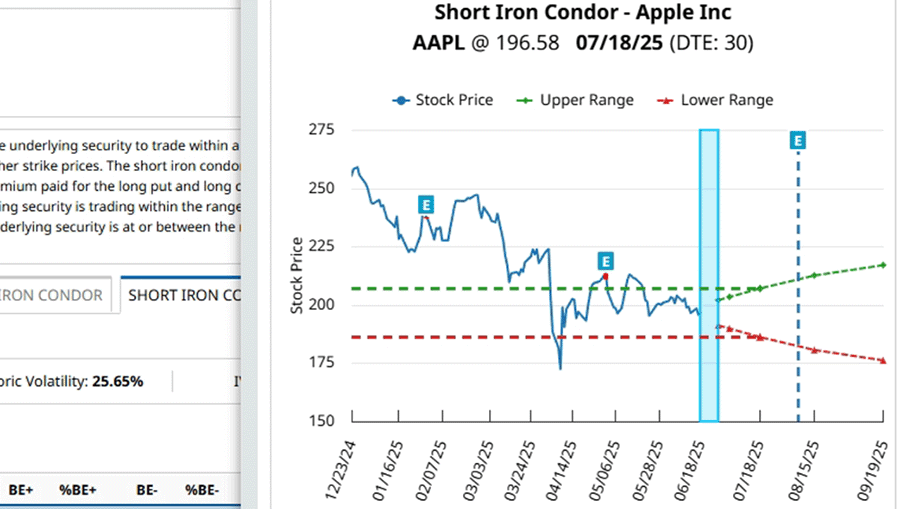
At the top, you’ll see a 6-month historical price chart, which gives you a visual sense of how the market has behaved recently. Just below that, the expected move range is plotted, offering a side-by-side view of past price action and future projections. Past and upcoming earnings events are also marked on the chart when available.
You’ll also find important contract details like expiration date, days to expiration (DTE), and implied volatility. It even includes the actual earnings move from the past four quarters, so you can compare real past volatility against the current projection. Together, these details help you review the trade’s setup more confidently.
So how do you apply this for short iron condors? You can set your short strikes near the outer edges of the expected price range to boost your profit potential while keeping risk defined. Alternatively, you can dial up the risk a little and bring the strikes closer to the current price to increase the premium received.
The point is, you can modify your trade parameters according to your risk appetite and use the expected move range as guidance.
Volatility
Next we have the volatility tab, where several key details are displayed. Let’s start with IV. Implied Volatility or IV reflects the market’s expectation of how much a stock might move in the near term. It doesn’t tell you which direction, just how significant the move could be.
IV Rank shows how current IV compares to the past, helping you gauge whether options are relatively cheap or expensive. For example, if IV is high relative to the last 12 months, IV Rank will also be high, meaning premiums are elevated.
Barchart displays both IV Rank and its interpretation up top, with ranges categorized as Very Low to Very High. The IV figure itself is based on the nearest monthly expiration with at least 30 days to go, ensuring consistency in measurement.
For even deeper insight, the tab shows a horizontal IV percentile plot, which tells you how often IV has been lower over the past year. While IV Rank tells you where the current IV sits in its range, IV Percentile tells you how frequently it's been lower, which both help understand volatility in the context of your specific trade.
Barchart also factors in short-term volatility trends, displayed as rising or falling, based on key metrics like volatility comparisons across different time periods and relationships between historical and implied volatility. No need for complicated calculations and comparisons between 5-day IV and IV over HV - all the details are here, stated, interpreted graphically, and ready for use.
For short iron condors, high but falling volatility is ideal since premiums are higher upfront, and decreasing IV lowers the chance of a breakout past your short strikes.
Trends
The last tab to check out is Trend: your go-to for gauging stock momentum across short, medium, and long timeframes. It shows the stock’s position relative to the 20-day, 50-day, and 100-day moving averages - a favorite among technical traders.
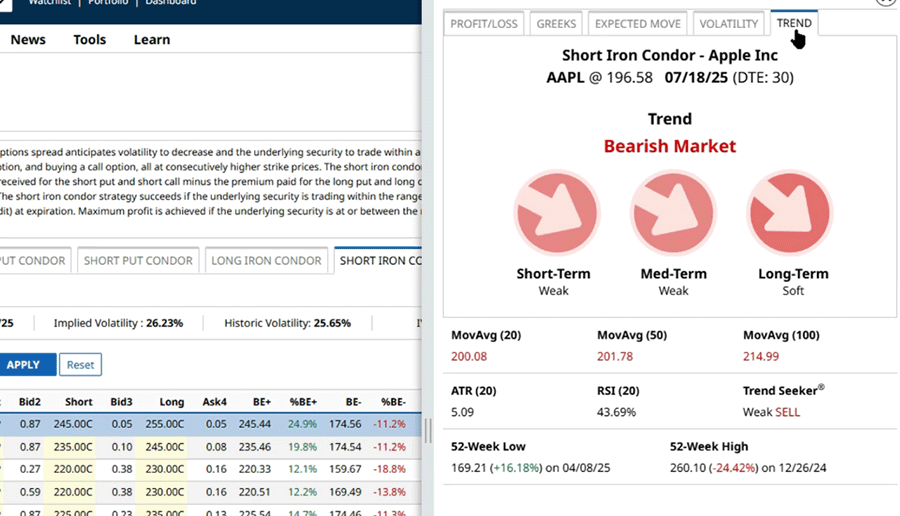
If the price is above the moving average, that’s considered bullish; below means bearish. You’ll see this visualized with color-coded arrows: green for bullish, red for bearish, and the angle of the arrow shows how strong the signal is based on how far the price has moved from the average.
Below that, the actual moving average values are listed, helping you confirm whether the market is trending or range-bound.
You also get some helpful technical indicators here. ATR, or Average True Range, reflects volatility over the past 20 days and can be used to set stops or targets.
RSI, the Relative Strength Index, shows momentum strength. High readings suggest overbought conditions, low ones suggest oversold, and it can even act as a lead indicator when trends start to shift.
Barchart also includes Trend Seeker, a proprietary tool combining volatility, wave theory, and the 50-day EMA to give a clear Buy, Sell, or Hold signal.
Lastly, 52-week highs and lows are included to help spot key support or resistance levels. This tab gives you a quick, technical look at the trend strength and direction without needing to plug dozens of technical indicators into your charts. It also gives you a good idea of how risky your chosen short condor trade is based on technical indicators and anticipated price directions.
Building a Short Iron Condor Trade
Now that we’ve covered Barchart’s new P&L feature, let’s use it to build a real-time trade. First, you can select your underlying asset. Let’s use Amazon for this example and go to its profile page. For reference, the stock is trading at $205.70 at the time of recording.
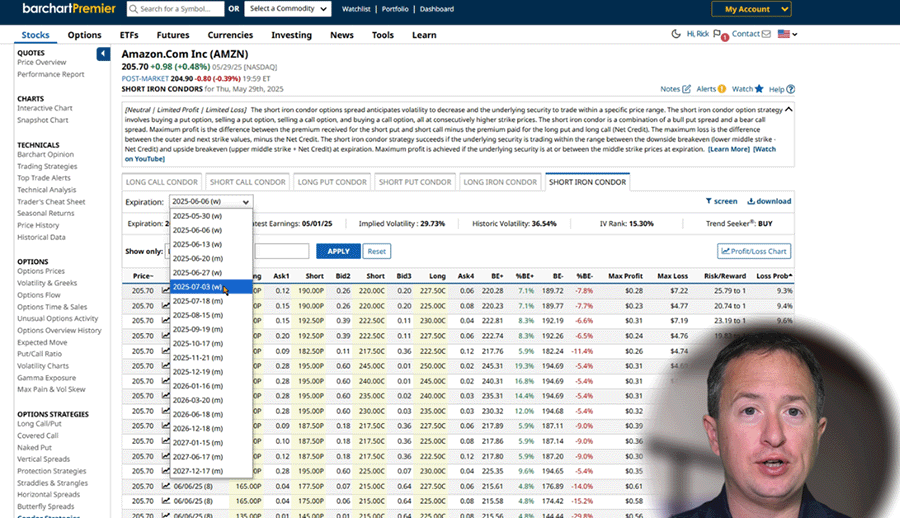
Once there, click Condor Strategies on the left-hand side of the screen, then the Short Iron Condor tab. You will be directed to a results page with several potential iron condor trades. The first thing you do is change the expiration date to your preferred period. I typically trade 30-45 days expiration, so let’s choose July 3 here.
Now that we’re there, click on the profit/loss chart at the top right of the results list to pull up the new graphing feature, then go to Expected Move. Remember, the expected move plots the anticipated trading range of a stock based on options prices, so we can use this as a rough guide for setting the inner short strikes.
According to the graph, AMZN is expected to trade between $218.35 and $193.05 by July 3. This range sure beats trading blind.
Let’s change the Leg dropdown here to Leg 2, which is your short put strike. Since strikes are $5 apart, let’s use $190 as the closest strike. Type that in, click apply, and here are all available short iron condor trades with a 190-strike short put.
Now, there are several ways to go about this. The list is arranged by lowest to highest loss probability by default, which can be helpful for risk-averse traders.
For this example, though, I’ll use the expected move range as the basis for our put-call short strikes, so that’s $190 and $220.
So, now I’ll scroll down, and it appears like there are three suggested trades with those short strikes, with different risk/reward ratios and loss probability. I’ll use the middle one here, as it has a reasonable 33.3% probability of loss and a 3.17 to one risk/reward ratio, which is the lowest of the three.
According to the screener, here are the details of this short iron condor:
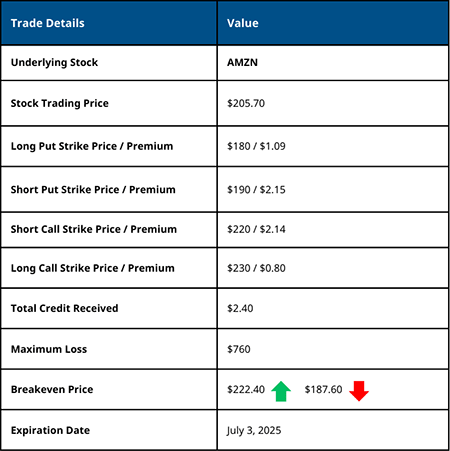
- The long put strike is $180, and you pay $1.09 for it.
- The short put strike is $190, and you receive $2.15 for it.
- The short call strike is $220, and you get $2.14 for it.
- And lastly, the long call strike is $230, and you pay 80 cents for it.
Altogether, that brings the total net credit to $2.40, while breakeven prices are $187.60 on the downside and $222.40 on the upside.
[Calculation: ($2.15 + $2.14) - ($1.09 - $0.80) = $2.40]
Now, let’s go over the P&L Charts by clicking on the icon right between the trading price and expiration date. You can cycle through the tabs as you see fit to check the values.
For now, I’d like you to note several key details. On the volatility tab, short-term volatility is low, IV rank is 15.3%, and IV itself is 28.75%. Overall, they’re pretty low, so while you might not receive higher premiums, the low volatility should work in your favor.
Next is the trend tab, where it says Amazon has a soft bullish short-term outlook. “Soft bullish” indicates limited upside price movement in the short term, which is ideal for a short iron condor trade.
If you’re not happy with the selected trade, maybe you want a safer or riskier but more profitable one, you can always check out the others on the list. It’s that simple.
Why Visualizing The Trade Is a Game Changer
Managing an options trade used to mean juggling strike selections, premiums, expirations, volatility metrics, and Greeks on a spreadsheet. It wasn’t always clear, and it certainly wasn’t quick.
But with Barchart’s new visualization tools, that process becomes far more intuitive - and far more convenient. Profit, loss, breakeven points, expected move ranges, volatility, Greeks - practically anything you need to know for a well-constructed short iron condor trade is right here. You get a full view of your trade setup before you even need to look at your broker’s app or site, making it easier to stay consistent with your strategy and adjust based on real-time changes.
No more piecing together numbers or second-guessing. Just sharp, visual insight designed to help you trade smarter and with greater confidence.