The Barchart Profit and Loss Chart: More Than Just a Graph
The Barchart profit and loss display goes far beyond a simple chart. It’s a comprehensive interface that gives you everything you need to evaluate an options trade — from breakeven points and Greeks to volatility, trend momentum, and earnings- driven moves.
At the top, five key tabs organize the most critical trade components: [Profit/Loss], [Greeks], [Expected Move], [Volatility], and [Trend]. Each offers a unique perspective to help you make more informed, data-driven decisions. Here’s what they reveal:
First Tab: The Profit/Loss chart
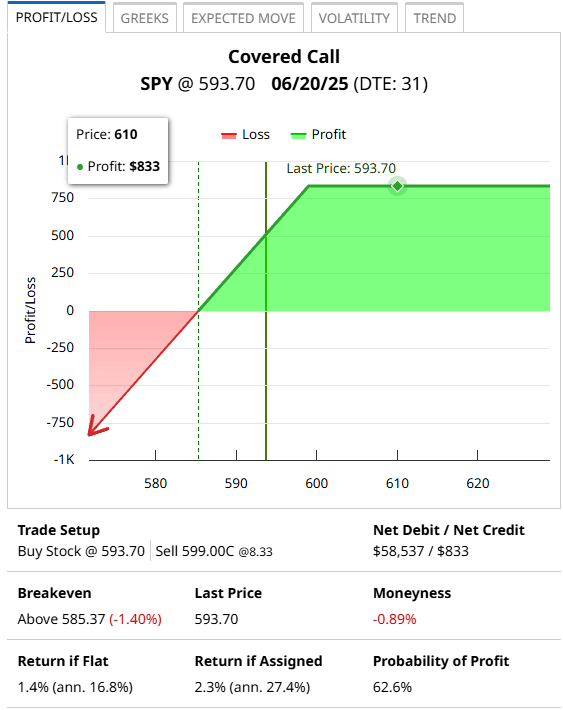
- This chart shows profit and loss scenarios based on the underlying price
- Hover your mouse to view specific price levels and potential outcomes
- A dashed green line marks the breakeven price, while a solid green line shows the current price.
This tab also breaks down your trade setup, including:
- Trade Structure: Pricing and positioning for each leg
- Breakeven: Price(s) the underlying must hit for profitability, along with how far the current price is from that level. A positive figure means the underlying is below, while a negative number means the underlying is above the breakeven price.
- Moneyness: For single-leg trades, moneyness is the percentage distance between the last price and the respective strike price and will be displayed next to the last price.
- Outlook: This tool displays key metrics such as return on premium, max profit/loss, risk/reward ratio, and probability of profit or loss.
Second Tab: Options Greeks
Understand the trade’s risk profile with the full set of Greeks:
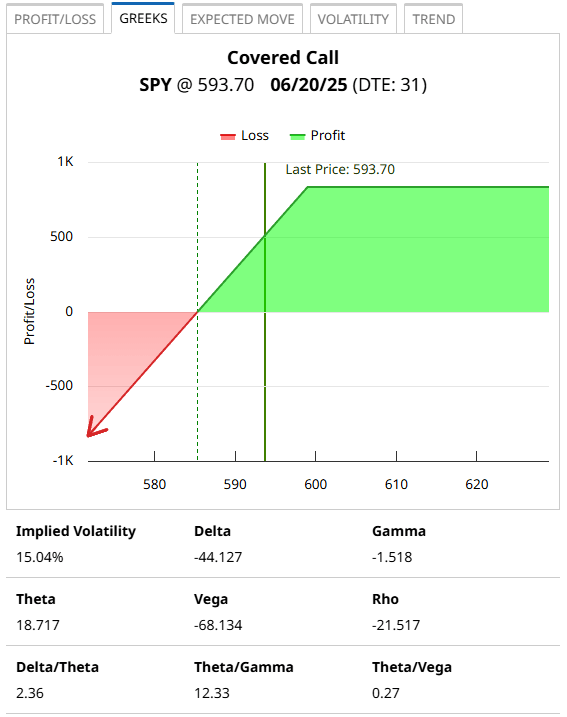
- Single-leg trades show individual Greeks — Delta, Gamma, Theta, Vega, Rho, and IV
- Multi-leg trades display IV skew, net Greeks for the trade, and ratios based on the net values.
The displayed Greeks will highlight directional bias and risk exposure.
Third Tab: Expected Move
This tab projects the potential range the underlying may trade through expiration.
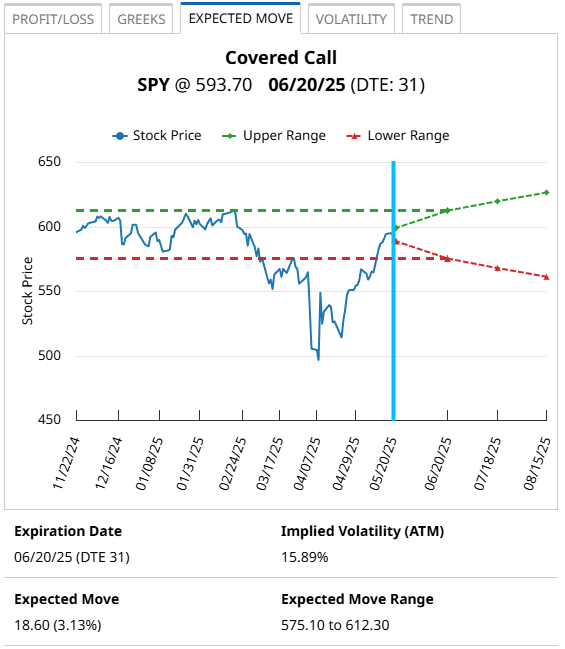
- Based on 85% of the at-the-money straddle's value for a particular expiration
- Displayed as both a price range and a percentage move
- Includes a 6-month historical chart at the top to show how the market has moved historically.
- The historical chart is followed by the range based on the expected move, providing a visual overview of how the market could move.
- Past and Future earnings are overlaid on the chart when available. When used together, the price history and expected move charts provide a higher confidence level about the expectation of the move over the contract’s life.
- Provides details such as the contract’s expiration, days to expiration, and the contract’s implied volatility reading (based on the average IVs for the ATM straddle - call and put immediately above and below the underlying price).
- It also includes the actual earnings move based on the past four reports.
This section helps validate whether the projected range aligns with your trade’s goals.
Fourth Tab: Volatility
See how implied volatility stacks up — critically important for assessing credit vs. debit trade setups.
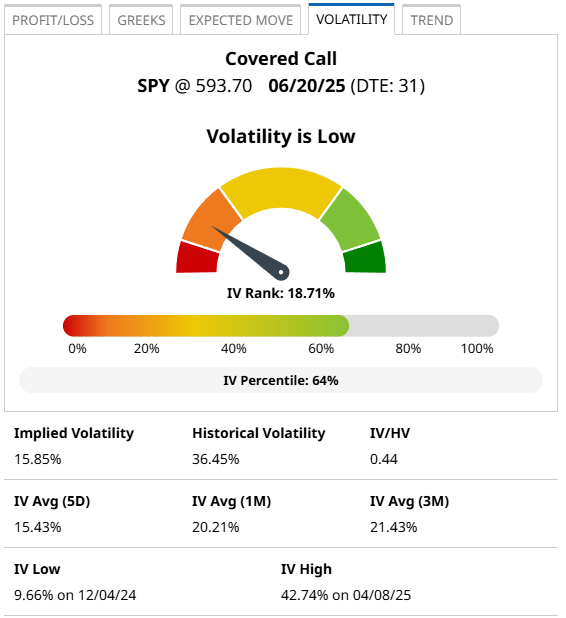
- IV figures are based on the nearest monthly expiration at least 30 days from expiration
- IV Rank and Barchart’s interpretation is displayed at the top
- Very High IV (90+), High IV (70-90), Average IV (30-70), Low IV (10-30), Very Low IV (Under 10)
- The exception is if the 5-Day Average IV is at least 5% less than the 20-Day Average and the IV/HV (implied volatility over 30-day historical volatility) is less than 0.90, along with a decreasing IV, is displayed as Falling IV. Similarly, if the 5- Day Average IV is at least 5% greater than the 20-Day Average IV and the IV/HV ratio is greater than 1.09, along with a rising IV, is displayed as Rising IV.
- IV percentile horizontal plot is also displayed, which measures the number of days IV has been lower over the past year. IV Rank measures where IV falls within its 52-week range; a higher figure signifies an elevated IV reading in both cases. A high IV reading with falling volatility is preferred for credit trades, whereas a low IV reading with rising volatility is preferred for debit trades.
- Below the chart, we list the corresponding volatility readings, which are the current 30-day forward implied volatility and 30-day historical volatility readings along with their ratio. Also displayed is the average 30-day forward implied volatility over various periods (5 days, 1 month, and 3 months), and finally, the highest and lowest readings over the past year.
Fifth Tab: Trend
Gauge the underlying momentum using trend indicators:
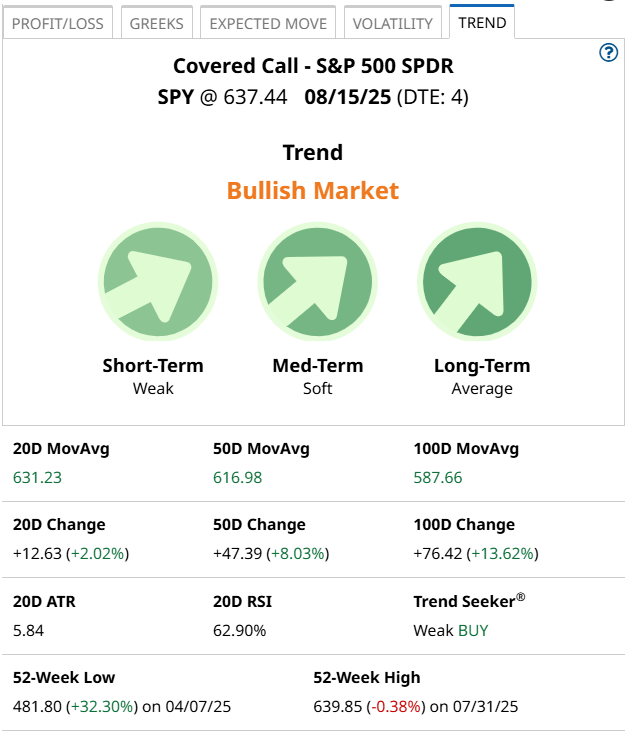
- Charts for short-term (20-day), medium-term (50-day), and long-term (100- day) moving averages. A price above is considered bullish, while a price below is bearish.
- Bullish/Bearish sentiment shown by color and angle of movement
- Signal strength reflects how far the price is from the average; the greater the distance, the stronger the signal strength.
- Essential for directional or neutral trades, showing whether the market is channeling or trending.
- Actual values for the time frames are provided below the chart, color-coded to match the study’s common interpretation.
- The price and (percent change) values over the corresponding period, highlighting the strength of the move.
Also provided:
- ATR (Average True Range): Reflects price movement over the past 20 days. Traders use multiples of ATR to set price targets and stops.
- RSI (Relative Strength Index): Shows the strength of price activity over the past 20 days. Commonly used to figure out whether the market is overbought (high reading) or oversold (low reading). Can also be used as a leading indicator compared to the moving average; a high RSI in a short- term bearish trend could suggest a forthcoming price rally.
- Trend Seeker: Barchart’s proprietary indicator combines volatility, wave theory, and the 50-Day exponential moving average to give Buy/Sell/Hold signals.
- 52-week highs/lows: Historical price range, which can often function as support/resistance levels.
Together, these five tabs offer a powerful, multi-angle analysis of every options trade. They help you assess profitability, risk, volatility exposure, market expectation, and trend strength all in one place. Use them to boost your edge and trade with confidence.
Recommended viewing for expanding your trading knowledge as well as learning more about Barchart's Profit and Loss Charts:
- Maximize Covered Call Profits with Barchart's New P&L Charts
- Long Put Option Trades Visualized: See Risk, Reward, and Breakeven Instantly
- Naked Put Strategies Made Clear: Net Credit, Break-Even, and Greeks at a Glance
- How to Turn Credit Spreads into Cash with this Barchart Tool
- How to Find Winning Options Trades with Barchart (Step-by-Step Guide)