What you need to know…
The S&P 500 Index ($SPX) (SPY) on Wednesday closed down -1.71%, the Dow Jones Industrials Index ($DOWI) (DIA) closed down -1.70%, and the Nasdaq 100 Index ($IUXX) (QQQ) closed down -1.80%.
Stocks on Wednesday whipsawed lower after the FOMC meeting, with the S&P 500, the Dow Jones Industrials, and the Nasdaq 100 falling to 2-1/4 month lows and closing on their lows. Stocks briefly pushed higher Wednesday afternoon after T-note yields fell back from a new 11-year high but then sold off into the close on the outlook for Fed to continue aggressively tightening monetary policy.
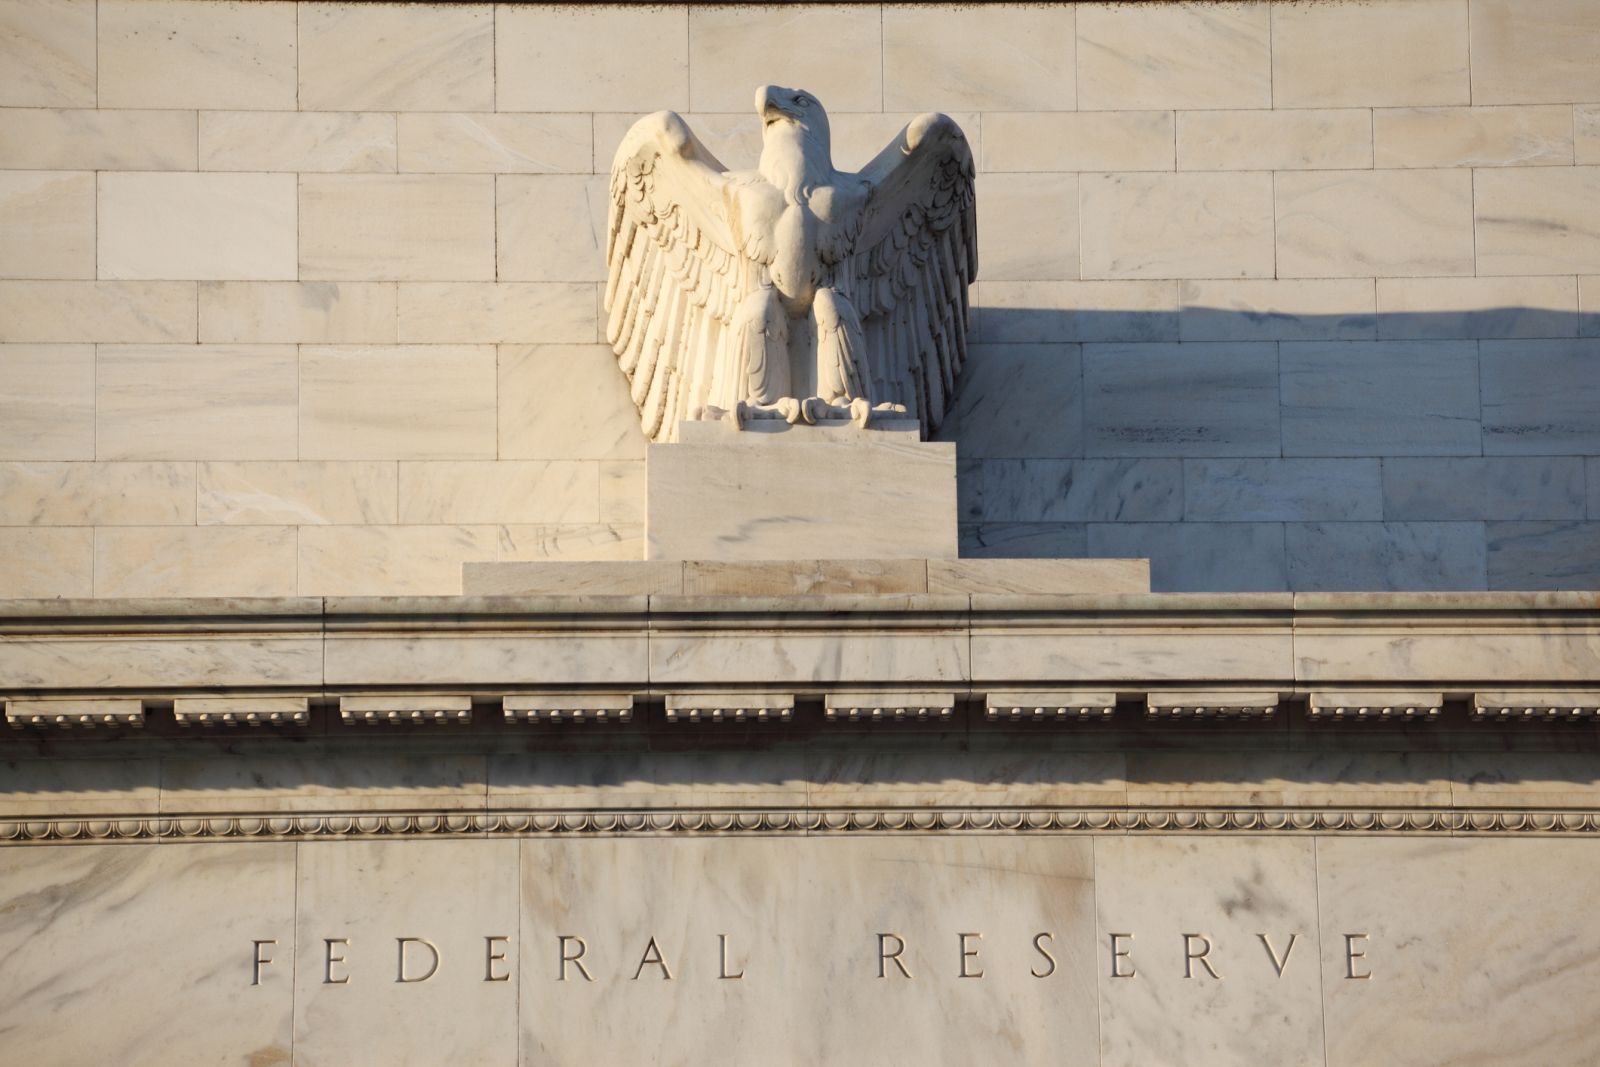
The FOMC, as expected, unanimously raised its federal funds target range by +75 bp to 3.00%-3.25%. The post-meeting statement said the FOMC "is highly attentive to inflation risks and "anticipates that ongoing increases in the fed funds target range will be appropriate" as the committee "is strongly committed to returning inflation to its 2% objective."
The Fed's dot-plot signals a steeper interest rate hike path than officials laid out in June. The FOMC forecasts the fed funds rate at 4.4% by year-end, higher than a 3.4% forecast in June, and at 4.6% by end-2023, higher than a June estimate of 3.8%.
The FOMC lowered its U.S. 2022 GDP forecast to 0.2% from 1.7% in June and cut its 2023 GDP estimate to 1.2% from 1.7% in June. The FOMC also raised its U.S 2022 core PCE forecast to 4.5% from 4.3% in June and raised its 2023 core PCE forecast to 3.1% from 2.7% in June.
Fed Chair Powell said the FOMC sees risks to inflation weighted to the upside, and the committee seeks to return to "sufficiently restrictive" interest rates.
Wednesday’s U.S. housing news was supportive for stocks after Aug existing home sales fell -0.4% to 4.80 million, stronger than expectations for a decline to 4.70 million.
Today’s stock movers…
Hotel and travel stocks sold off Wednesday on concern tighter Fed policy will push the economy into recession and curb consumers’ discretionary income. Caesars Entertainment (CZR) closed down more than -8% to lead losers in the S&P 500 and Las Vegas Sands (LVS) closed down more than -6%. Also, Marriott International (MAR) closed down more than -5% to lead losers in the Nasdaq 100.
Expedia Group (EXPE), United Airlines Holdings (UAL), Hilton Worldwide Holdings (HLT), American Airlines Group (AAL), Wynn Resorts (WYNN), MGM Resorts International (MGM), and Host Hotels & Resorts (HST) closed down more than -5%. Delta Air Lines (DAL), Alaska Air Group (ALK), and Booking Holdings (BKG) closed down by more than -4%.
Cruise line operators retreated Wednesday, with Royal Caribbean Cruises (RCL) closing down more than -5% after Truist Securities cut its price target on the stock to $58 from $65. Carnival (CCL) closed down more than -6%, and Norwegian Cruise Line Holdings (NCLH) closed down more than -4%.
U.S.-listed Chinese stocks moved lower Wednesday amid tensions between China and Taiwan. Pinduoduo (PDD), NetEase (NTES), JD.com (JD), and Baidu (BIDU) all closed down by more than -5%.
General Mills (GIS) closed up more than +5% Wednesday to lead gainers in the S&P 500 after it boosted its 2023 organic net sales forecast to up 6%-7% from a previous estimate of up 4%-5%, stronger than the consensus of up 5.68%. Other food stocks rallied on the General Mills news as Kellogg (K) closed up more than +2%. Also, Campbell Soup (CPB), Kraft Heinz (KHC), Hormel Foods (HRL), and Conagra Brands (CAG) closed up more than +1%.
Walmart (WMT) closed up +0.91 Wednesday to lead gainers in the Dow Jones Industrials after CEO Furman said “there’s a lot of customer demand still in the market” as he announced that Walmart plans to hire 40,000 seasonal workers for the holiday season this year.
Illumina (ILMN) closed up more than +1% Wednesday to lead gainers in the Nasdaq 100 after life insurer John Hancock announced that it would begin offering thousands of customers access to cancer blood tests made by Illumina’s Grail unit. About 10,000 eligible customers will receive full or half subsidies for the tests.
Across the markets…
Dec 10-year T-notes (ZNZ22) on Wednesday closed up +12.5 ticks, and the 10-year T-note yield fell -3.9 bp to 3.524%. Dec T-notes Wednesday recovered from a contract low, and nearest-futures Sep T-notes (U22) rebounded from a 13-year low. The 10-year T-note yield fell back from an 11-year high of 3.624%. Curve flattening trades Wednesday helped Dec T-notes recover from early losses and move higher after the action by the Fed to signal it will continue to raise interest rates aggressively pushed short-term interest rates higher and knocked longer-term rates lower.
10-year T-notes also recovered losses Wednesday and moved higher on comments from Fed Chair Powell, who predicted “higher interest rates, slower growth, and a softening labor market” as a consequence of the Fed’s campaign to restore price stability. T-notes also garnered some safe-haven demand Wednesday after stocks whipsawed lower into the close after the Fed hiked interest rates and signaled more rate hikes to come.
More Stock Market News from Barchart


/Alphabet%20(Google)%20Image%20by%20Markus%20Mainka%20via%20Shutterstock.jpg)

/Palo%20Alto%20Networks%20headquarters%20campus%20exterior%20of%20cybersecurity%20company%20By%20MichaelVi.jpeg)