[[ type === 'moc' ? 'MARKET ON CLOSE' : 'FREE WEBINAR' ]]
[[ timeLabel ]] WATCH LIVE:
Your browser of choice has not been tested for use with Barchart.com. If you have issues, please download one of the browsers listed here.
Stocks | Futures | Watchlist | News | More
or
Faster, Cleaner, Better.

Michigan Consolidated Gas Co. MichCon Basis Swap Platts IFERC Oct '19 (JNFV19)

[[ item.lastPrice ]] [[ item.priceChange ]] ([[ item.percentChange ]]) [[ item.tradeTime ]] [NYMEX]
[[ item.bidPrice ]] x [[ item.bidSize ]] [[ item.askPrice ]] x [[ item.askSize ]]
[[ rootItem.symbol ]]underlying price [[ rootItem.lastPrice ]] [[ rootItem.priceChange ]] ([[ rootItem.percentChange ]]) [[ rootItem.tradeTime ]]
Quote Overview for [[ item.sessionDateDisplayLong ]]
[[ rowChartData.labelLow ]]
[[ rowChartData.lowPriceFormatted ]]
[[ rowChartData.lowPrice ]]
[[ rowChartData.labelHigh ]]
[[ rowChartData.highPriceFormatted ]]
[[ rowChartData.highPrice ]]
since [[ rowChartData.lowDate ]]
since [[ rowChartData.highDate ]]
[[ value ]] [[ value ]] ([[ financialData.relativeStrengthDirection14d ]]) ([[ financialData.highPercent1y ]]) ([[ financialData.lowPercent1y ]])

Contract Specifications

See More
Contract
N/A
Contract Size
N/A
Tick Size
N/A
Trading Hours
N/A
Exchange
NYMEX
Point Value
$100
Expiration Date
09/30/19 (expired)
Get Realtime - Quotes and Charts for Futures Traders. Learn More >>

More Michigan Consolidated Gas Co. (MichCon) Basis Swap (Platts IFERC) Quotes

All Futures Prices
Please wait...

Most Recent Stories

More News
Travel Is Struggling, But Unusual Options Activity Shows Someone Just Bet Big on Booking Holdings Stock

Booking Holdings saw significant unusual option activity yesterday, including 31,000 July 17 $160 calls traded. Despite global travel headwinds, this multi-leg institutional position suggests a strategic,...

MSFT : 402.78 (-5.11%)
GOOGL : 384.37 (+9.84%)
META : 613.28 (-8.35%)
NVDA : 201.26 (-3.82%)
AAPL : 273.60 (+1.27%)
TSLA : 379.51 (+1.80%)
BKNG : 168.70 (-3.03%)
SPY : 717.10 (+0.78%)
AMZN : 260.31 (-1.04%)
Cotton Rallying the Limit on Thursday

Cotton futures are trading with Thursday gains of the 3 cent limit in July, with in delivery May up 552 points. The US dollar index is down $0.782 at $98.040. Crude oil is back down $2.75 to $104.13....

CTN26 : 82.20 (+3.79%)
CTK26 : 82.38 (+7.18%)
CTZ26 : 82.51 (+2.55%)
Corn Feeling Month End Pressure at Midday

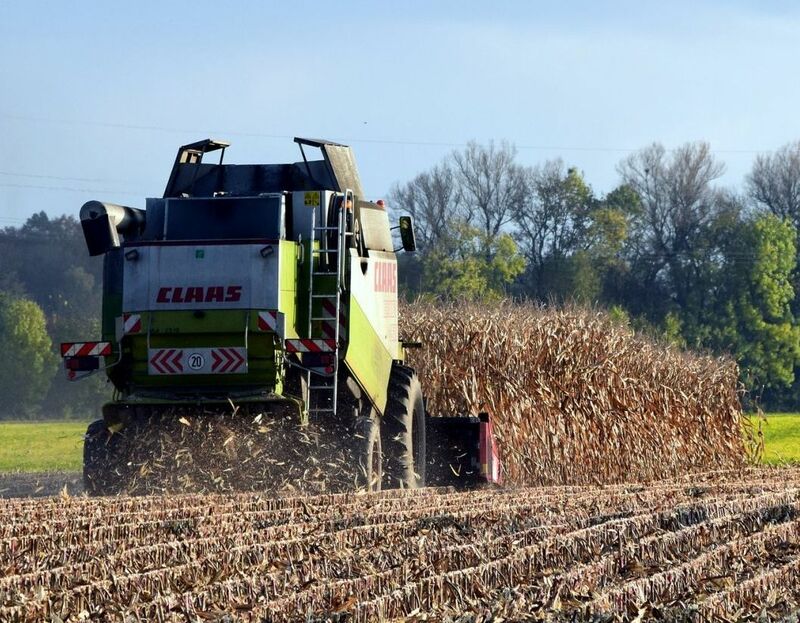
Corn futures are trading with 2 to 3 ½ cent losses at Thursday’s midday, as month end pressure and wheat weakness spillover is weighing on the market. There were 19 delivery notices overnight on First...

ZCZ26 : 494-0 (-0.75%)
ZCN26 : 474-0 (-0.78%)
ZCK26 : 463-6 (-0.59%)
ZCPZ26US.CM : 4.5743 (-0.65%)
ZCPAUS.CM : 4.3045 (-0.85%)
Hogs Falling Back at Thursday’s Midday

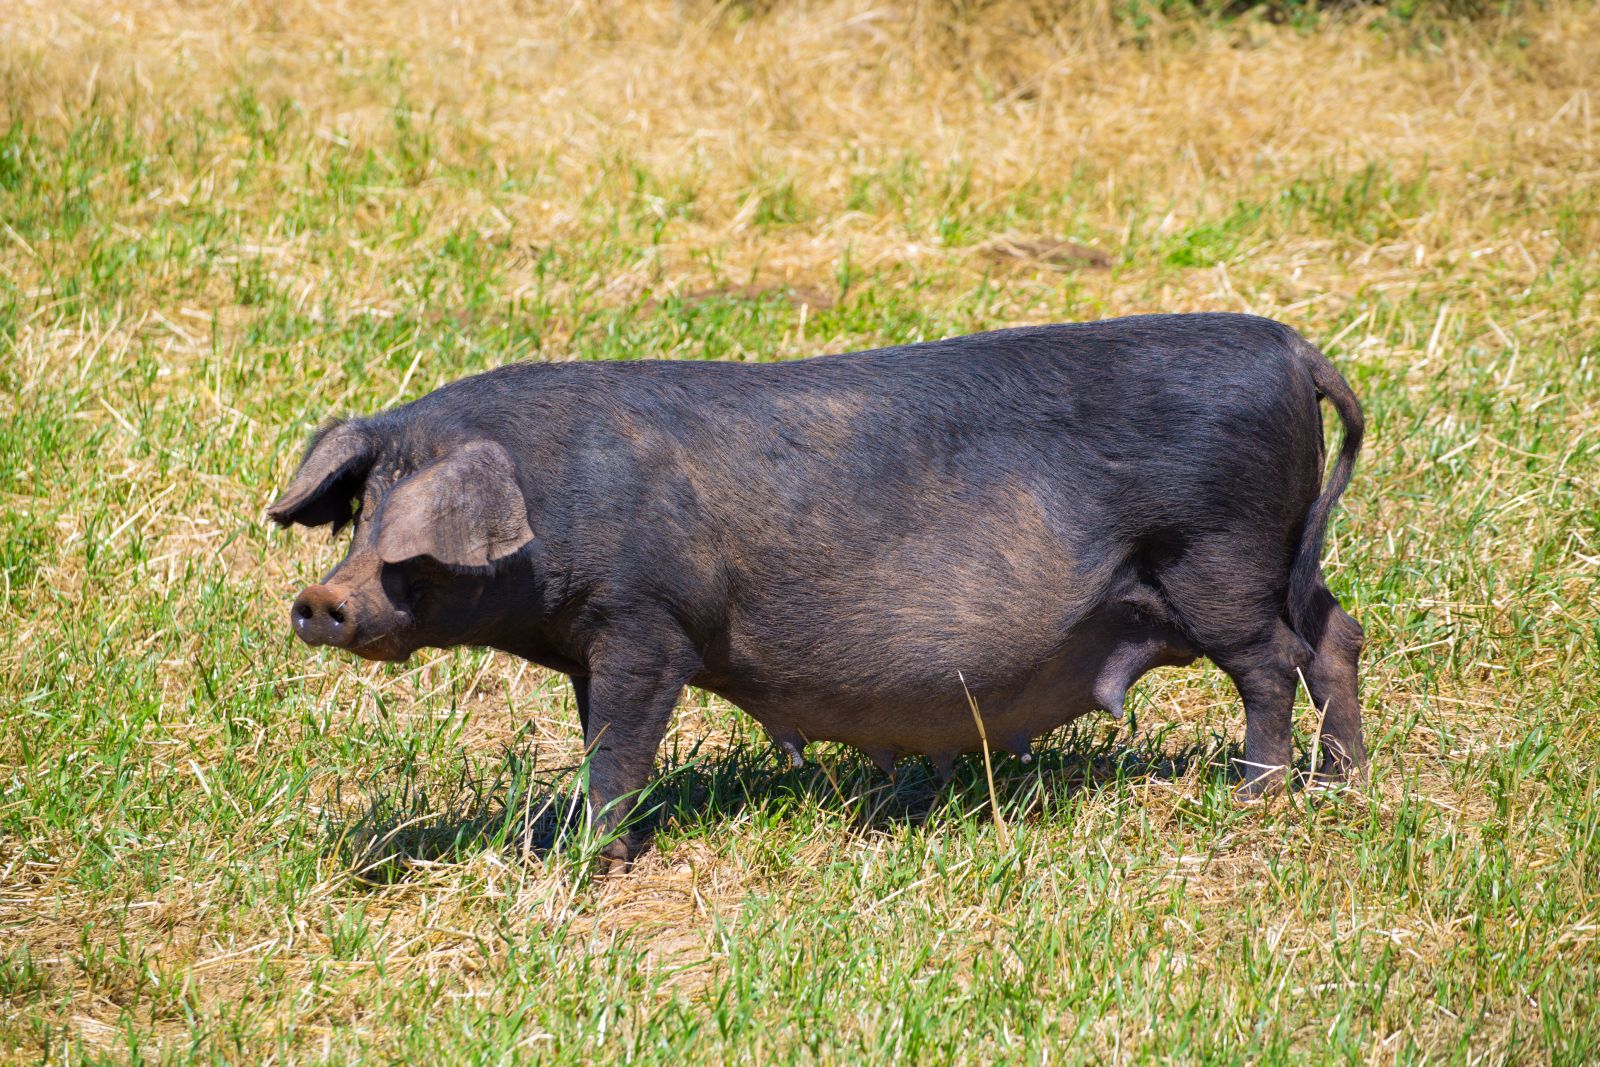
Lean hog futures are down 67 cents to $1.37 at midday. USDA’s national base hog price was reported at $93.43 on Thursday morning, up 56 cents from the day prior. The CME Lean Hog Index was back up 12...

HEM26 : 102.475 (-1.23%)
HEK26 : 93.425 (-1.76%)
HEN26 : 105.425 (-0.80%)
Wheat Facing Month End Pressure on Thursday

The wheat complex is falling back on Thursday. Chicago SRW futures are falling 15 to 18 ¼ cents. There were 400 deliveries against May CBT wheat overnight. KC HRW futures are 5 to 13 cents in the red...

KEN26 : 691-6 (-1.84%)
KEK26 : 677-6 (-1.81%)
MWK26 : 6.9975 (-0.29%)
ZWK26 : 622-0 (-3.15%)
ZWN26 : 635-4 (-2.68%)
Soybeans Back to Mixed Midday Trade on Thursday

Soybeans are showing mixed trade on Thursday with contracts fractionally lower to 2 cents higher, mainly in the new crop. The cmdtyView national average Cash Bean price is down 3 1/4 cents at $11.22 1/4....

ZSPAUS.CM : 11.2402 (-0.14%)
ZLN26 : 74.67 (+0.74%)
ZMN26 : 319.6 (-1.30%)
ZSPX26US.CM : 11.0557 (+0.11%)
ZSX26 : 1173-6 (+0.21%)
ZSK26 : 1183-4 (+0.11%)
ZSN26 : 1196-6 (-0.02%)
Cattle Posting Mixed Thursday Trade

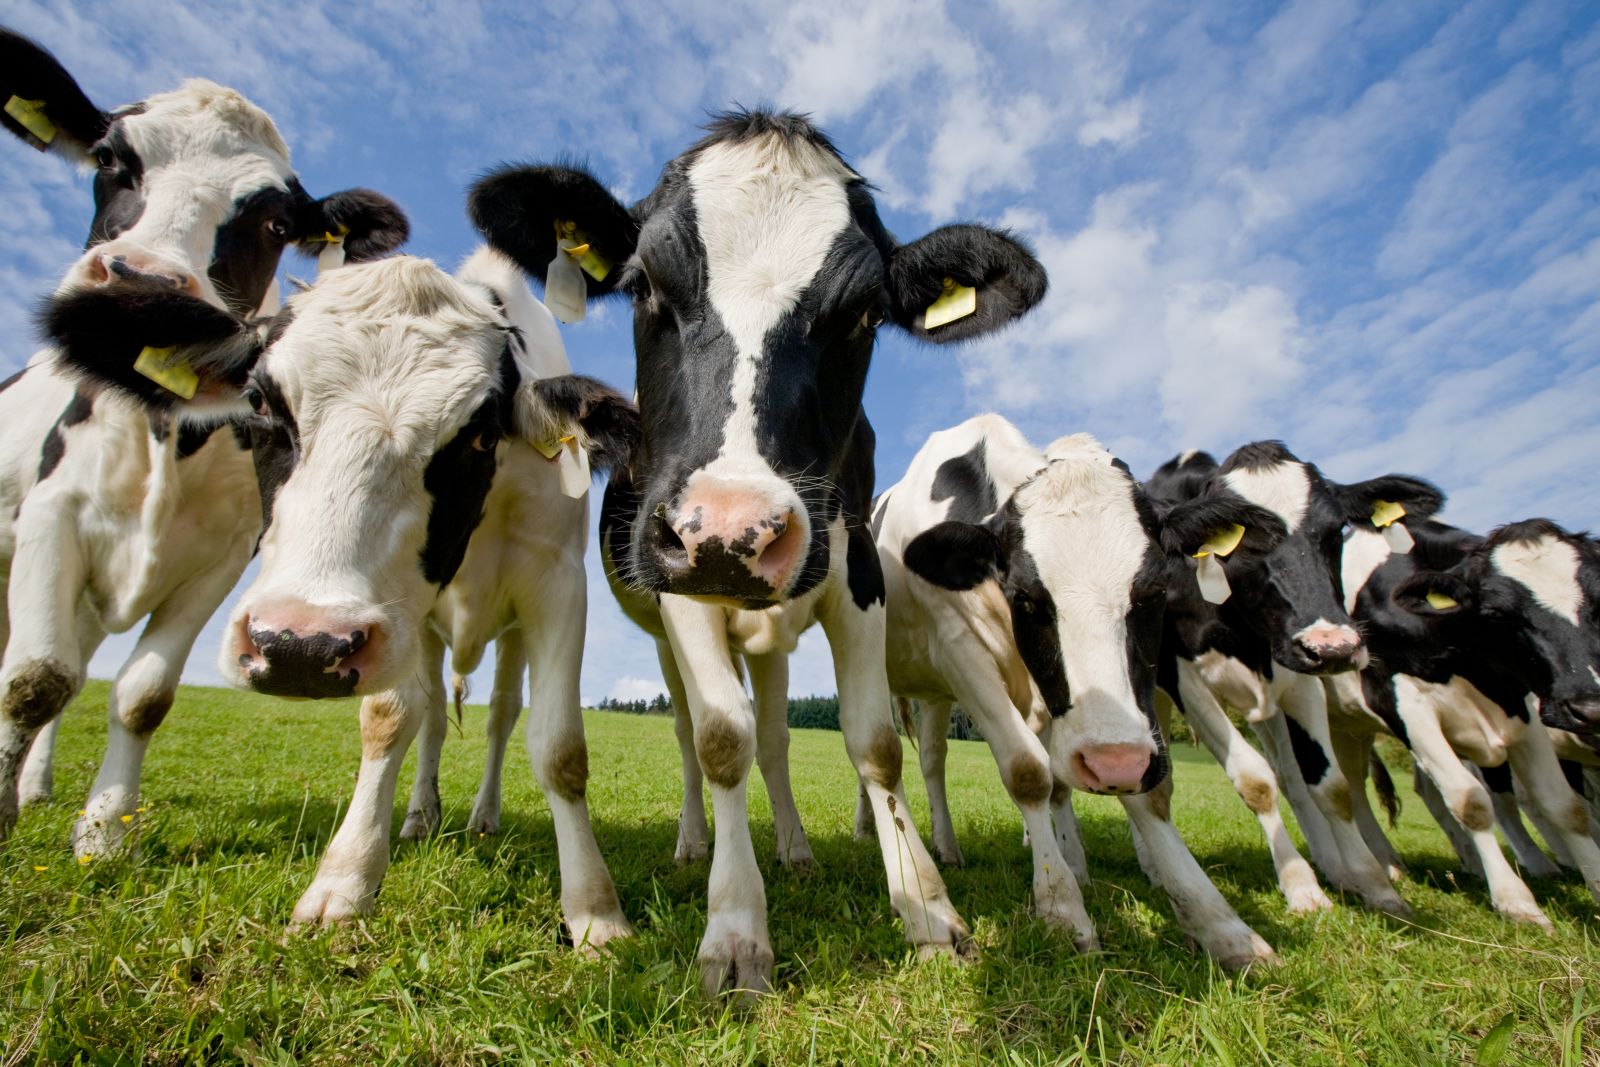
Live cattle futures are trading with April gains of $1.60 and other contracts down 7 to 67 cents. Cash trade got kicked off early again this week, starting at $250-252 across the country and working up...

LEQ26 : 249.225 (-0.20%)
LEM26 : 254.525 (-0.28%)
LEJ26 : 258.475 (+0.62%)
GFK26 : 373.250 (+0.47%)
GFJ26 : 373.750 (+0.40%)
GFQ26 : 374.000 (+0.40%)
MoneyMasters Podcast: Charts, Trends, and Top Trades with Parets and Strazza

Market experts JC Parets (TrendLabs) and Steve Strazza (All Star Charts) join this MoneyShow MoneyMasters Podcast episode to break down why they believe the current bull market is entering a powerful new...

QQQ : 666.73 (+0.78%)
DBC : 30.87 (-0.68%)
IYT : 80.63 (+0.80%)
SLV : 66.67 (+2.82%)
TLT : 85.75 (+0.06%)
SPY : 717.10 (+0.78%)
GLD : 423.78 (+1.53%)
IWM : 277.04 (+1.82%)
VWO : 58.69 (+1.05%)
Sugar Prices Erase Early Gains as USDA Projects a Sugar Surplus in India

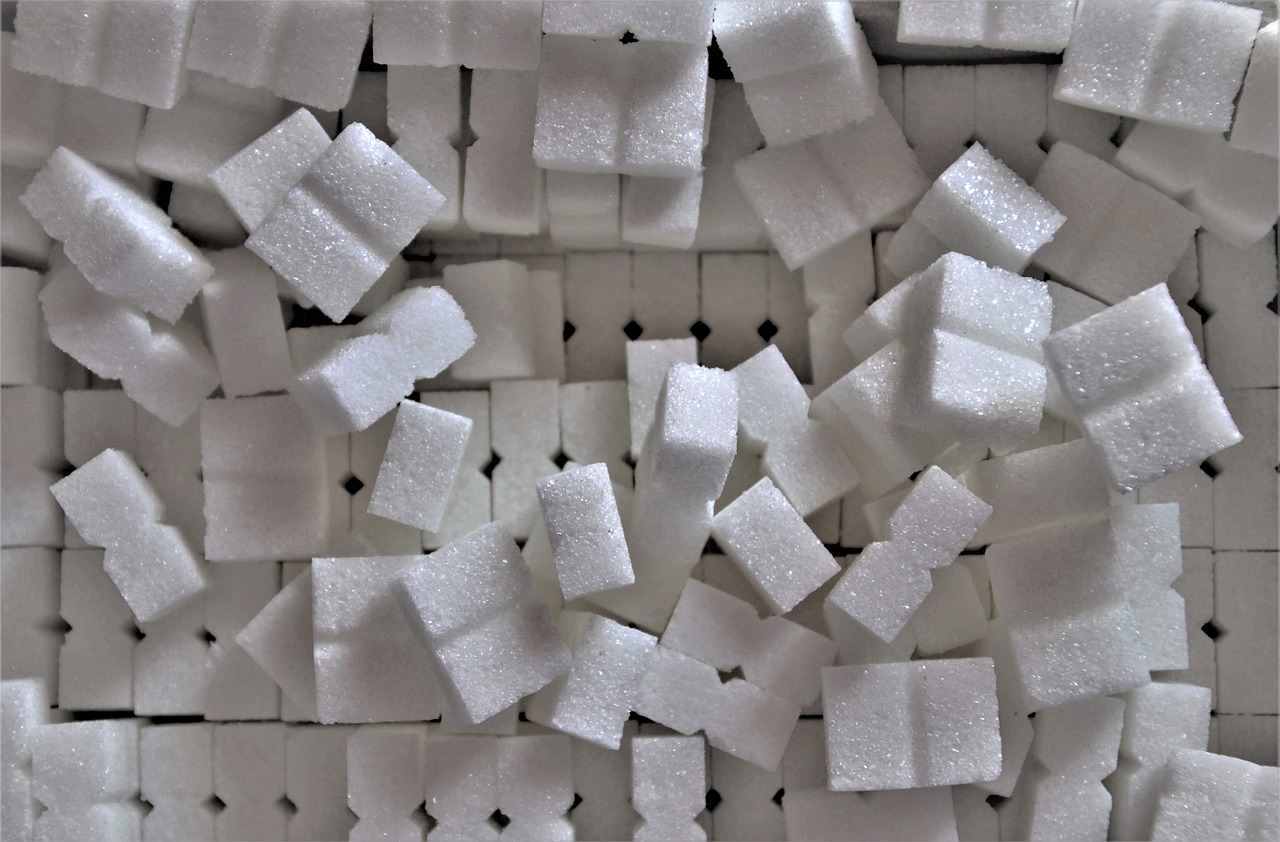
May NY world sugar #11 (SBK26 ) today is down -0.08 (-0.54%), and Aug London ICE white sugar #5 (SWQ26 ) is down -4.50 (-1.01%). Sugar prices gave up an early advance today and turned lower after the USDA...

RBM26 : 3.5768 (-0.43%)
SBN26 : 14.61s (-1.08%)
SWQ26 : 438.90s (-1.33%)
Dozens of Experts Built This Simple Stock Screener for Traders & Investors. It Was Me.

Find out the major metrics that really matter when it comes to finding quality stocks, no matter how you prefer to play the market.

GRND : 13.45 (+1.20%)
QQQ : 666.73 (+0.78%)
MSFT : 402.78 (-5.11%)
VKTX : 30.05 (-4.09%)
AVGO : 416.76 (+2.79%)
KO : 78.46 (-0.52%)
IWB : 391.82 (+0.76%)
AMD : 354.11 (+5.04%)
SPY : 717.10 (+0.78%)
MCD : 293.18 (+1.07%)

Key Turning Points

3rd Resistance Point N/A
2nd Resistance Point N/A
1st Resistance Point N/A
Last Price N/A
1st Support Level N/A
2nd Support Level N/A
3rd Support Level N/A

See More

52-Week High 0.0000
Fibonacci 61.8% N/A
Fibonacci 50% N/A
Fibonacci 38.2% N/A
52-Week Low 0.0000

See More

Want to use this as
your default charts setting?
Save this setup as a Chart Templates
Switch the Market flag
for targeted data from your country of choice.
Open the menu and switch the
Market flag for targeted data from your country of choice.
Want Streaming Chart Updates?
Switch your Site Preferences
to use Interactive Charts
Need More Chart Options?
Right-click on the chart to open the Interactive Chart menu.
Use your up/down arrows to move through the symbols.