Contract Specifications
See MoreContract
N/A
Contract Size
N/A
Tick Size
N/A
Trading Hours
N/A
Exchange
CBOT
Point Value
N/A

Barchart is a leading provider of market data and services to the global financial, media, and commodity industries. From our interactive charting library, through to our leading financial analysis desktops, we connect you to the content you need.

The wheat complex held losses across the three markets on Tuesday. CBT soft red wheat futures were down 5 to 6 cents. Preliminary open interest was down 10,535 contracts on Friday, suggesting some short...

Soybeans posted losses of 9 to 13 ½ cents across most contracts on Tuesday. There were 3 deliveries issued against September beans. The cmdtyView national average Cash Bean price was down 13 1/2 cents...

Barchart Premier provides futures traders with historical data, advanced charting, watchlists, & screeners to help make smarter decisions. Join 30M+ people worldwide who use Plus500!
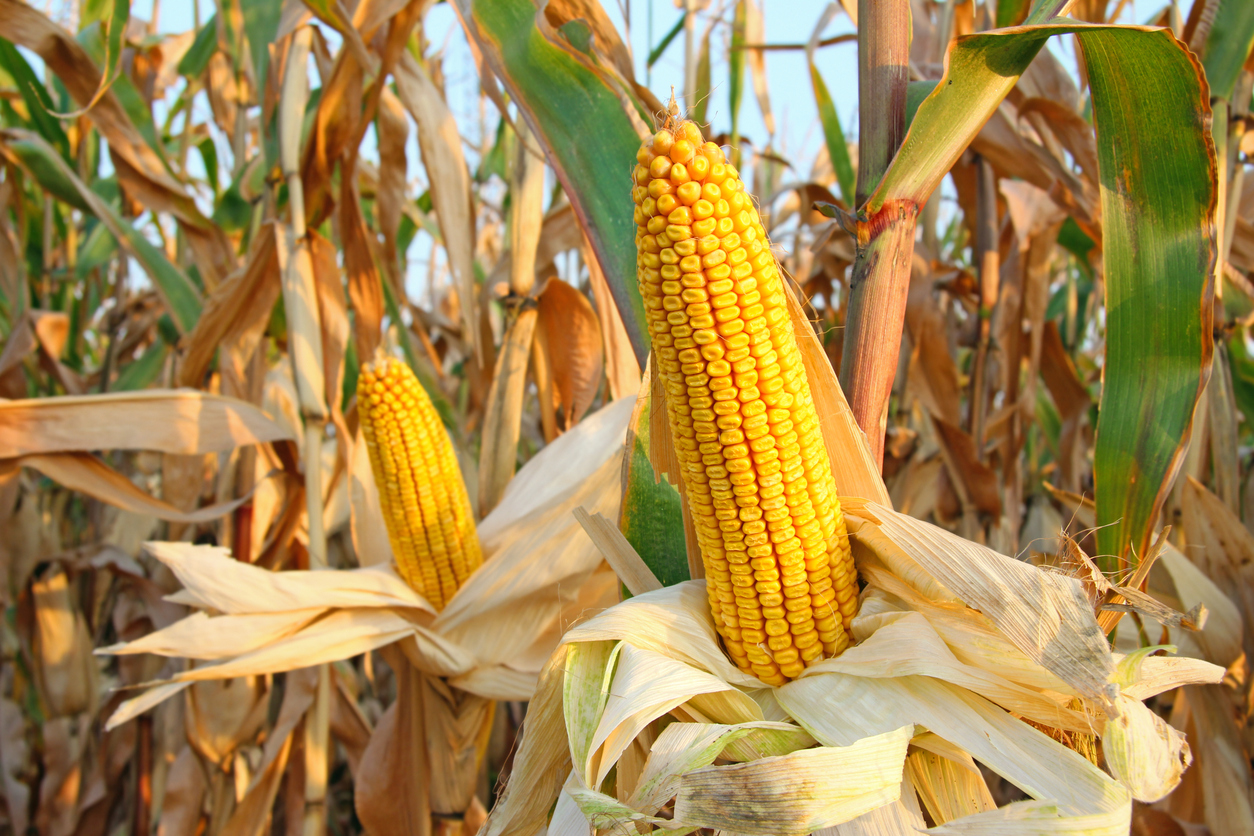
Corn futures saw some late day strength, as contracts closed with gains of 2 to 5 cents across most nearbys. Contracts closed 7 to 10 cents off the early session lows. The CmdtyView national average Cash...
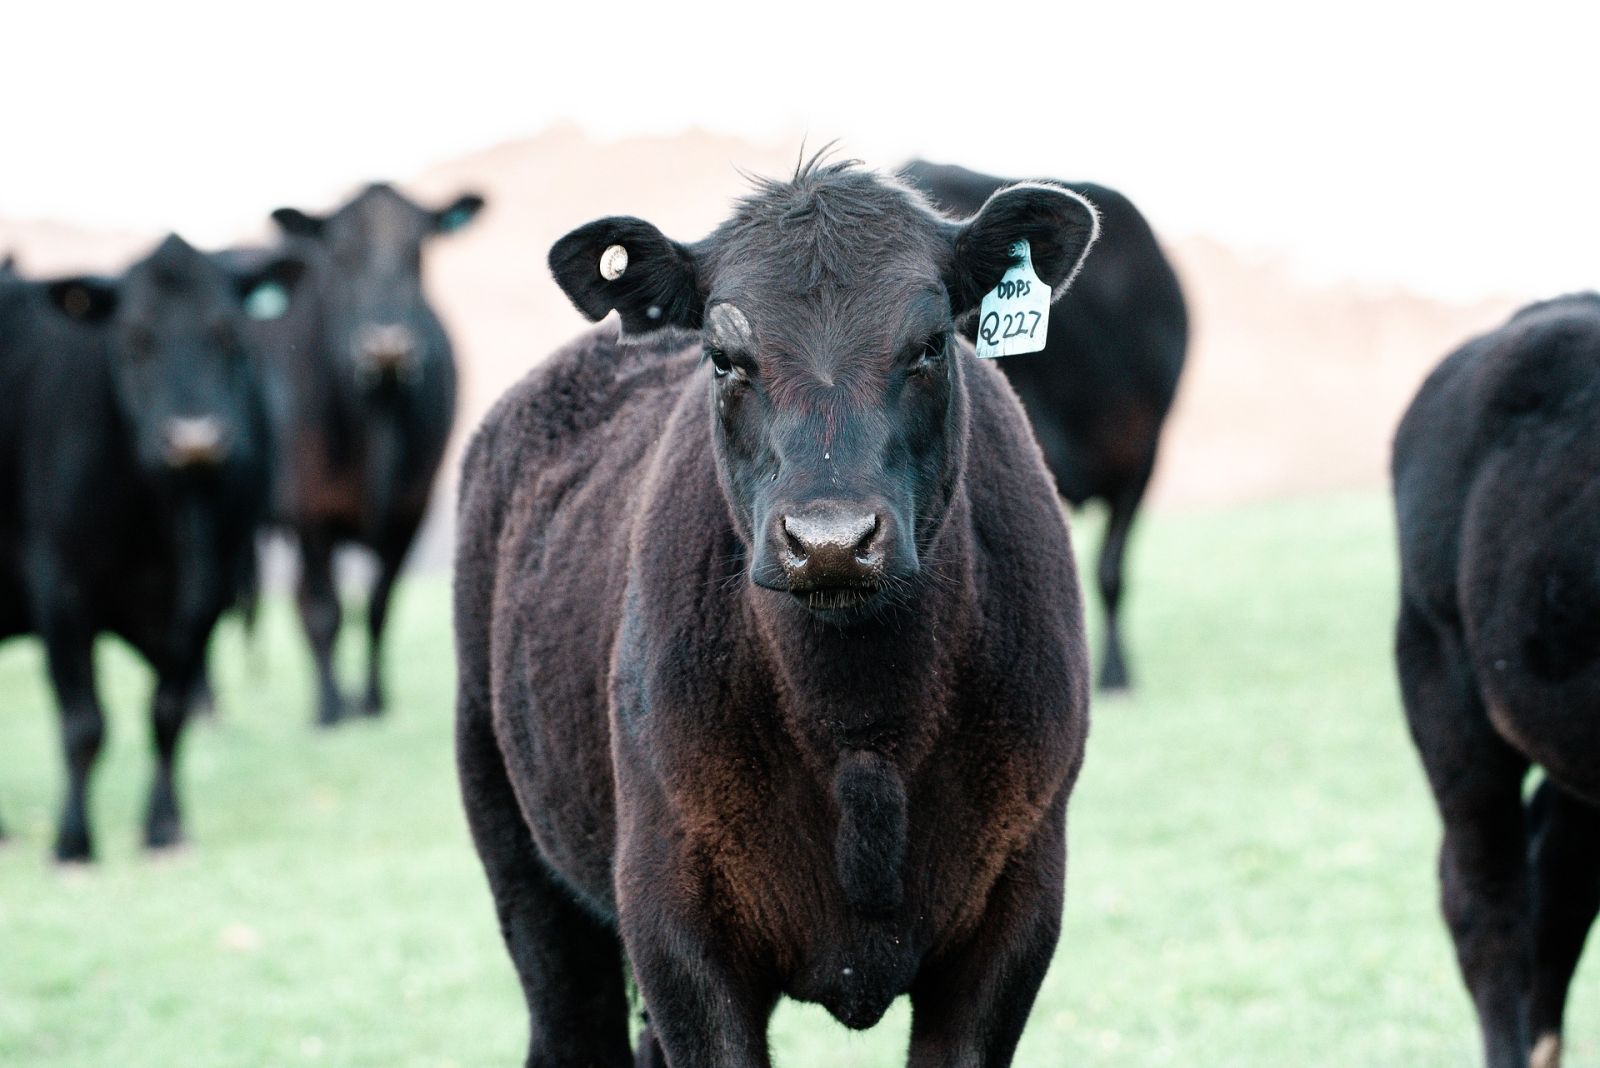
A cattle squeeze for the century. A squeeze is as simple as attempting to outbid someone else for the desired inventory in the attempt to control a larger portion of available inventory than your competitor....

There's something bullish on the Monthly, Weekly and Daily Corn charts. Has the market made it's "harvest lows" early this year?
Crop Progress - 2025-09-02
Fats and Oils - 2025-09-02

The wheat complex is falling lower across the three markets at midday. CBT soft red wheat futures are down 9 to 10 cents. Preliminary open interest was down 10,535 contracts on Friday, suggesting some...
Corn futures are trading with September up 1 ¼ cents and other contracts fractionally lower at midday. Preliminary open interest showed a rotation of ownership, up 851 contracts on Friday. The CmdtyView...

Soybeans are trading with 14 to 16 cent losses Tuesday’s midday. There were 3 deliveries issued against September beans. The cmdtyView national average Cash Bean price was up 5 3/4 cents at $9.79. Soymeal...

Wheat is down across all three exchanges with some exception to the September contracts. The wheat complex saw stronger trade on Friday across the three markets. CBT soft red wheat futures were up 5 to...

Soybeans are trading with 12 to 14 cent losses so far on Tuesday. Futures posted stronger trade at the Friday close of 5 to 8 ½ cents, as November was down 4 cents on the week. Preliminary open interest...

Here is a two-minute markets analysis and outlook for the grain and cotton futures markets. Let’s go!

The wheat complex saw stronger trade on Friday across the three markets. CBT soft red wheat futures were up 5 to 7 3/4 cents at on Friday, as December was a dime higher this week. KC HRW futures were 4...