Contract Specifications
See MoreContract
N/A
Contract Size
N/A
Tick Size
N/A
Trading Hours
N/A
Exchange
NYMEX
Point Value
$100
Expiration Date
11/30/22 (expired)

... and there's a VIDEO by Jim, if you're tired of reading stuff

Cotton futures were weaker on Wednesday, with contracts 67 to 119 points lower. Crude oil was back up $5.34 per barrel, with the US dollar index was 0.586. The Fed left rates unchanged on Wednesday’s...
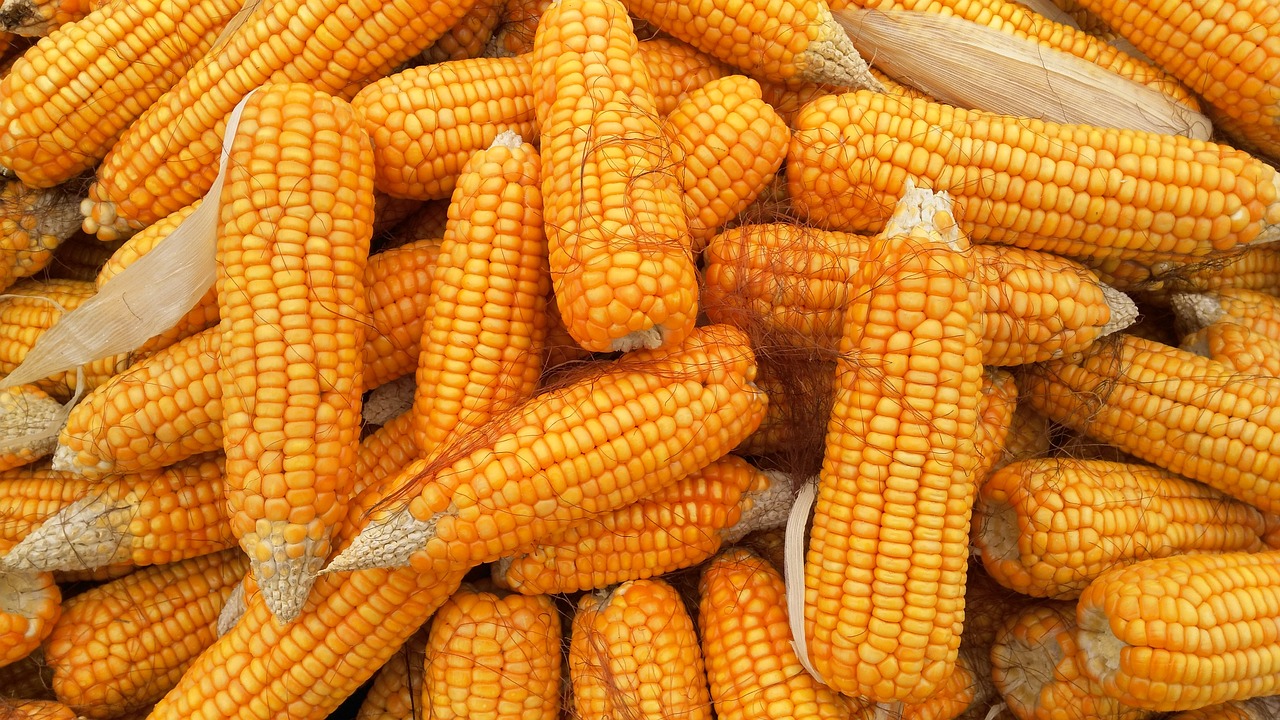
Corn futures gave back the bounce from Tuesday, with contracts closing the Wednesday session down 2 to 9 ½ cents, led by the nearbys. The CmdtyView national average Cash Corn price was down 9 1/2 cents...
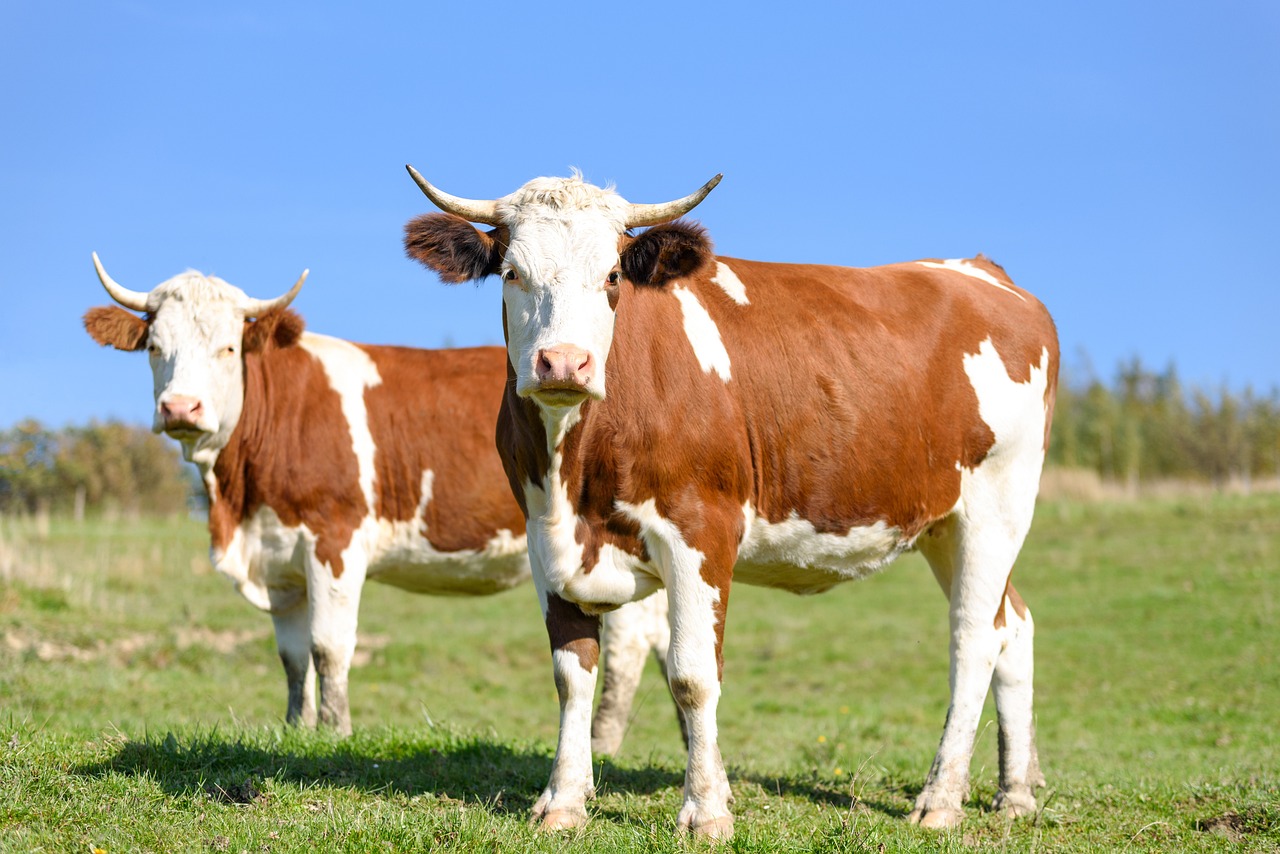
Live cattle futures closed the Wednesday session, with contracts continuing to bounce from Monday’s weakness, up 42 cents to $2.07 higher. Early bids of $228 were reported this week though trade has...

The wheat complex posted mostly lower trade on Wednesday with the spring wheat contracts holding higher. Chicago SRW contracts were lower on the midweek session with losses of 1 1/2 to 3 1/2 cents. KC...
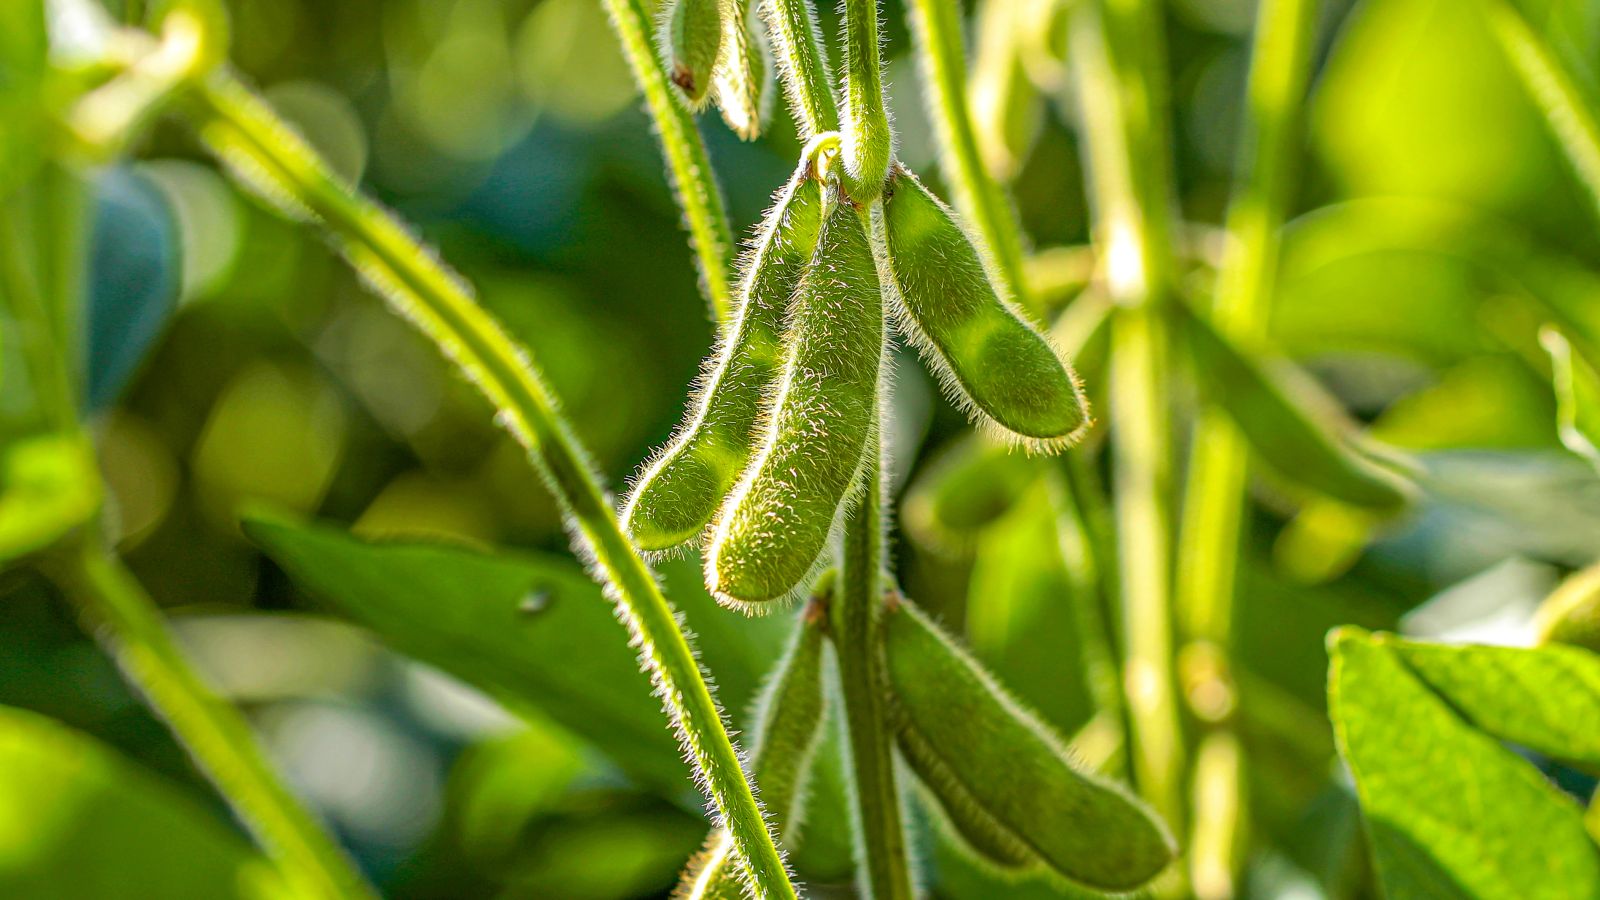
Soybeans posted losses of 13 ½ to 34 cents on Wednesday, with front months leading the charge. The cmdtyView national average Cash Bean price was 31 3/4 cents lower at $11.46 ¼. Soymeal futures were...

Lean hog futures faced weakness on Wednesday, with contracts $1.37 to $2.57 lower. USDA’s national base hog price was reported at $101.79 on Wednesday afternoon, up 79 cents from the day prior. The CME...

The outspoken Wall Street executive is bearish on long-term bonds, but there could be opportunities for proactive Treasury traders.

The S&P 500 Index ($SPX ) (SPY ) on Wednesday closed down -1.52%, the Dow Jones Industrial Average ($DOWI ) (DIA ) closed down -2.19%, and the Nasdaq 100 Index ($IUXX ) (QQQ ) closed down -2.06%. September...