
Wheat Mini Jul '19 (XWN19)
[[ item.lastPrice ]] [[ item.priceChange ]] ([[ item.percentChange ]]) [[ item.tradeTime ]] [CBOT]
[[ item.bidPrice ]] x [[ item.bidSize ]] [[ item.askPrice ]] x [[ item.askSize ]]
for [[ item.sessionDateDisplayLong ]]
Find the latest Wheat Mini prices and Wheat Mini futures quotes for all active contracts below.
[[ timeframe ]] futures price quotes as of Sun, Apr 12th, 2026.
Latest price quotes as of [[ snapshotDate ]].
[[ timeframe ]] futures price quotes, based on [[ timeframe ]] data.
Looking for expired contracts? Check out our Wheat Mini Historical Prices page.

Grains pressured while beans and cattle break higher
Higher fuel costs threaten consumer demand
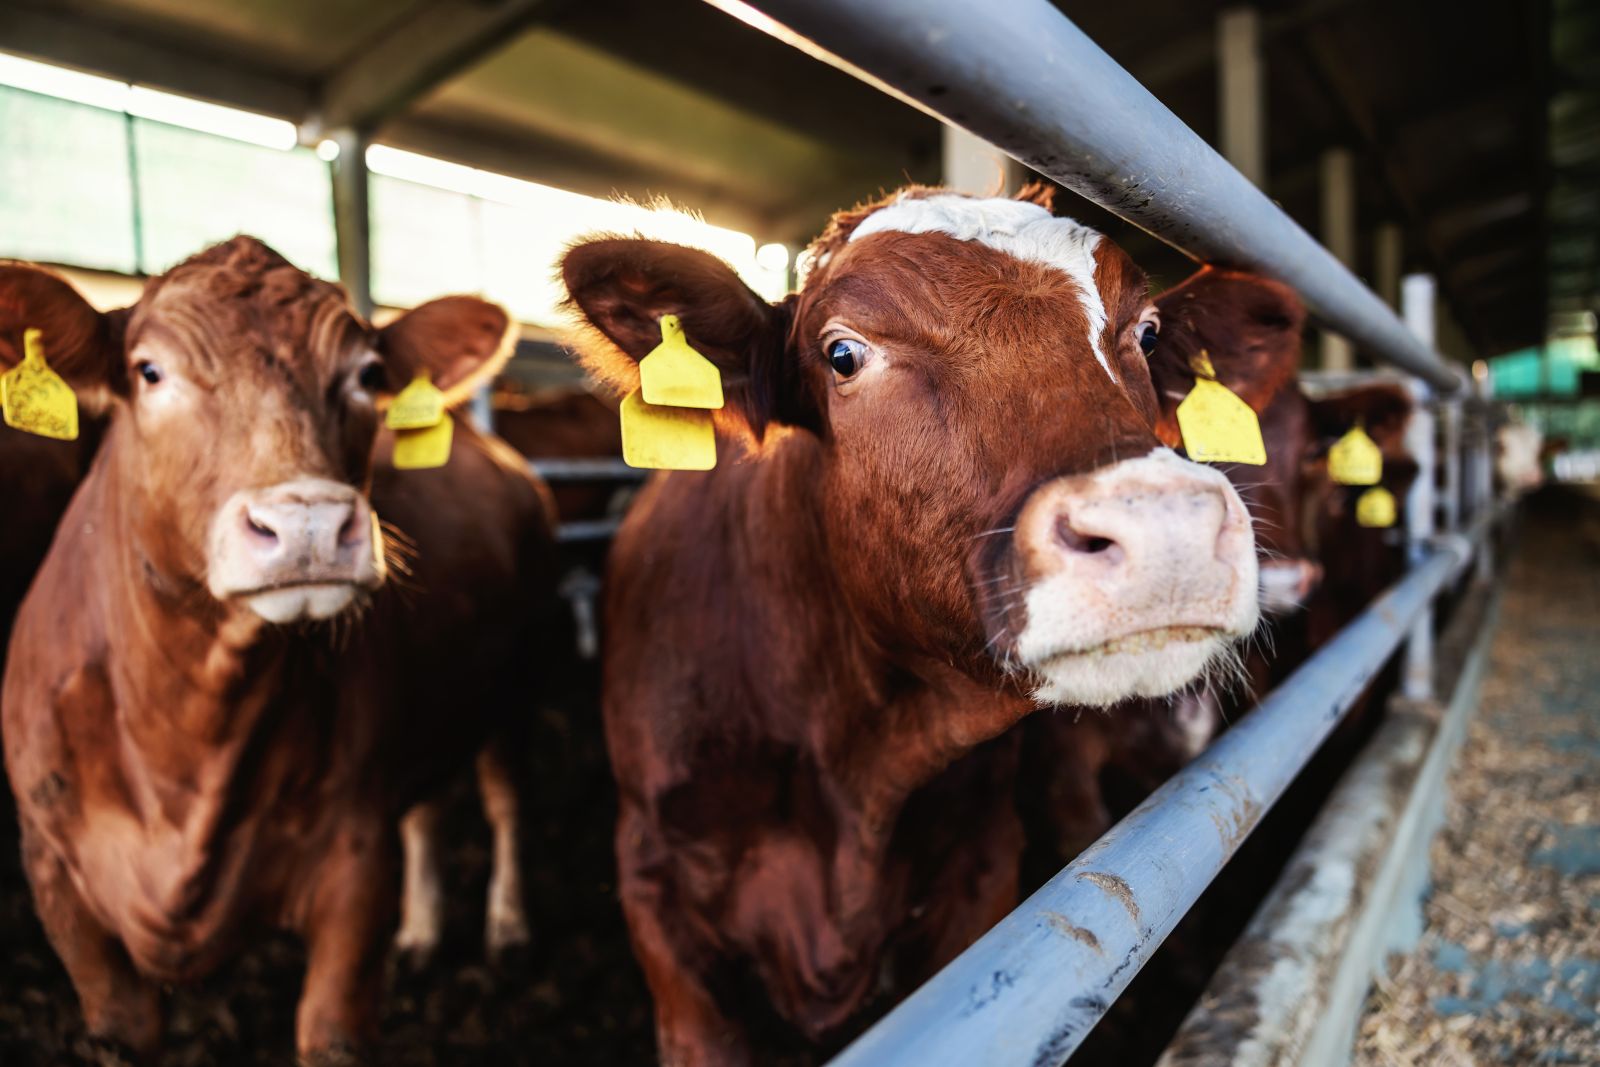
Live Cattle Futures Makes New All-time high
Cattle markets end week strong

Soybeans Analysis & Targets
Educational and Actionable information using Fibonacci and W.D. Gann analysis.

Wheat Closes with Friday Losses
The wheat complex is showing mixed trade on Friday. Chicago SRW futures were down 3 ½ to 6 cents higher on the Friday session, with May 27 ¼ cents lower...

Soybeans Rally into the Weekend, Led by Meal
Soybeans closed the Friday session with contracts 5 to 10 ½ cents higher, as meal took control. May was up 12 ¼ cents on the week, with November up 3...
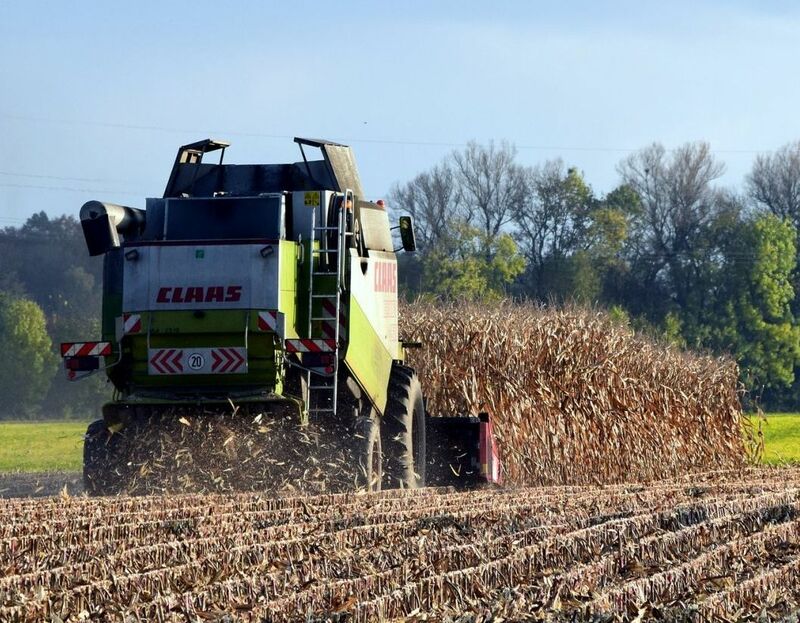
Corn Pulls Off Early Lows, but Still Faces Friday Losses
Corn futures closed out the Friday session with contracts down 1 ¼ to 3 ¾ cents at the close. May settled Friday, with the weekly loss at 11 ¼ cents,...
/Palantir%20by%20Hiroshi-Mori-Stock%20via%20Shutterstock.jpg)
Palantir Stock Is at 6-Month Lows - Time to Buy PLTR?
Palantir stock has dropped to a new 6-month low, which could mean it's time to buy for patient investors. One way to do this, if PLTR keeps dropping, is...

JPMorgan Is Betting on the ‘American Dream’ with a New $1.5 Trillion Initiative. What Does That Really Mean?
The largest U.S. bank aims for community lending, branch expansion, and critical‑industry financing into a long runway of steady, earnings‑backed growth...
/Micron%20Technology%20Inc_logo%20and%20website-by%20Mojahid%20Mottakin%20via%20Shutterstock.jpg)
Micron Is Investing in SiMa.ai. What Does That Mean for MU Stock?
As Micron leans deeper into Physical AI with its SiMa.ai investment, is MU stock gearing up for its next big leg of growth?

CrowdStrike Is Joining Anthropic’s New Project Glasswing. Does That Make CRWD Stock a Buy?
CrowdStrike was chosen as a partner for Anthropic’s Project Glasswing, a limited rollout of Mythos. Should you buy the stock here?
/International%20Business%20Machines%20Corp_%20logo%20on%20phone-by%20rafapress%20via%20Shutterstock.jpg)
Why Needham Analysts Slashed Their Price Targets on IBM Stock Ahead of Earnings
IBM is seeing tempered targets from Needham as macro pressures linger, though growth and margins remain steady.

3 Top Stocks to Buy to Invest in Anthropic’s Project Glasswing
Anthropic’s Project Glasswing is bringing AI into cybersecurity in a big way. With tech leaders like Microsoft, Broadcom, and Nvidia, among others, involved,...

CoStar Group Earnings Preview: What to Expect
CoStar Group will release its first-quarter earnings this month, and analysts anticipate a double-digit profit boom.

Sherwin-Williams’ Q1 2026 Earnings: What to Expect
Sherwin-Williams is scheduled to report its first-quarter results later this month, and analysts expect a modest single-digit increase in earnings.