Contract Specifications
See MoreContract
N/A
Contract Size
N/A
Tick Size
N/A
Trading Hours
N/A
Exchange
CME
Point Value
N/A
The S&P 500 Index ($SPX ) (SPY ) on Thursday closed down -0.51%, the Dow Jones Industrial Average ($DOWI ) (DIA ) closed down -0.20%, and the Nasdaq 100 Index ($IUXX ) (QQQ ) closed down -1.62%. September...
The S&P 500 Index ($SPX ) (SPY ) today is down -0.14%, the Dow Jones Industrial Average ($DOWI ) (DIA ) is up +0.21%, and the Nasdaq 100 Index ($IUXX ) (QQQ ) is down -0.96%. September E-mini S&P futures...

The S&P 500 Index ($SPX ) (SPY ) today is down -0.46%, the Dow Jones Industrial Average ($DOWI ) (DIA ) is down -0.04%, and the Nasdaq 100 Index ($IUXX ) (QQQ ) is down -1.28%. September E-mini S&P futures...

September S&P 500 E-Mini futures (ESU26) are down -0.17%, and September Nasdaq 100 E-Mini futures (NQU26) are down -0.59% this morning as chipmakers remained under pressure, with investors weighing whether...

The S&P 500 Index ($SPX ) (SPY ) on Wednesday closed up +0.38%, the Dow Jones Industrial Average ($DOWI ) (DIA ) closed up +0.29%, and the Nasdaq 100 Index ($IUXX ) (QQQ ) closed down -0.28%. September...

The S&P 500 Index ($SPX ) (SPY ) today is up +0.15%, the Dow Jones Industrial Average ($DOWI ) (DIA ) is up +0.35%, and the Nasdaq 100 Index ($IUXX ) (QQQ ) is down -0.64%. September E-mini S&P futures...

September British pound futures present a buying opportunity on more price strength.

Chamath Palihapitiya warns unchecked AI “tokenmaxxing” could quietly inflate corporate costs and weigh on earnings as executives struggle to track whether growing AI spending is paying off.

The S&P 500 Index ($SPX ) (SPY ) today is up +0.23%, the Dow Jones Industrial Average ($DOWI ) (DIA ) is up +0.26%, and the Nasdaq 100 Index ($IUXX ) (QQQ ) is up +0.31%. September E-mini S&P futures...
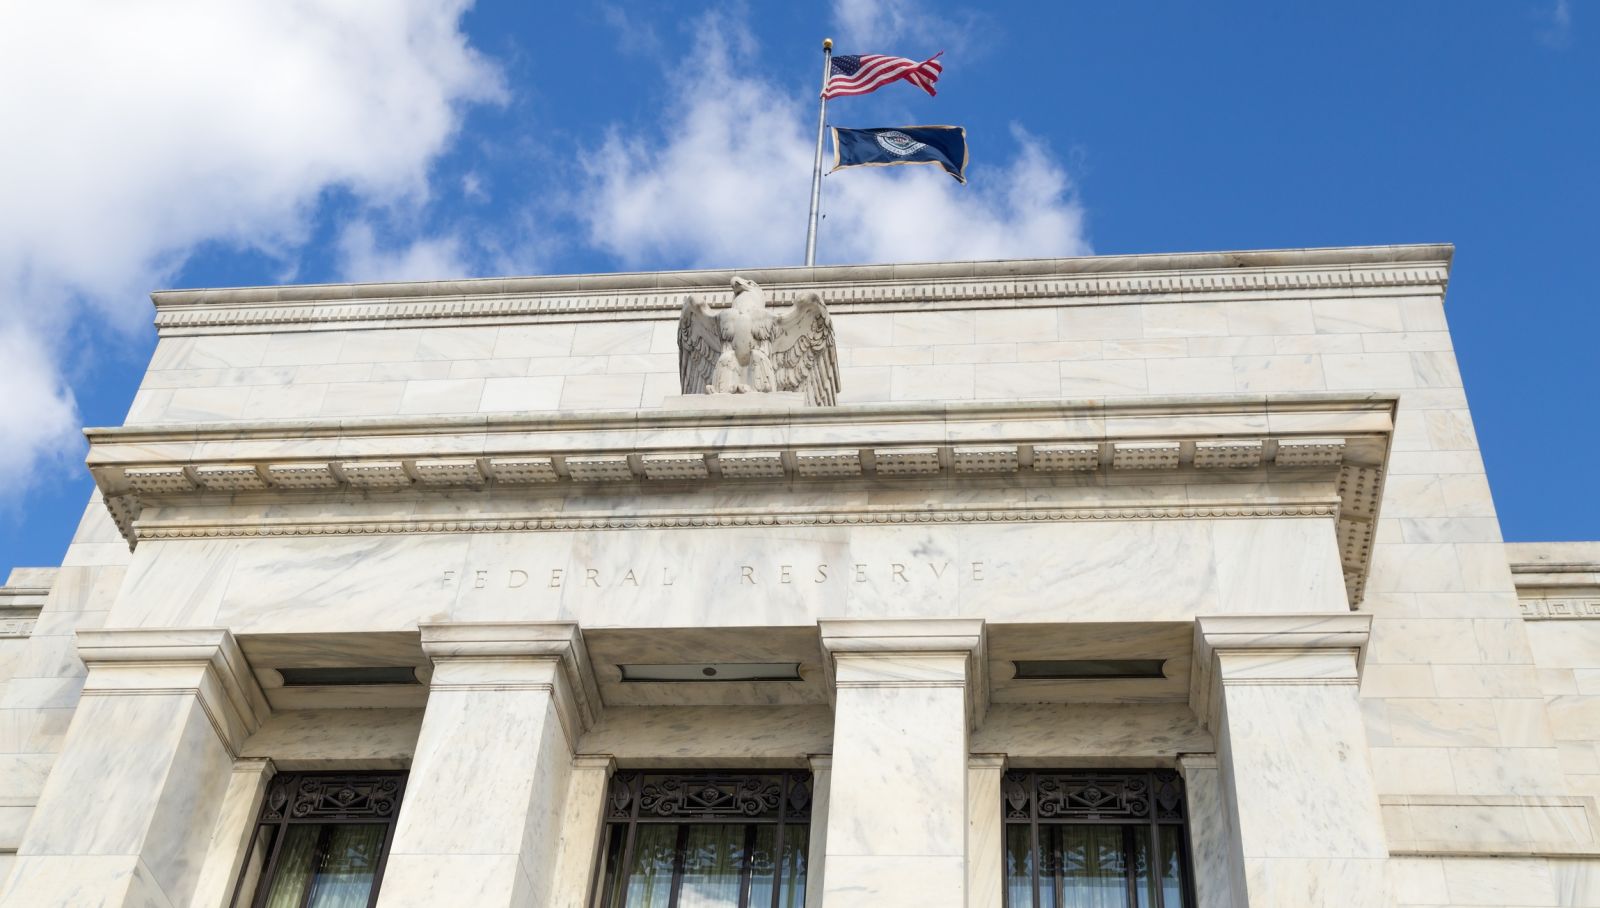
If you’re worried about the Federal Reserve, you got a mix of good news and bad news yesterday.

