or
Faster, Cleaner, Better.

Lumber Physical Mar '24 (LBH24)

560.00s +5.00 (+0.90%) 03/15/24 [CME]
N/A x N/A N/A x N/A
underlying price ()
Quote Overview for Fri, Mar 15th, 2024
Day Low
559.00
Day High
569.50
Open 569.50
Previous Close 555.00 555.00
Volume 5 5
Open Interest 180 180
Stochastic %K 27.13% 27.13%
Weighted Alpha -1.70 -1.70
5-Day Change -16.50 (-2.86%) -16.50 (-2.86%)
52-Week Range 499.00 - 606.00 499.00 - 606.00
  • 1D
  • 5D
  • 1M
  • 3M
  • 6M
  • 1Y
  • 5Y
  • MAX
Full Chart
  • OHLC Bars
  • Colored OHLC Bars
  • HLC Bars
  • Candlestick Hollow
  • Candlestick Open-to-Close
  • Candlestick Close-to-Close
  • Heikin-Ashi
  • Line Chart
  • Area Chart
  • Renko
  • Column
  • Baseline
  • Line Break
  • Range
  • Kagi
  • Point And Figure

Contract Specifications

See More
Contract
Physically-Delivered Lumber
Contract Size
27,500 board foot
Tick Size
50 cents per thousand board feet ($13.75 per contract)
Trading Hours
9:00a.m. - 3:05p.m. CST
Exchange
CME
Point Value
$27.50
Margin/Maintenance
$1,210/1,100
First Notice Date
03/25/24
Expiration Date
03/15/24 (expired)

Seasonal Chart

Lumber Physical Mar '24
Average Price Chart for 5 Prior Mar Contracts

Commitment of Traders Positions as of Jun 3, 2025

View Chart Details
Commercials - Long / Short
5,010 (+105)
3,131 (+313)
Non-Commercials - Long / Short
2,236 (+161)
4,295 (+106)
Producers - Long / Short
4,661 (+106)
3,040 (+313)
Swap Dealers - Long / Short
349 (-1)
91 (unch)
Managed Money - Long / Short
260 (-46)
3,882 (+234)
Other Reportables - Long / Short
1,976 (+207)
413 (-128)
Get Realtime - Quotes and Charts for Futures Traders. Learn More >>

Price Performance

See More
Period Period Low Period High Performance
1-Month
552.50 +1.36%
on 02/21/24
Period Open: 555.50
591.00 -5.25%
on 03/01/24
+4.50 (+0.81%)
since 02/15/24
3-Month
542.50 +3.23%
on 01/18/24
Period Open: 560.00
593.50 -5.64%
on 12/22/23
unch (unch)
since 12/15/23
52-Week
499.00 +12.22%
on 10/25/23
Period Open: 560.00
606.00 -7.59%
on 07/17/23
unch (unch)
since 03/15/23

More Lumber Physical Quotes

All Futures Prices
Please wait...
Please wait...
false

Most Recent Stories

More News
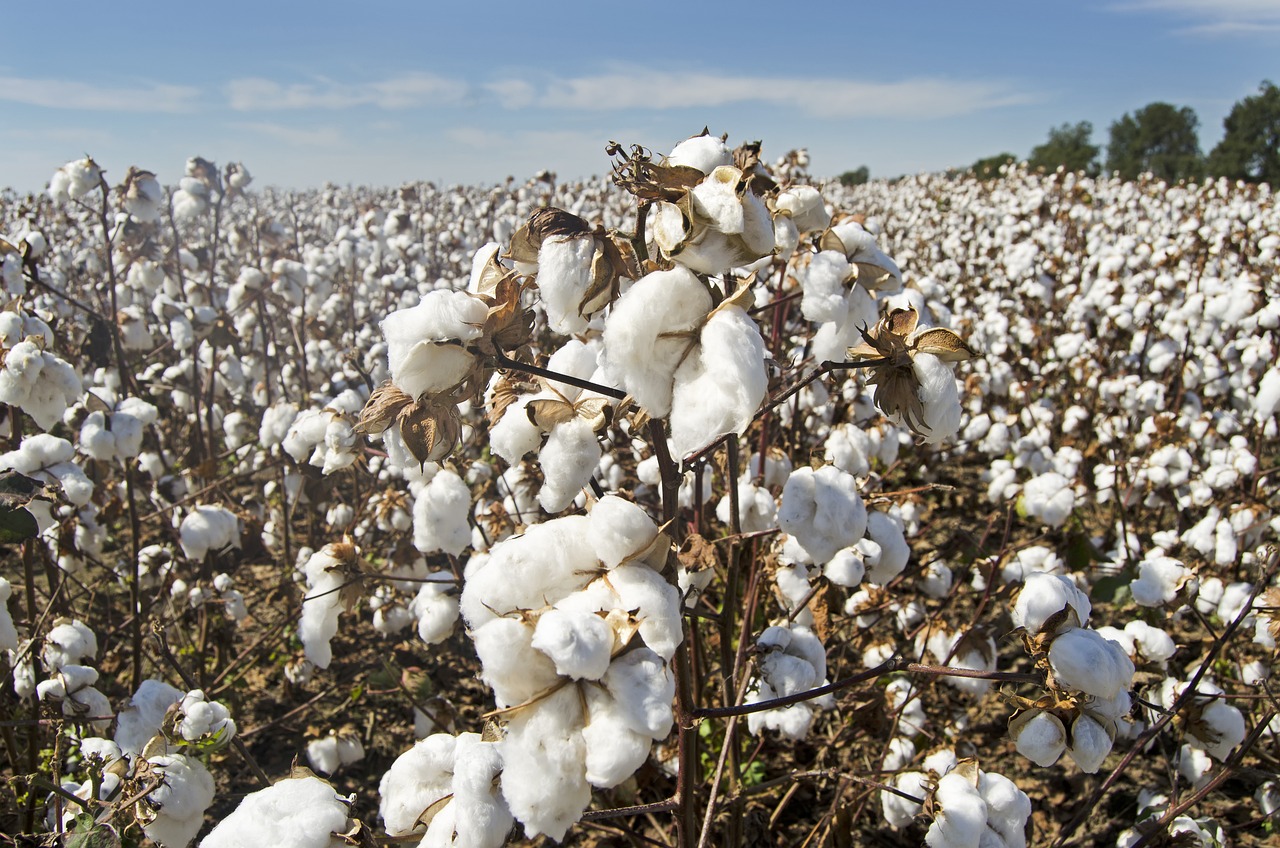
Cotton Closes Mixed on Wednesday

Cotton futures posted marginally mixed trade on Wednesday, with contracts within 10 points of unchanged. Crude oil prices are up $3.32/barrel, with the US dollar index back down $0.455 to $98.615. The...

CTV25 : 65.28 (-0.67%)
CTN25 : 65.36 (-0.17%)
CTZ24 : 71.40s (-1.37%)
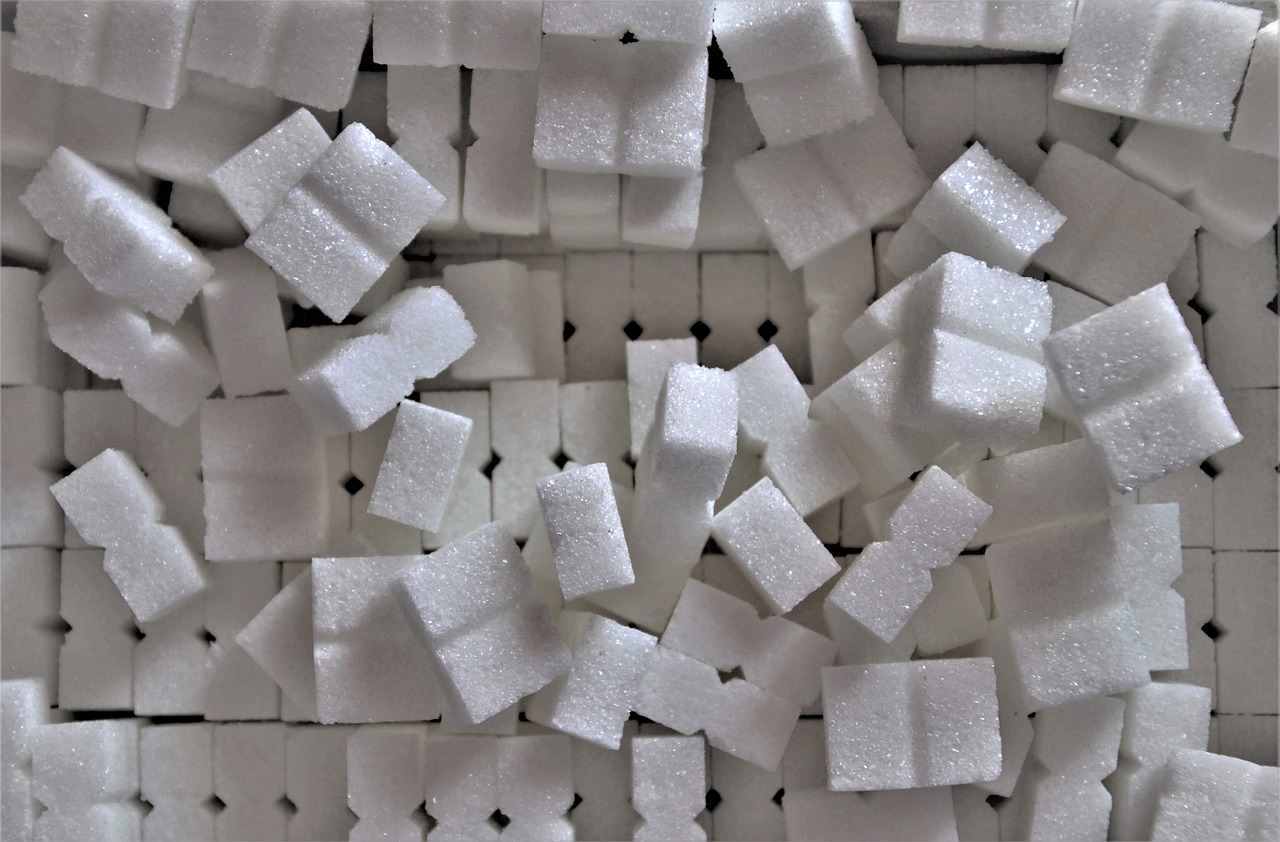
Expectations for a Global Surplus Pressure Sugar Prices

July NY world sugar #11 (SBN25 ) Wednesday closed down -0.06 (-0.36%), and August London ICE white sugar #5 (SWQ25 ) closed up +5.00 (+1.07%). Sugar prices on Wednesday settled mixed. Sugar prices have...

SBV25 : 16.81s (-0.24%)
SWQ25 : 472.80s (+1.07%)
Plus500 Makes Futures Trading Truly Accessible: Low Margins and Up to $200 in a Commission-Free Bonus!

Trade the most popular US futures of 2025: Agricultural Commodities, Indices, Crypto, Metals, Forex, and more! Join over 30 million people worldwide who trust Plus500. Start trading today with a deposit as low as $100!

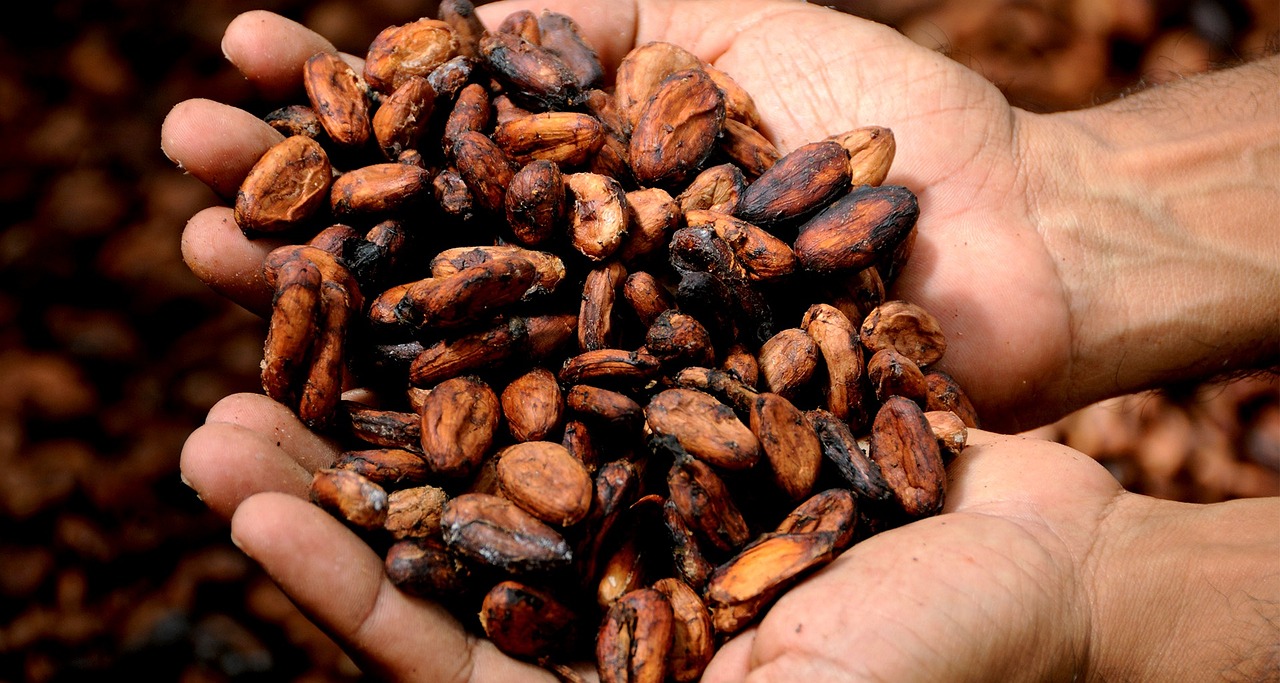
West African Rain Weighs on Cocoa Prices

July ICE NY cocoa (CCN25 ) Wednesday closed down -53 (-0.55%), and July ICE London cocoa #7 (CAN25 ) closed down -78 (-1.18%). Cocoa prices on Wednesday extended this week's side, with NY cocoa falling...

CCU25 : 9,069s (+0.43%)
CAU25 : 6,349s (-0.86%)
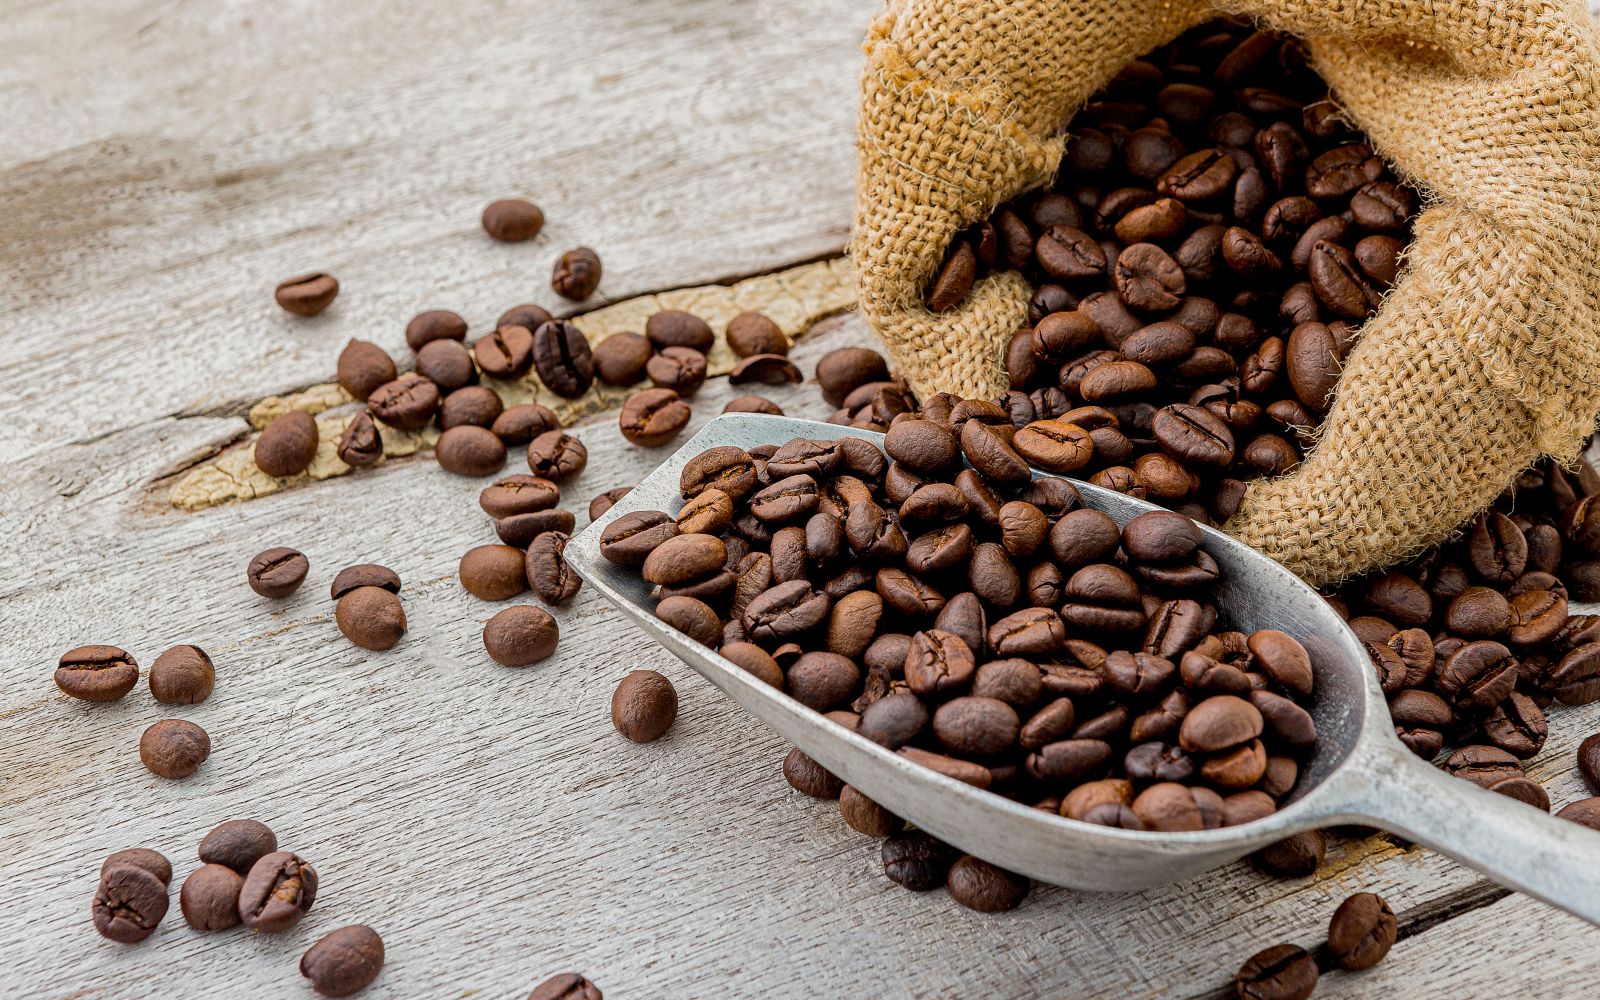
Coffee Prices Pressured by Brazil's Coffee Harvest

July arabica coffee (KCN25 ) Wednesday closed down -4.40 (-1.24%), and July ICE robusta coffee (RMN25 ) closed down -17 (-0.39%). Coffee prices on Wednesday gave up an early advance and moved lower, with...

RMU25 : 4,291s (-0.60%)
KCU25 : 348.60s (-1.26%)
Cotton Climbing Higher at Midday

Cotton futures are trading with gains of 10 to 20 points across most contracts on Wednesday, with October thin and down 17 points. Crude oil prices are up $1.61/barrel, with the US dollar index back down...

CTV25 : 65.28 (-0.67%)
CTN25 : 65.36 (-0.17%)
CTZ24 : 71.40s (-1.37%)
Sugar Prices Recover on Strength in Crude Oil and the Brazilian Real

July NY world sugar #11 (SBN25 ) today is up +0.02 (+0.12%), and August London ICE white sugar #5 (SWQ25 ) is up +6.20 (+1.33%). Sugar prices today recovered from early losses and moved higher as strength...

CLN25 : 67.83 (-0.47%)
SBV25 : 16.81s (-0.24%)
^USDBRL : 5.53660 (unch)
SWQ25 : 472.80s (+1.07%)
Cocoa Prices Undercut by Rain in West Africa

July ICE NY cocoa (CCN25 ) today is down -23 (-0.24%), and July ICE London cocoa #7 (CAN25 ) is down -79 (-1.20%). Cocoa prices today extended this week's side, with NY cocoa falling to a 1-1/2 week low....

CCU25 : 9,069s (+0.43%)
CAU25 : 6,349s (-0.86%)
Brazilian Real Strength Boosts Coffee Prices

July arabica coffee (KCN25 ) today is up +0.35 (+0.10%), and July ICE robusta coffee (RMN25 ) is up +3 (+0.07%). Coffee prices today are slightly higher as strength in the Brazilian real has prompted some...

RMU25 : 4,291s (-0.60%)
KCU25 : 348.60s (-1.26%)
Cotton Losses Leaking to Wednesday Morning

Cotton prices are down 4 to 9 cents across most contracts. Futures posted Tuesday losses of 50 to 70 points across most contracts, with October slipping 120 points. Crude oil prices were down $0.59/barrel,...

CTV25 : 65.28 (-0.67%)
CTN25 : 65.36 (-0.17%)
CTZ24 : 71.40s (-1.37%)
Is American Electric Power Stock Underperforming the S&P 500?

Despite American Electric Power’s recent underperformance relative to the S&P 500, analysts remain moderately optimistic about the stock’s prospects.

$SPX : 6,022.24 (-0.27%)
DUK : 116.35 (+0.02%)
AEP : 101.94 (+0.07%)
How Is Kinder Morgan's Stock Performance Compared to Other Energy Stocks?

Kinder Morgan has outperformed the Energy industry over the past year, and analysts are moderately optimistic about the stock’s prospects.

XLE : 86.29 (+1.45%)
KMI : 27.52 (+0.51%)
WMB : 59.42 (+0.78%)
Nat-gas Prices Fall on Ample Storage and Cooler US Temps

July Nymex natural gas (NGN25 ) on Monday closed down by -0.149 (-3.94%). July nat-gas prices on Monday tumbled to a 1-week low and settled sharply lower. Nat-gas prices sold off Monday due to abundant...

NGN25 : 3.553 (+1.31%)
Crude Prices Climb on Hopes of Easing of US-China Trade Tensions

July WTI crude oil (CLN25 ) Monday closed up +0.71 (+1.10%), and July RBOB gasoline (RBN25 ) closed up +0.0184 (+0.89%). Crude oil and gasoline prices settled higher Monday, with crude reaching a 2-1/4...

CLN25 : 67.80 (-0.51%)
RBQ25 : 2.1376 (-0.56%)
Soaring Platinum’s Loud Signal

Platinum is soaring and palladium jumped higher, too. Both serve as important signals, especially the former.

Crude Prices Edge Higher on Optimism About US-China Trade Talks

July WTI crude oil (CLN25 ) today is up +0.50 (+0.77%), and July RBOB gasoline (RBN25 ) is up +0.0177 (+0.85%). Crude oil and gasoline prices are moving higher today, with crude reaching a 2-1/4 month...

CLN25 : 67.80 (-0.51%)
RBQ25 : 2.1376 (-0.56%)
WTI Holds Gains as US-China Meeting Takes Center Stage

WTI Crude Oil Futures (July Future) **Bias shift to Neutral / Bullish Friday’s Settlement: 64.58, up +1.21 [+6.23%] for the week, +1.21 [+1.90%] for the day The announcement of a US – China trade...

NextEra Energy Stock: Is NEE Underperforming the Utilities Sector?

NextEra Energy has underperformed the Utilities sector over the past year, but analysts are moderately optimistic about the stock’s prospects.

XLU : 80.91 (+0.06%)
DTE : 134.97 (+0.07%)
NEE : 73.00 (+0.26%)
Crude Prices Rise on Energy Demand Optimism

July WTI crude oil (CLN25 ) Friday closed up +1.21 (+1.91%), and July RBOB gasoline (RBN25 ) closed up +0.0139 (+0.67%). Crude oil and gasoline prices on Friday settled higher, with crude climbing to a...

CLN25 : 67.80 (-0.51%)
RBQ25 : 2.1376 (-0.56%)
Nat-Gas Prices Climb as US Weather Forecasts Turn Hotter

July Nymex natural gas (NGN25 ) on Friday closed up by +0.107 (+2.91%). July nat-gas prices on Friday rallied to a 1-week high and settled sharply higher as US weather forecasts turned hotter, potentially...

NGN25 : 3.553 (+1.31%)

Barchart Trading Guide

The Barchart Trading Guide is a Buy Signal with a Weak Signal Strength.

Key Turning Points

3rd Resistance Point 577.17
2nd Resistance Point 573.33
1st Resistance Point 566.67
Last Price 560.00s
1st Support Level 556.17
2nd Support Level 552.33
3rd Support Level 545.67

See More

52-Week High 606.00
Fibonacci 61.8% 565.13
Last Price 560.00s
Fibonacci 50% 552.50
Fibonacci 38.2% 539.87
52-Week Low 499.00

See More

Solutions for Ag Professionals barchart.com/cmdty
Data and Statistics for Coffee and Cotton
Explore Data
cmdtyView Pro for Ag Professionals
Start Free Trial
We help Commodity Professionals make better decisions
Learn Now
Want to use this as
your default charts setting?
Save this setup as a Chart Templates
Switch the Market flag
for targeted data from your country of choice.
Open the menu and switch the
Market flag for targeted data from your country of choice.
Want Streaming Chart Updates?
Switch your Site Preferences
to use Interactive Charts
Need More Chart Options?
Right-click on the chart to open the Interactive Chart menu.
Use your up/down arrows to move through the symbols.
Free Barchart Webinar