
Just like there’s an app for everything, there’s an ETF for every market need. And that’s very good news for investors who, like me, see big technology stocks as three things right now:
- Iconic, and deservedly so
- Highly appreciated as a group, though some more than others
- Very vulnerable to a correction, or worse
My old adage is that “any stock can go up in value at any time, for any reason. The difference between one stock and another, or one ETF and another, is the degree to which big-loss potential exists.” “Big” here is defined by the investor. But as I’m a risk manager first, if I venture out to buy a stock, I look at a 10% loss from cost as a reason to say to myself, “I missed something here.”
Even if the whole market is falling hard, that still means I could have held off on buying anything. So that 10% is more of a guideline to force myself to have the conviction that if I buy a stock at, say $100 a share, it won’t see $90 before it sees $110. In fact, my Risk Opportunity and Reward (ROAR) Score, which I’ve written about here, is conceptually based on that very concept.
That brings us to today’s market, and the plight of big tech stocks. We can’t get ahead of ourselves, since it is only a week’s time. But when we compare a few of the many ETFs that track the technology sector, I can’t help but notice that popular tech proxies such as the S&P 500 Tech Sector SPDR (XLK) and the Nasdaq QQQ Invesco ETF (QQQ) are slipping.
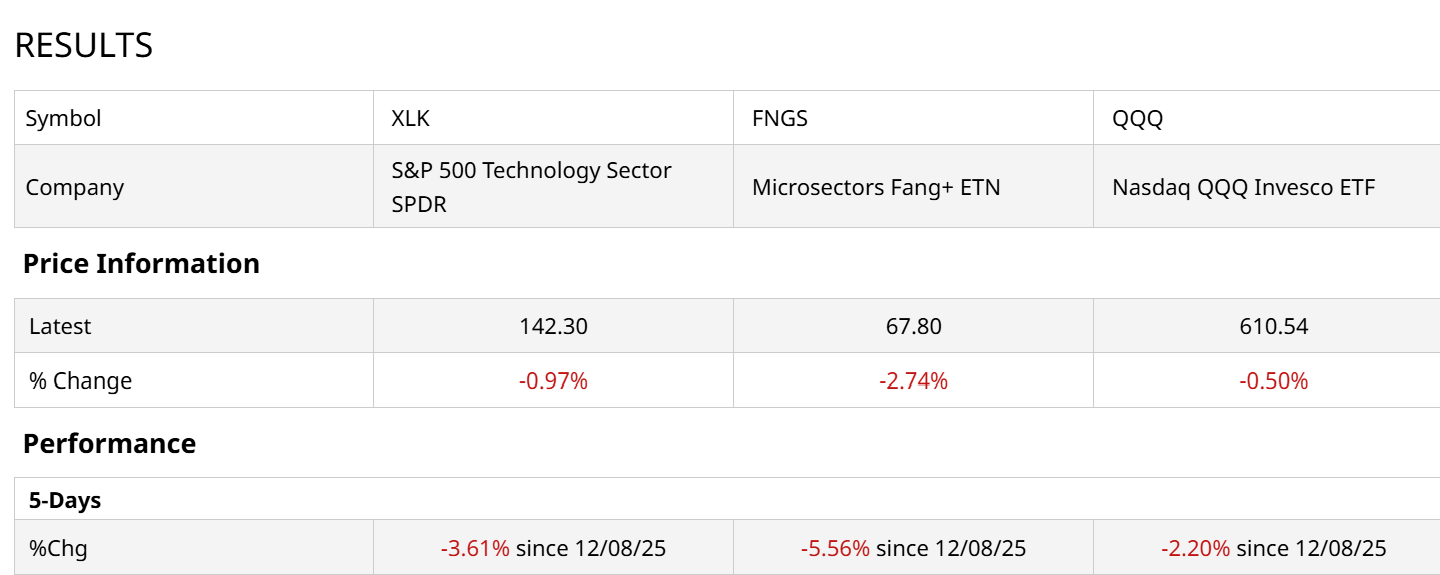
For ETFs that focus more on the very largest stocks known as “FANG” (now more commonly referred to as the “Magnificent 7”), the pain is even worse.
This ETF Holds Just 10 Very Large Stocks
The Microsectors Fang+ ETN (FNGS) holds just 10 very large stocks: Google (GOOGL), Broadcom (AVGO), Apple (AAPL), CrowdStrike (CRWD), Nvidia (NVDA), Amazon (AMZN), Microsoft (MSFT), ServiceNow (NOW), Meta Platforms (META), and Netflix (NFLX). You can see six of the Mag 7 in there (Tesla (TSLA) excluded), along with four other stocks that have essentially created a set of 10 market darlings.
Check out this chart of the past 3 years. From under $20 to nearly $75 a share at its recent peak. And now, its first 10% correction from that all-time high level. And a chart that indicates a strong possibility of more to come. Again, it’s early, and the dip-buying habit won’t likely end without a fight.

And when we zero in on a daily chart to get more definition in the visual pattern, I spot a 20-day moving average potentially rolling over, and a Percentage Price Oscillator (PPO) indicator at bottom to match. It will take more than a quick pullback like this one to shake out the long-term bulls.
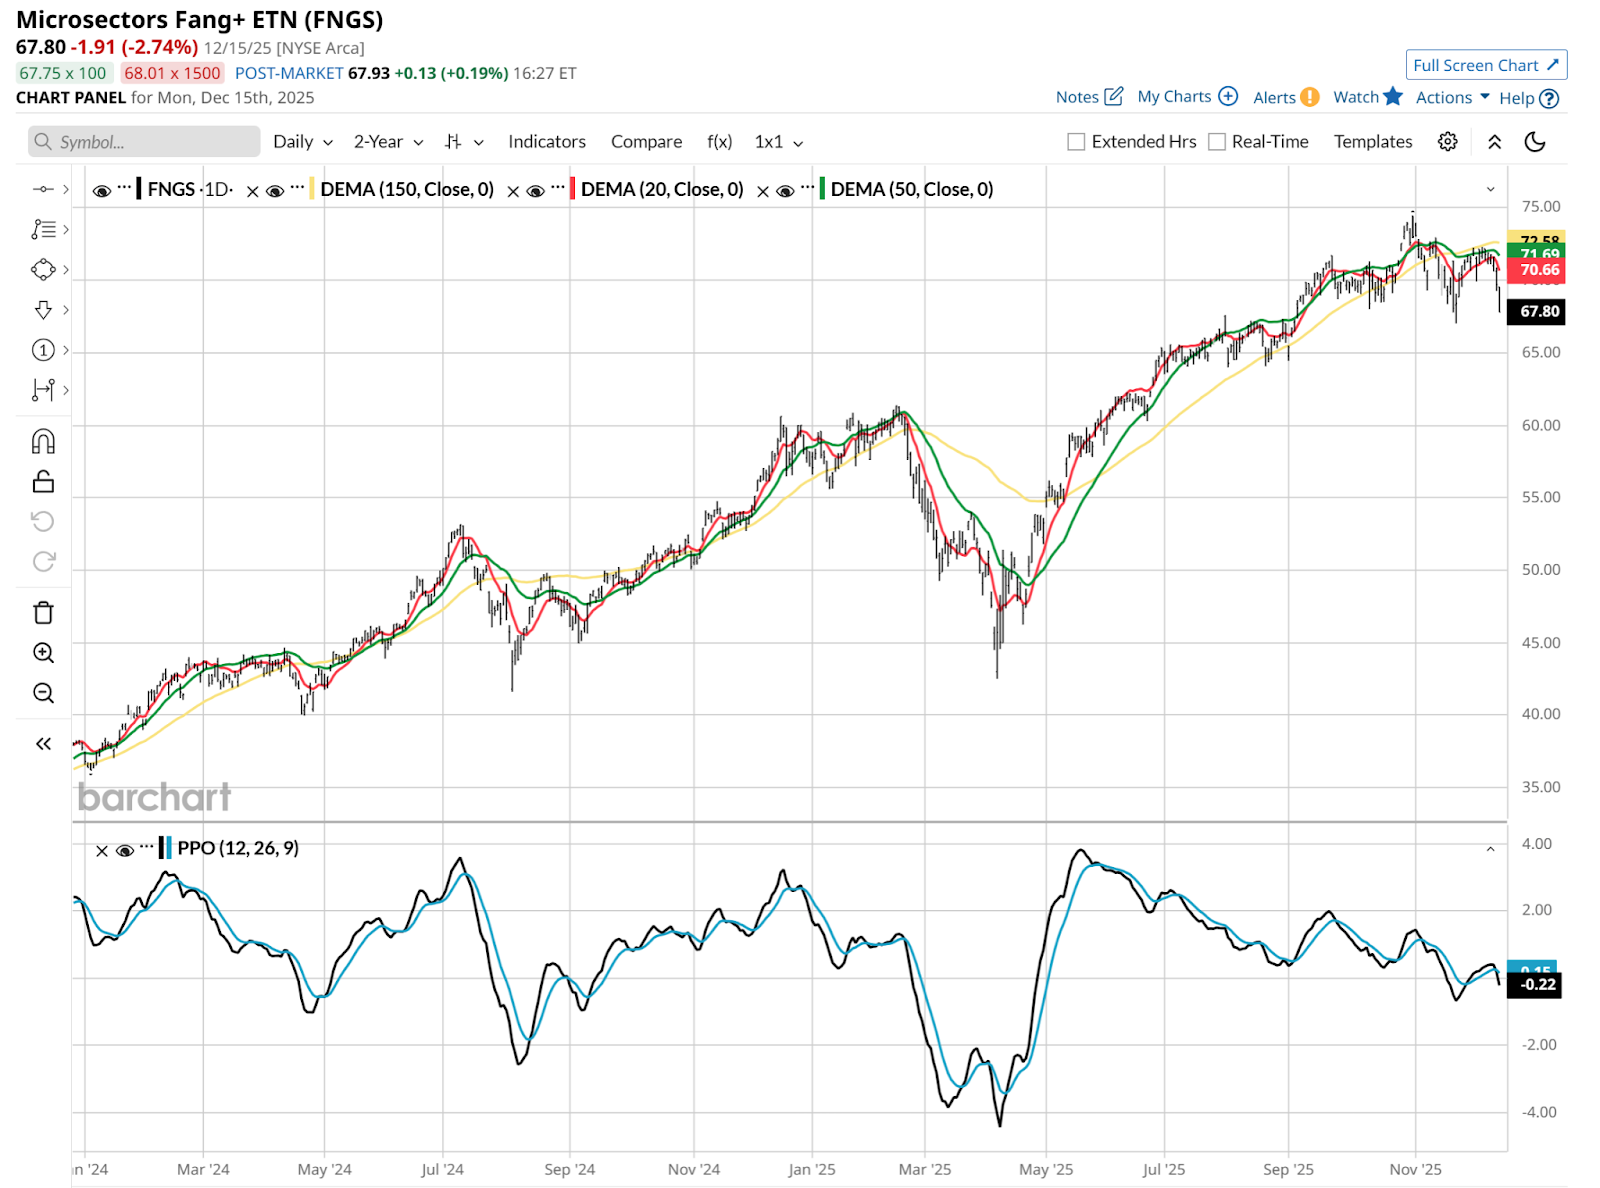
However, there’s just not much room to find a logical bottom below $65. Until under $45, that is. And lest we forget, FNGS fell by about 30% during this year’s February to April plunge.
The good news is that however a trader wants to play this, there’s a way. Because of course there is! There’s an ETF for anything, right?
How to Profit from a FANG+ Rally or Selloff
There are a range of ways to try to profit from the fate of the FANG+ group of 10 stocks, which currently comprise about 50% of the entire Nasdaq-100 Index ($IUXX).
As with a lot of currently-popular stock groups, FANG+ can be had as a “regular” 1X long basket via an ETF (FNGS). But it can also be leveraged 2x (FNGO) or 3x bullish (FNGU), or 3x bearish (FNGD).
This means that investors have what is essentially a shortcut if the market rolls over from its top-heavy nature. Sure, the tech sector could do some damage to portfolios. But if it is coming from the biggest stocks, including the ones in this 10-stock set, a leveraged ETF to the downside could allow a trader to use less capital to get a similar outcome as shorting the Nasdaq-100, or the S&P 500 ($SPX). And of course, when there is an eventual rally, the same thing works in reverse.
When we look inside ETFs like this, we realize there’s a lot more to them than the names. And that leverage, if used responsibly, can be a portfolio booster, in good times and bad.
Rob Isbitts, founder of Sungarden Investment Publishing, is a semi-retired chief investment officer, whose current research is found here at Barchart, and at his ETF Yourself subscription service on Substack. To copy-trade Rob’s portfolios, check out the new Pi Trade app.
On the date of publication, Rob Isbitts did not have (either directly or indirectly) positions in any of the securities mentioned in this article. All information and data in this article is solely for informational purposes. For more information please view the Barchart Disclosure Policy here.
/Microsoft%20headquarters%20By%20Peter.jpeg)
/NVIDIA%20Corp%20logo%20outside%20building-by%20BING-JHEN_HONG%20via%20iStock.jpg)
/Micron%20Technology%20Inc_%20logo%20on%20building-by%20vzphotos%20vis%20iStock.jpg)
/Amazon%20-%20Image%20by%20bluestork%20via%20Shutterstock.jpg)
