Silver doesn’t move politely. When the precious metal trends, it tends to rip higher fast, and when it reverses, it can punish late chasers just as quickly.
That’s why silver’s recent surge has traders asking the same question that Twitter Tom asked Senior Market Strategist John Rowland, CMT, during last week’s Market on Close livestream:
What’s driving the parabolic run in silver futures (SIH26) — and can it last?
John’s answer matters because it reframes silver as more than a “metal trade.” In his view, silver is acting like a high-beta signal tied to bigger macro forces — like industrial demand, fiat currency credibility, and risk sentiment.
But even in a parabolic market, there are still two practical “tells” you can track as a trader or investor:
- Is silver simply overextended, or structurally bid?
- Is this a silver story, or a “hard assets” story across the board?
Let’s break it down in plain English, and then turn it into action steps you can actually use on Barchart.
Why Silver Can Go Vertical When Other Assets Can’t
Silver is unusual because it sits at the intersection of two worlds:
It’s both a monetary metal, and an industrial metal.
That means it can catch a bid from “fear trade” behavior (like safe-haven gold does), while also catching demand from real-world use cases — especially as electrification and power infrastructure expand.
In late 2025, silver’s strength wasn’t subtle. Prices pushed to multi-year highs and volatility picked up sharply, so much so that CME raised its margin requirements on silver futures. That’s the kind of administrative move that tends to take place when markets get hot and positioning gets crowded.
That doesn’t “end the bull market” by itself, but it does tell you something important:
When leverage gets involved, silver can become a market where small moves trigger big reactions.
The Gold–Silver Ratio: John’s “Reality Check” Indicator
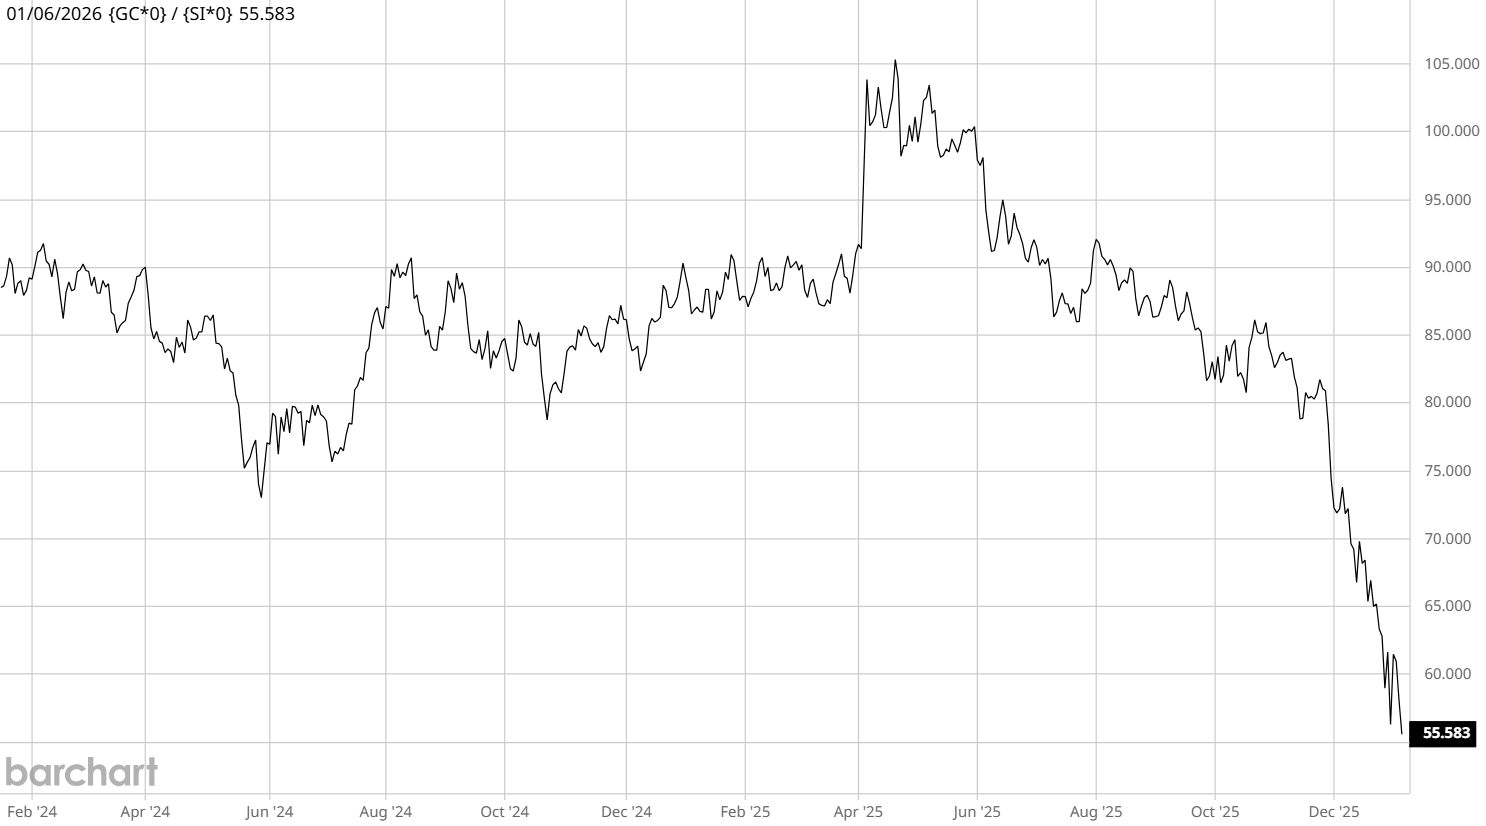
One of the best parts of John’s breakdown is that he doesn’t rely on one narrative. He checks the story against a relationship he’s been tracking professionally for decades – namely, the gold-silver ratio.
Gold price ÷ Silver price = Gold–Silver Ratio
This ratio isn’t a magic prediction tool, and it can’t tell you prices will be up tomorrow, or down next week. What it does well is highlight relative stretch: whether silver is getting “too expensive” relative to gold, or whether gold is the one lagging.
John’s key point is that when the ratio falls toward historically important zones, it can signal that:
- Silver may be extended, even if only temporarily; and/or
- Gold may be a better value relative to silver (meaning gold has “catch-up” potential)
This matters because silver often behaves like the accelerant in precious metals. It can spike harder than gold, and it can also drop faster.
So instead of arguing over “will silver crash?”, the more useful question becomes: If silver pauses, does gold start moving next?
The Bigger Tell: It’s Not Just Silver
John also zooms out and makes a point traders sometimes miss:
If silver is running and you’re also seeing strength across other metals (like gold, copper, and platinum), you may be looking at a broader “hard asset” bid — not a single isolated squeeze.
That theme has shown up repeatedly in research and reporting around metals markets: industrial demand (especially power and electronics uses) alongside macro hedging behavior can create sustained pressure on supply.
That’s why it’s important to monitor price swings in silver alongside:
- Gold
- Copper
- Miners
- The U.S. dollar
- Real yields
If silver is strong but everything else is weak, that’s when you might want to worry more about a blow-off move.
If silver is strong and the rest of the complex is firm, that’s when it’s time to respect trend continuation.
How to Track This on Barchart (Without Overcomplicating It)
Step 1: Build the gold–silver ratio chart
John’s “nearby contract” tip is important if you’re charting futures: you want the front/nearby contract for each metal (use *0 on Barchart to pull the most active contract).
On Barchart, you can build a ratio using a chart f(x) expression (gold divided by silver). Then, mark the zones you want to watch (John referenced ~65 as a key area), and track the action when the ratio approaches those levels again.
Step 2: Confirm the move with participation
This is the simplest confirmation filter:
- Are miners participating too?
- Is gold stable while silver leads (bullish risk-on metals vibe), or is silver doing all the work alone (indicating a more fragile rally)?
Step 3: Respect the trend
Here are some of the key ticker symbols you can track to follow these trades:
- SLV (silver exposure)
- PSLV (physical silver trust exposure)
- SIL and SILJ (silver miners & junior silver miners)
- GLD (gold exposure)
- GDX and GDXJ (gold miners & junior gold miners)
What Could Break the Trend?
John’s view was constructive — but as traders we respect two failure modes:
1) Leverage shakeouts (fast drops without a “new bear market”)
Silver can dump simply because it’s crowded. The CME margin changes and volatility flare-ups are reminders that this market can move violently when positioning gets stretched.
2) Macro regime shift
If real yields rip higher or the dollar strengthens aggressively, precious metals can stall. The move doesn’t have to become “bearish forever,” but it can become “range and chop” for longer than most people expect.
For John’s full analysis and a look at these chart levels in context, watch this quick breakdown from Market on Close:
Then open Barchart and pull up:
- Silver chart with Bollinger Bands
- Gold–Silver ratio f(x) expression
- Market performance leaders to compare the whole complex
On the date of publication, Barchart Insights did not have (either directly or indirectly) positions in any of the securities mentioned in this article. All information and data in this article is solely for informational purposes. For more information please view the Barchart Disclosure Policy here.
/Alphabet%20Inc_%20and%20Google%20logos%20by%20IgorGolovinov%20via%20Shutterstock.jpg)
/Technological%20process%20of%20soldering%20chip%20components%20on%20PCB%20board%20by%20I%20Viewfinder%20via%20Adobe%20Stock.jpeg)

