
It’s a fairly quiet week on the earnings front with only a couple of big name companies due to report. These include Costco (COST), Lululemon (LULU), Autozone (AZO), Docusign (DOCU), Gamestop (GME) Campbell Soup Company (CPB), Broadcom (AVGO) and Chewy (CHWY).
Before a company reports earnings, implied volatility is usually high because the market is unsure about the outcome of the report. Speculators and hedgers create huge demand for the company’s options which increases the implied volatility, and therefore, the price of options.
After the earnings announcement, implied volatility usually drops back down to normal levels.
Let’s take a look at the expected range for these stocks. To calculate the expected range, look up the option chain and add together the price of the at-the-money put option and the at-the-money call option. Use the first expiry date after the earnings date. While this approach is not as accurate as a detailed calculation, it does serve as a reasonably accurate estimate.
Monday
Nothing of note
Tuesday
AZO – 4.9%
Wednesday
CPB – 3.85%
GME – 11.8%
Thursday
COST – 4.6%
LULU – 7.4%
DOCU – 16.6%
AVGO – 4.2%
CHWY – 13.7%
Friday
Nothing of note
Option traders can use these expected moves to structure trades. Bearish traders can look at selling bear call spreads outside the expected range.
Bullish traders can sell bull put spreads outside the expected range, or look at naked puts for those with a higher risk tolerance.
Neutral traders can look at iron condors. When trading iron condors over earnings, it is best to keep the short strikes outside the expected range.
When trading options over earnings, it is best to stick to risk defined strategies and keep position size small. If the stock makes a larger than expected move and the trade suffers a full loss, it should not have more than a 1-3% effect on your portfolio.
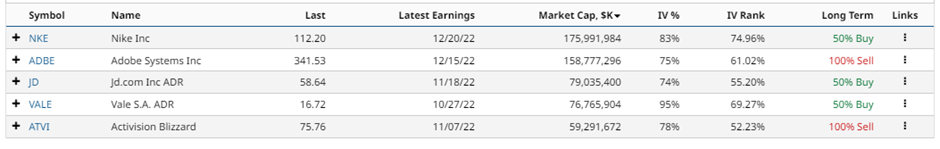
Stocks With High Implied Volatility
We can use Barchart’s Stock Screener to find other stocks with high implied volatility.
Let’s run the stock screener with the following filters:
- Total options volume: Greater than 5,000
- Market Cap: Greater than 40 billion
- IV Percentile: Greater than 70%
This screener produces the following results, ranked by implied volatility percentile:
You can refer to this article for details of how to find option trades for this earnings season.
Last Week’s Earnings Moves
Last week’s actual versus expected moves are shown below:
PDD +12.6% vs 11.1% expected
CRWD -14.8% vs 9.7% expected
WDAY +17.2% vs 8.4% expected
SNOW +7.8% vs 13.9% expected
CRM -8.3% vs 7.7% expected
DG -7.6% vs 5.6% expected
KR -1.6% vs 6.4% expected
CHPT -4.5% vs 10.4% expected
ULTA -0.3% vs 6.9% expected
MRVL -1.5% vs 9.8% expected
Overall, there were 5 out of 10 that stayed within the expected range.
Changes In Open Interest
Advanced Micro Devices (AMD), Ford (F), Apple (AAPL), AMC Entertainment (AMC), Alibaba (BABA) and Meta Platforms (META) saw some of the largest changes in open interest last week.
Other stocks with large changes in open interest are shown below:

Please remember that options are risky, and investors can lose 100% of their investment. This article is for education purposes only and not a trade recommendation. Remember to always do your own due diligence and consult your financial advisor before making any investment decisions.
More Stock Market News from Barchart
- PPI, PMI and other Key Themes To Watch This Week
- Johnson and Johnson Stock Is Attractive to Short Put Investors for Income
- Friday's Last Call, Lots of Markets to Talk About
- Stocks Recover Most of Their Losses as Bond Yields Erase an Early Surge
/AI%20(artificial%20intelligence)/AI%20technology%20concept%20by%20NMStudio789%20via%20Shutterstock.jpg)


