
The wheat complex saw mixed trade on Thursday, with the HRW market holding up. Chicago SRW contracts saw fractional to 1 ½ cent losses on Thursday, as September was up a dime this week. KC HRW futures...
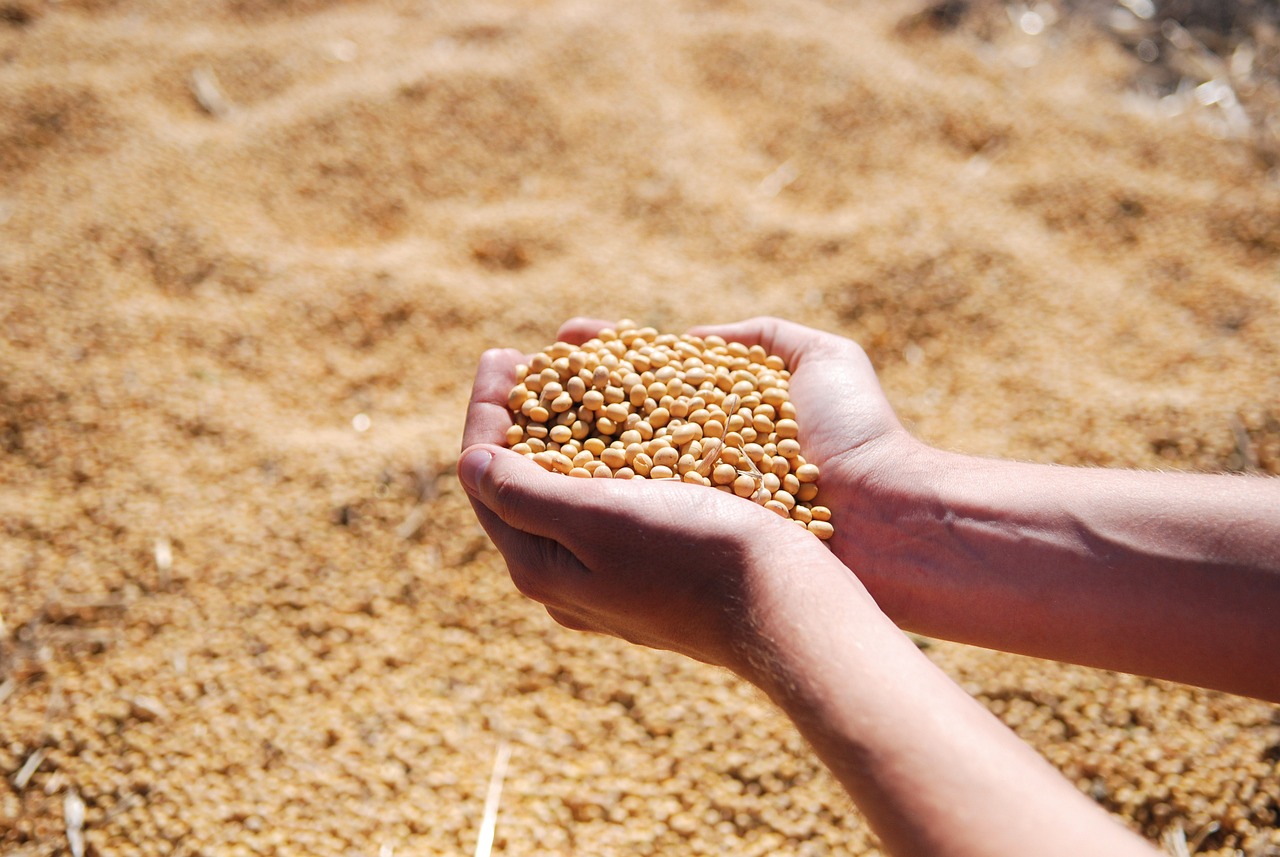
Soybeans closed with front month losses of ½ to 5 ½ cents, as back months were 1 ½ to 4 ¼ cents lower. August managed to hold on for just a tick loss this week, with November down 8 ½ cents. The cmdtyView...
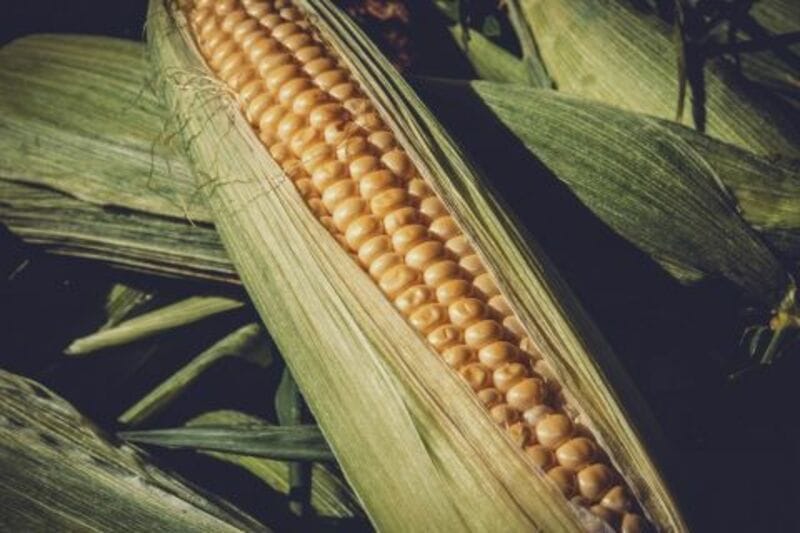
Corn futures were mixed on Thursday, with front months ¼ to 4 cents higher and deferreds down as much as 2 3/4 cents. September was up just 1 ¼ on the 4-day week, with December steady. The CmdtyView...
In my opinion, the first half of this year's higher trading is no Aesop's fable of "The boy who cried Wolf".
Agricultural Prices2026-07-02
Crop Progress2026-07-02

Corn futures are mixed on Thursday, with front months steady to 2 1/4 cents higher and deferreds down as much as 1 ½ cents. There were 262 delivery notices against July corn overnight. The CmdtyView...

Soybeans are up 1 to 3 cents in the front months on Thursday, with near crop down 1 to 2 cents. There were 30 deliveries against July soybeans overnight. The cmdtyView national average Cash Bean price...

The wheat complex is showing mixed trade as we head into a 3-day weekend. Chicago SRW contracts are fractionally to 2 cents in the red on the day. KC HRW futures are trading with midday gains of 1 to 2...
Grain Stocks2026-07-02