[[ type === 'moc' ? 'MARKET ON CLOSE' : 'FREE WEBINAR' ]]
[[ timeLabel ]] WATCH LIVE:
Your browser of choice has not been tested for use with Barchart.com. If you have issues, please download one of the browsers listed here.
Stocks | Futures | Watchlist | News | More
or
Faster, Cleaner, Better.

Crude Oil REBCO Jul '12 (REN12)

[[ item.lastPrice ]] [[ item.priceChange ]] ([[ item.percentChange ]]) [[ item.tradeTime ]] [NYMEX]
[[ item.bidPrice ]] x [[ item.bidSize ]] [[ item.askPrice ]] x [[ item.askSize ]]
[[ rootItem.symbol ]]underlying price [[ rootItem.lastPrice ]] [[ rootItem.priceChange ]] ([[ rootItem.percentChange ]]) [[ rootItem.tradeTime ]]
Quote Overview for [[ item.sessionDateDisplayLong ]]
[[ rowChartData.labelLow ]]
[[ rowChartData.lowPriceFormatted ]]
[[ rowChartData.lowPrice ]]
[[ rowChartData.labelHigh ]]
[[ rowChartData.highPriceFormatted ]]
[[ rowChartData.highPrice ]]
since [[ rowChartData.lowDate ]]
since [[ rowChartData.highDate ]]
[[ value ]] [[ value ]] ([[ financialData.relativeStrengthDirection14d ]]) ([[ financialData.highPercent1y ]]) ([[ financialData.lowPercent1y ]])

Contract Specifications

See More
Contract
N/A
Contract Size
N/A
Tick Size
N/A
Trading Hours
N/A
Exchange
NYMEX
Point Value
N/A

Seasonal Chart

Crude Oil REBCO Jul '12
Average Price Chart for 5 Prior Jul Contracts
Get Realtime - Quotes and Charts for Futures Traders. Learn More >>

Price Performance

See More
Period Period Low Period High Performance
1-Month
93.53 unch
on 06/12/12
108.07 -13.45%
on 05/15/12
-15.69 (-14.37%)
since 05/11/12
3-Month
93.53 unch
on 06/12/12
122.00 -23.34%
on 03/13/12
-27.83 (-22.93%)
since 03/12/12
52-Week
82.88 +12.85%
on 09/30/11
122.97 -23.94%
on 03/08/12
-19.70 (-17.40%)
since 06/10/11

More Crude Oil REBCO Quotes

All Futures Prices
Please wait...

Most Recent Stories

More News
Corn Showing a Modest Bounce at Friday’s Midday

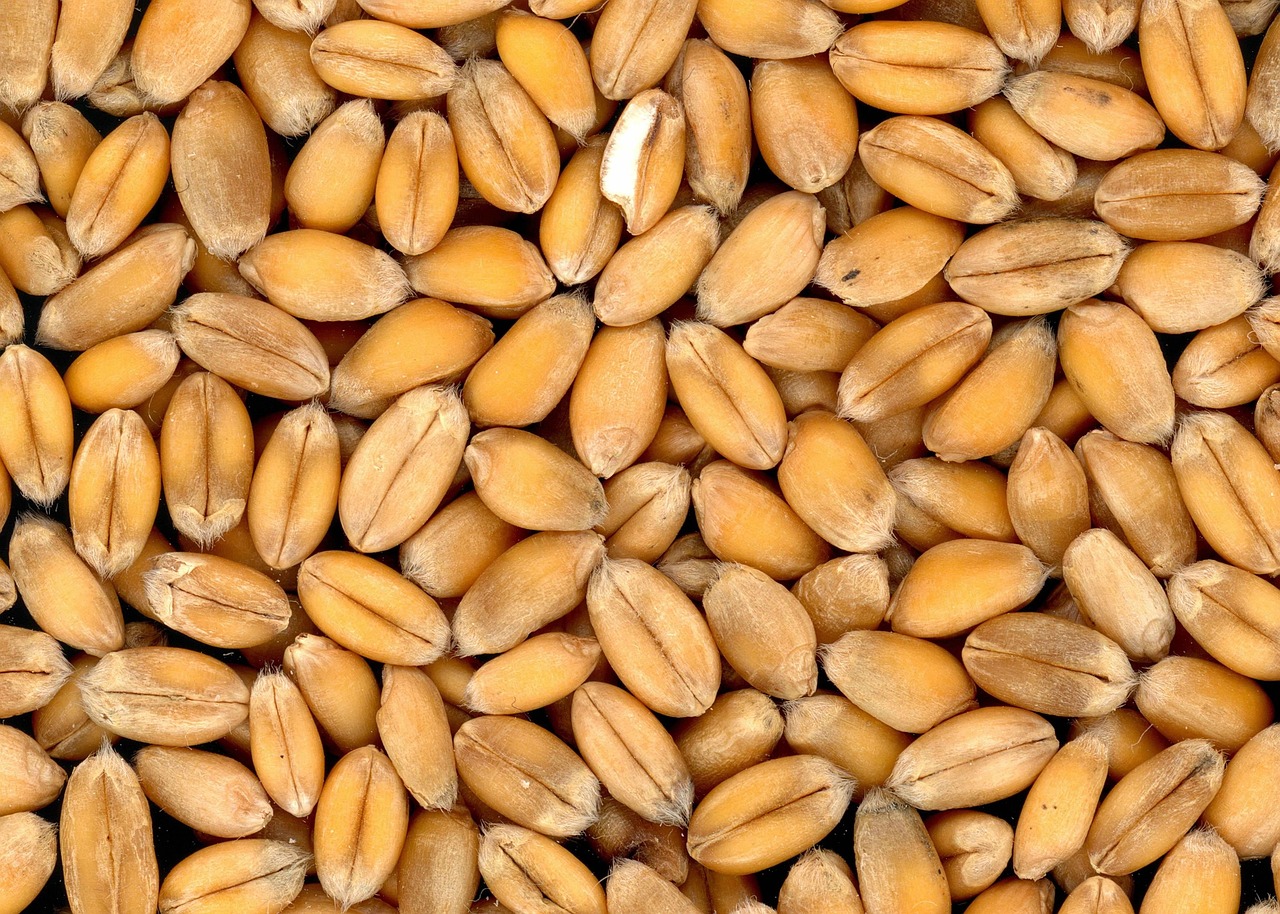
Corn futures are up 1 to 2 cents across the front months on Friday. The CmdtyView national average Cash Corn price is up 1 1/4 cents at $3.81. Export Sales data now has the old crop export commitment...

ZCZ26 : 440-2s (+0.17%)
ZCU26 : 420-6s (+0.18%)
ZCN26 : 412-6s (+0.24%)
ZCPZ26US.CM : 4.0456 (+0.17%)
ZCPAUS.CM : 3.8066 (+0.28%)
Wheat Posting Mixed Midday Trade

The wheat complex is showing mixed trade on Friday. Chicago SRW contracts are fractionally mixed on Friday. KC HRW futures are 2 to 3 cents higher at midday. MPLS spring wheat is showing mixed trade, fractionally...

KEU26 : 640-6s (-0.08%)
KEN26 : 634-4s (-0.04%)
MWN26 : 6.1775 (-0.28%)
ZWN26 : 584-4s (-0.38%)
ZWU26 : 595-6s (-0.42%)
Soybean Weakness Holding On Friday

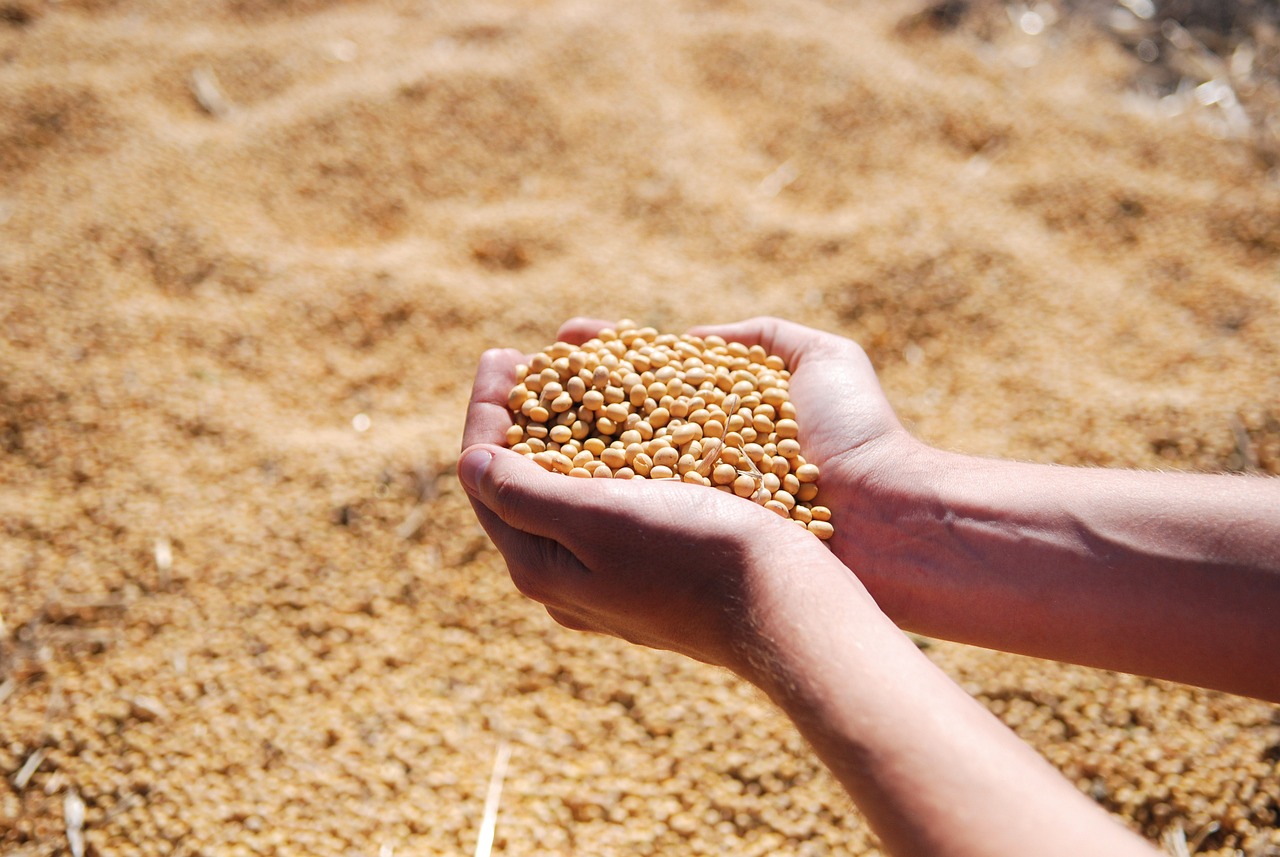
Soybeans are trading with 1 to 2 cent losses at Friday’s midday. The cmdtyView national average Cash Bean price is down a penny at $10.60 1/2. Soymeal futures are mixed, down a 20 cents to a dime higher...

ZSPAUS.CM : 10.5935 (-0.12%)
ZLZ26 : 69.67s (-0.67%)
ZMZ26 : 304.8s (+0.10%)
ZSPX26US.CM : 10.6548 (-0.19%)
ZSX26 : 1132-0s (-0.18%)
ZSN26 : 1113-4s (-0.13%)
ZSQ26 : 1118-6s (-0.16%)
Wheat Falling Early on Friday

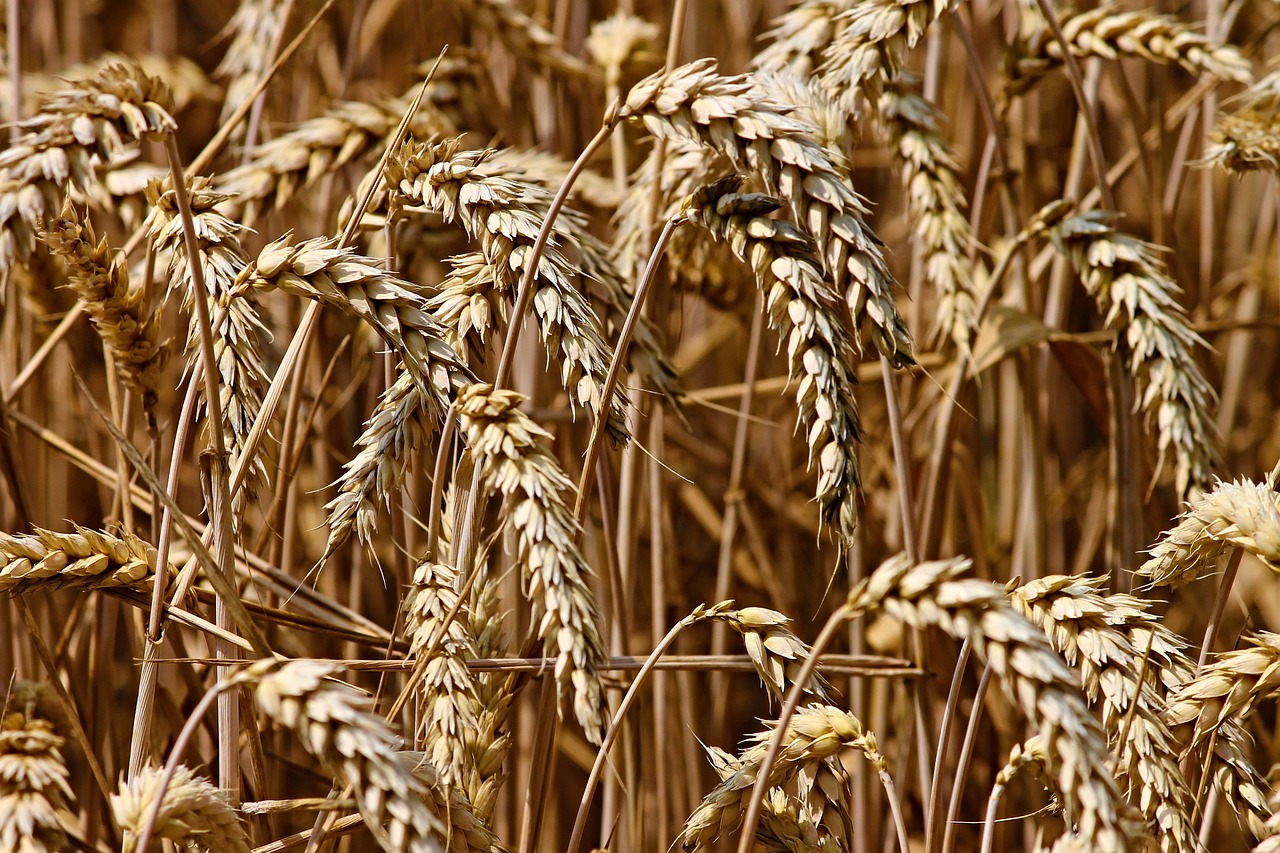
Wheat is trading with contracts down 1 to 4 cents across most contracts. The wheat complex posted marginally mixed trade on Thursday, with the hard red contracts higher. Chicago SRW was the weak spot,...

KEU26 : 640-6s (-0.08%)
KEN26 : 634-4s (-0.04%)
MWN26 : 6.1775 (-0.28%)
ZWN26 : 584-4s (-0.38%)
ZWU26 : 595-6s (-0.42%)
Soybeans Down a Penny Early on Friday

Soybeans are trading with 1 to 2 cent lower action early on Friday. Futures closed Thursday with fractional to 8 cent losses. Open interest wa sup just 2,894 contracts. The cmdtyView national average...

ZSPAUS.CM : 10.5935 (-0.12%)
ZLZ26 : 69.67s (-0.67%)
ZMZ26 : 304.8s (+0.10%)
ZSPX26US.CM : 10.6548 (-0.19%)
ZSX26 : 1132-0s (-0.18%)
ZSN26 : 1113-4s (-0.13%)
ZSQ26 : 1118-6s (-0.16%)
Corn Starting Friday with modest Losses

Corn prices are down ½ to 1 ½ cents so far on Friday morning. Futures closed Thursday with losses of 7 to 10 ½ cents across most contracts, as increased supplies on USDA’s balance sheets added pressure....

ZCZ26 : 440-2s (+0.17%)
ZCU26 : 420-6s (+0.18%)
ZCN26 : 412-6s (+0.24%)
ZCPZ26US.CM : 4.0456 (+0.17%)
ZCPAUS.CM : 3.8066 (+0.28%)
Is the Commodity Complex the Definition of Insanity Early Friday Morning?

Friday morning in the commodity complex looks to be a classic case of doing the same thing over and over again and expecting different results.

HON26 : 3.4013 (-3.18%)
GCQ26 : 4,247.6 (+3.25%)
ZCZ26 : 440-2s (+0.17%)
ZSN26 : 1113-4s (-0.13%)
ZCU26 : 420-6s (+0.18%)
ZSX26 : 1132-0s (-0.18%)
KEN26 : 634-4s (-0.04%)
CLN26 : 84.91 (-3.19%)
ZCN26 : 412-6s (+0.24%)
KEU26 : 640-6s (-0.08%)
SIN26 : 68.285 (+6.69%)
The Case for $3 Corn Revisited

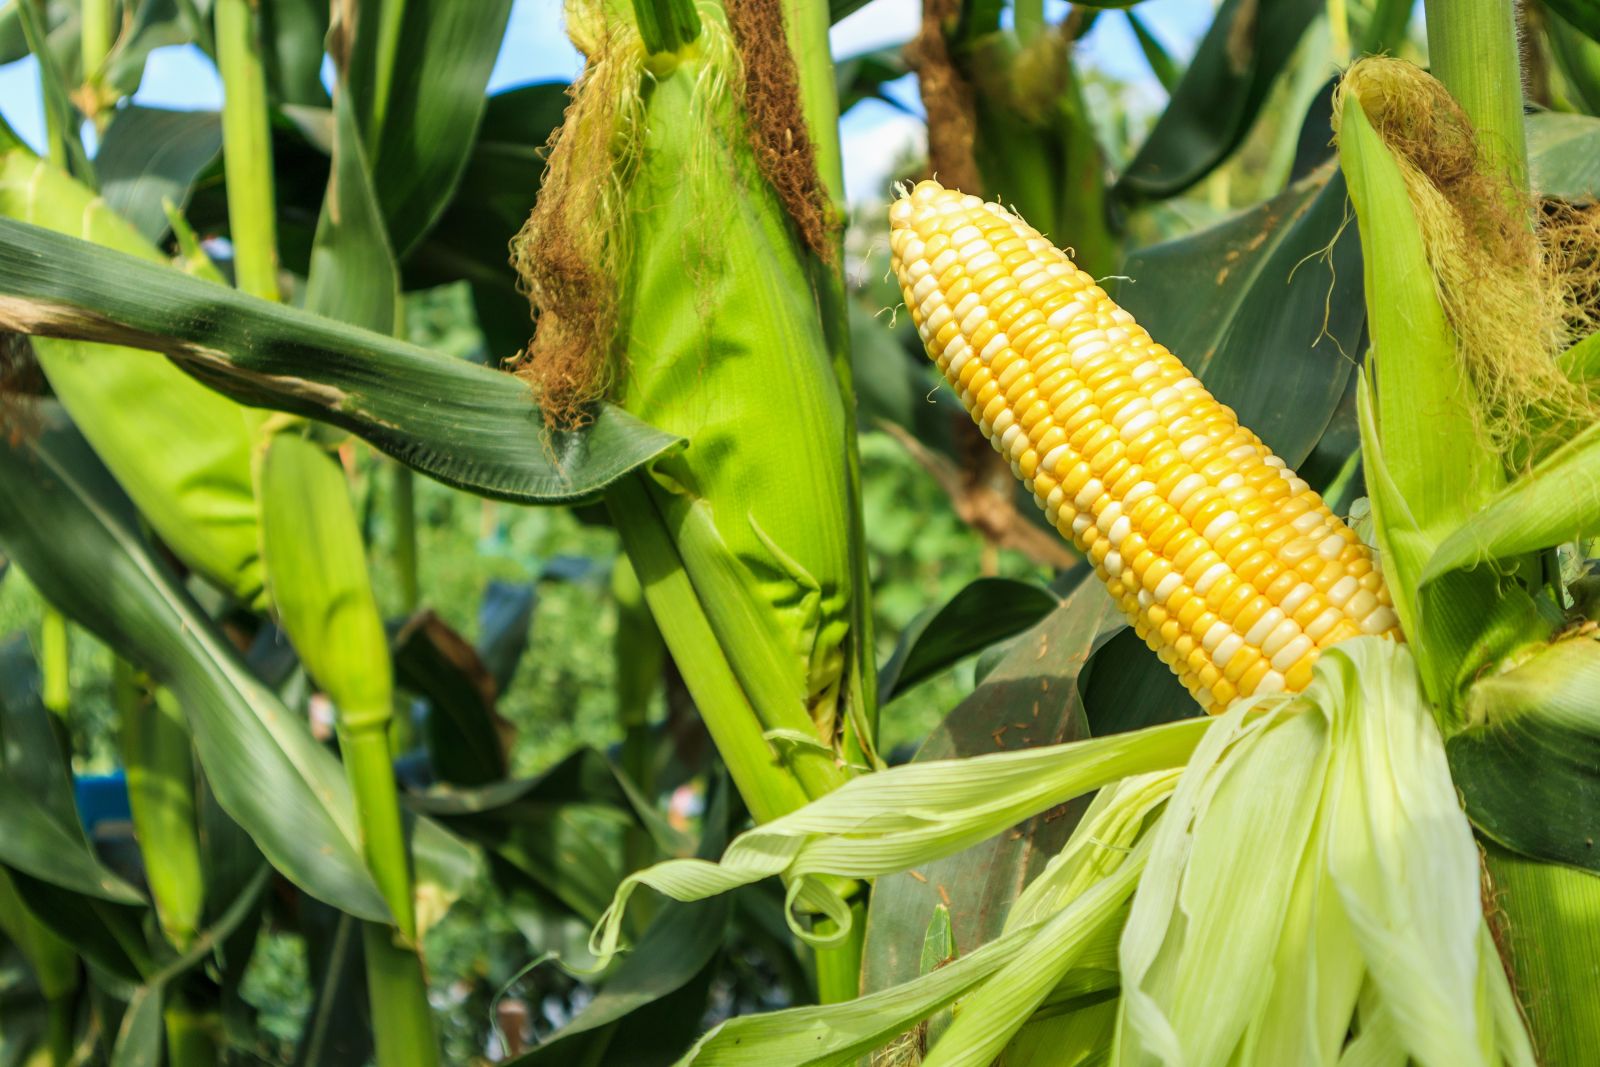
We look at Corn's Head and Shoulder's pattern and the measured move price target of 3 dollars per bushel

ZSN26 : 1113-4s (-0.13%)
ZCN26 : 412-6s (+0.24%)
Soybeans Face Thursday Weakness, as USDA Hikes Argentina Production

Soybeans closed Thursday with fractional to 8 cent losses. The cmdtyView national average Cash Bean price was down 7 3/4 cents at $10.61 1/2. Soymeal futures were mixed, down $1.00 to $1.80 higher on the...

ZSPAUS.CM : 10.5935 (-0.12%)
ZLZ26 : 69.67s (-0.67%)
ZMZ26 : 304.8s (+0.10%)
ZSPX26US.CM : 10.6548 (-0.19%)
ZSX26 : 1132-0s (-0.18%)
ZSN26 : 1113-4s (-0.13%)
ZSQ26 : 1118-6s (-0.16%)
Corn Falls on Thursday as USDA Raises South American Production

Corn futures closed Thursday with losses of 7 to 10 ½ cents across most contracts, as increased supplies on USDA’s balance sheets added pressure. The CmdtyView national average Cash Corn price was down...

ZCZ26 : 440-2s (+0.17%)
ZCU26 : 420-6s (+0.18%)
ZCN26 : 412-6s (+0.24%)
ZCPZ26US.CM : 4.0456 (+0.17%)
ZCPAUS.CM : 3.8066 (+0.28%)

Key Turning Points

3rd Resistance Point N/A
2nd Resistance Point 93.53
1st Resistance Point 93.53
Last Price 93.53s
1st Support Level 93.53
2nd Support Level 93.53
3rd Support Level N/A

See More

52-Week High 122.97
Fibonacci 61.8% 107.66
Fibonacci 50% 102.93
Fibonacci 38.2% 98.19
Last Price 93.53s
52-Week Low 82.88

See More

Want to use this as
your default charts setting?
Save this setup as a Chart Templates
Switch the Market flag
for targeted data from your country of choice.
Open the menu and switch the
Market flag for targeted data from your country of choice.
Want Streaming Chart Updates?
Switch your Site Preferences
to use Interactive Charts
Need More Chart Options?
Right-click on the chart to open the Interactive Chart menu.
Use your up/down arrows to move through the symbols.