Your browser of choice has not been tested for use with Barchart.com. If you have issues, please download one of the browsers listed here.
Stocks | Futures | Watchlist | News | More
or
Faster, Cleaner, Better.

Molybdenum Oxide Platts Mar '26 (IAVH26)

[[ item.lastPrice ]] [[ item.priceChange ]] ([[ item.percentChange ]]) [[ item.tradeTime ]] [COMEX]
[[ item.bidPrice ]] x [[ item.bidSize ]] [[ item.askPrice ]] x [[ item.askSize ]]
[[ rootItem.symbol ]]underlying price [[ rootItem.lastPrice ]] [[ rootItem.priceChange ]] ([[ rootItem.percentChange ]]) [[ rootItem.tradeTime ]]
Quote Overview for [[ item.sessionDateDisplayLong ]]
[[ rowChartData.labelLow ]]
[[ rowChartData.lowPriceFormatted ]]
[[ rowChartData.lowPrice ]]
[[ rowChartData.labelHigh ]]
[[ rowChartData.highPriceFormatted ]]
[[ rowChartData.highPrice ]]
since [[ rowChartData.lowDate ]]
since [[ rowChartData.highDate ]]
[[ value ]] [[ value ]]

Contract Specifications

See More
Contract
N/A
Contract Size
N/A
Tick Size
N/A
Trading Hours
N/A
Exchange
COMEX
Point Value
$100
Expiration Date
03/31/26 (35 days)
Get Realtime - Quotes and Charts for Futures Traders. Learn More >>

More Molybdenum Oxide (Platts) Quotes

All Futures Prices
Please wait...

Most Recent Stories

More News
Are the Best Days Over for IBM Stock? What Price Volatility Tells Us and How You Can Trade IBM Now.

IBM’s volume was three times its 30-day average yesterday. It also had a high standard deviation of -3.46. Big moves are the norm for IBM; this latest decline suggests the good times could be over.

AAPL : 274.08 (+2.97%)
TDVI : 27.98 (+1.49%)
IBM : 234.07 (+4.80%)
BRK.B : 491.80 (-0.46%)
IGV : 78.17 (+1.60%)
TDIV : 98.62 (+1.54%)
SPY : 686.07 (+0.54%)
As Oil Surges on Iran Tensions, Is It Better To Buy the Commodity or Energy Stocks?

Geopolitical fears are sending oil prices up. Here's the best way to play oil right now.

USO : 80.22 (-0.84%)
XLE : 54.66 (-0.89%)
IEO : 104.72 (-1.03%)
$SPX : 6,872.74 (+0.51%)
QAK26 : 70.73 (-0.53%)
Grain Markets Come Alive

Grain markets had seen volatility rise over the last few sessions, presenting more tradable opportunities

Dollar Rises on Yen Weakness and Solid US Economic News

The dollar index (DXY00 ) today is up by +0.23%. The dollar is climbing today on weakness in the yen, which fell to a 2-week low against the dollar. Also, today's better-than-expected US economic news...

DXY00 : 97.887 (+0.19%)
GCJ26 : 5,168.4 (-1.09%)
SIH26 : 87.750 (+1.36%)
^USDJPY : 155.877 (+0.78%)
^EURUSD : 1.17731 (-0.10%)
The Supreme Court has overturned part of the tariffs. What is next?

The Supreme Court’s partial rollback of tariffs is good news for most, but it might pose a challenge for the system.

Stocks Rebound as Software Stocks Recover

The S&P 500 Index ($SPX ) (SPY ) today is up +0.17%, the Dow Jones Industrial Average ($DOWI ) (DIA ) is up +0.64%, and the Nasdaq 100 Index ($IUXX ) (QQQ ) is up +0.47%. March E-mini S&P futures (ESH26...

INTU : 363.35 (+1.06%)
HSIC : 85.35 (+5.93%)
HIMS : 15.07 (-2.84%)
DDOG : 103.71 (+1.07%)
EXPD : 138.43 (-7.49%)
PAY : 23.68 (-2.95%)
$IUXX : 24,938.02 (+0.93%)
BWXT : 203.89 (+2.78%)
ZNH26 : 113-080 (-0.11%)
ESH26 : 6,884.75 (+0.49%)
QCOM : 144.77 (+3.11%)
KEYS : 291.04 (+18.79%)
How Much Higher Can Corn Prices Move Here?

May corn futures present a buying opportunity on more price strength.

ZCK26 : 438-0 (-0.51%)
Is Exxon Mobil Stock Outperforming the Nasdaq?

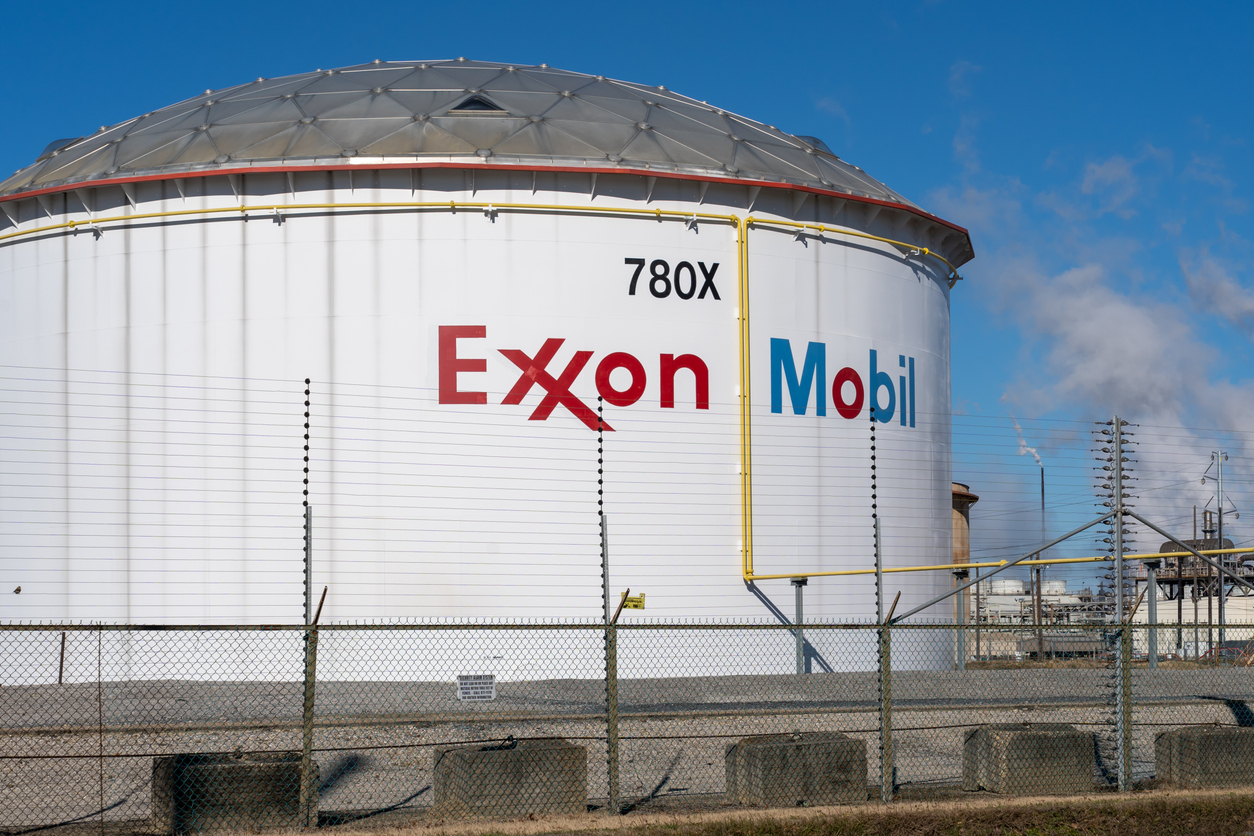
Exxon Mobil has outperformed the Nasdaq over the past year, and analysts are moderately optimistic about the stock’s prospects.

$NASX : 22,818.57 (+0.85%)
CVX : 184.68 (-0.12%)
XOM : 149.14 (-1.07%)
Soybeans Easing Back on Tuesday Morning

Soybeans are trading with 3 to 4 cent front month losses so far on Tuesday morning. Futures closed with Monday losses of 2 to 4 cents in the nearbys. Some deferreds held up. Open interest was down 9,956...

ZSPAUS.CM : 10.7511 (+0.57%)
ZLK26 : 60.37 (+0.82%)
ZMK26 : 314.5 (+0.64%)
ZSX25 : 1112-6s (-1.70%)
ZSH26 : 1140-2 (+0.53%)
ZSK26 : 1156-0 (+0.54%)

Key Turning Points

3rd Resistance Point N/A
2nd Resistance Point N/A
1st Resistance Point N/A
Last Price 25.00s
1st Support Level N/A
2nd Support Level N/A
3rd Support Level N/A

See More

Last Price 25.00s
52-Week High 0.00
Fibonacci 61.8% N/A
Fibonacci 50% N/A
Fibonacci 38.2% N/A
52-Week Low 0.00

See More

Want to use this as
your default charts setting?
Save this setup as a Chart Templates
Switch the Market flag
for targeted data from your country of choice.
Open the menu and switch the
Market flag for targeted data from your country of choice.
Want Streaming Chart Updates?
Switch your Site Preferences
to use Interactive Charts
Need More Chart Options?
Right-click on the chart to open the Interactive Chart menu.
Use your up/down arrows to move through the symbols.
Free Barchart Webinar