
Earnings reports this week focus on retailers and some tech names. These are the big names to keep an eye on – Walmart (WMT), Home Depot (HD), Target (TGT), Lowe’s (LOW), Nvidia (NVDA), Cisco (CSCO), Alibaba Group (BABA), Applied Materials (AMAT), JD.com (JD) and Foot Locker (FL).
Before a company reports earnings, implied volatility is usually high because the market is unsure about the outcome of the report. Speculators and hedgers create huge demand for the company’s options which increases the implied volatility, and therefore, the price of options.
After the earnings announcement, implied volatility usually drops back down to normal levels.
Let’s take a look at the expected range for these stocks. To calculate the expected range, look up the option chain and add together the price of the at-the-money put option and the at-the-money call option. Use the first expiry date after the earnings date. While this approach is not as accurate as a detailed calculation, it does serve as a reasonably accurate estimate.
Tuesday
WMT – 5.7%
HD – 6.0%
AAP – 6.4%
Wednesday
ZIM – 10.0%
TGT – 9.5%
LOW – 7.3%
NVDA – 8.3%
CSCO – 5.4%
Thursday
BABA – 8.5%
M – 11.7%
KSS – 8.5%
PANW – 8.0%
AMAT – 6.1%
Friday
JD – 10.2%
FL – 11.8%
Option traders can use these expected moves to structure trades. Bearish traders can look at selling bear call spreads outside the expected range.
Bullish traders can sell bull put spreads outside the expected range, or look at naked puts for those with a higher risk tolerance.
Neutral traders can look at iron condors. When trading iron condors over earnings, it is best to keep the short strikes outside the expected range.
When trading options over earnings, it is best to stick to risk defined strategies and keep position size small. If the stock makes a larger than expected move and the trade suffers a full loss, it should not have more than a 1-3% effect on your portfolio.
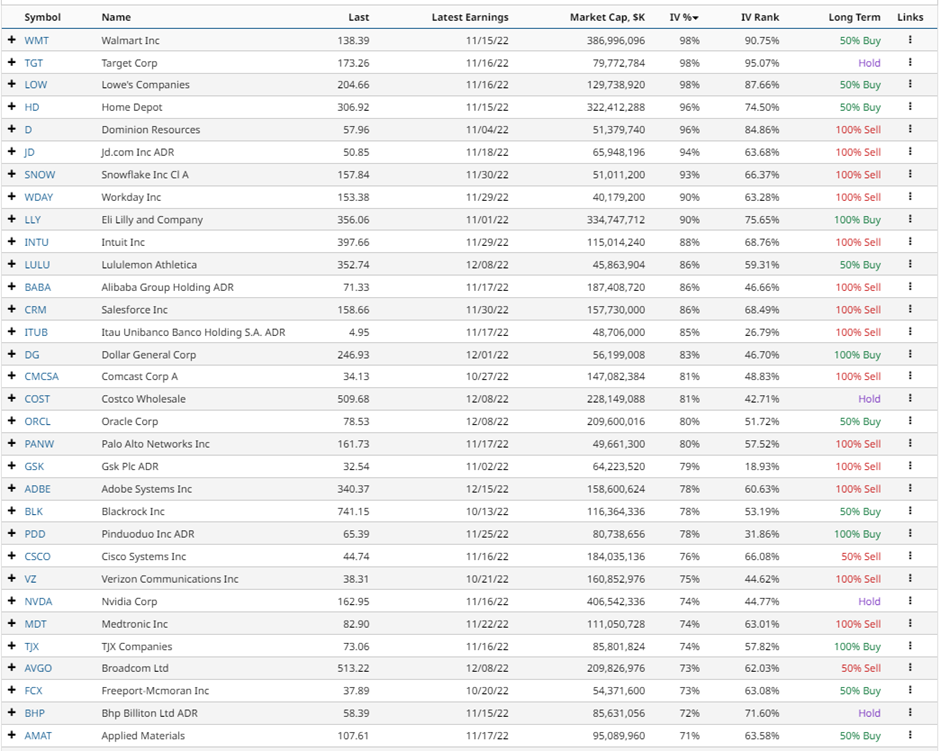
Stocks With High Implied Volatility
We can use Barchart’s Stock Screener to find other stocks with high implied volatility.
Let’s run the stock screener with the following filters:
- Total options volume: Greater than 5,000
- Market Cap: Greater than 40 billion
- IV Percentile: Greater than 70%
This screener produces the following results, ranked by implied volatility percentile:
You can refer to this article for details of how to find option trades for this earnings season.
Last Week’s Earnings Moves
Last week’s actual versus expected moves are shown below:
PLTR -11.5% vs 14.8% expected
MOS +6.0% vs 8.2% expected
BNTX +4.2% vs 9.4% expected
LYFT -22.9% vs 17.6% expected
NCLH +3.7% vs 9.6% expected
AMC -7.7% vs 14.9% expected
DIS -13.2% vs 7.5% expected
OXY -9.2% vs 6.0% expected
UPST -10.4% vs 22.3% expected
AFRM -22.6% vs 22.2% expected
TTD -8.0% vs 17.8% expected
RBLX -21.0% vs 15.6% expected
WYNN +5.5% vs 8.6% expected
NIO +11.8% vs 13.4% expected
AZN +6.6% vs 3.8% expected
Overall, there were 9 out of 15 that stayed within the expected range.
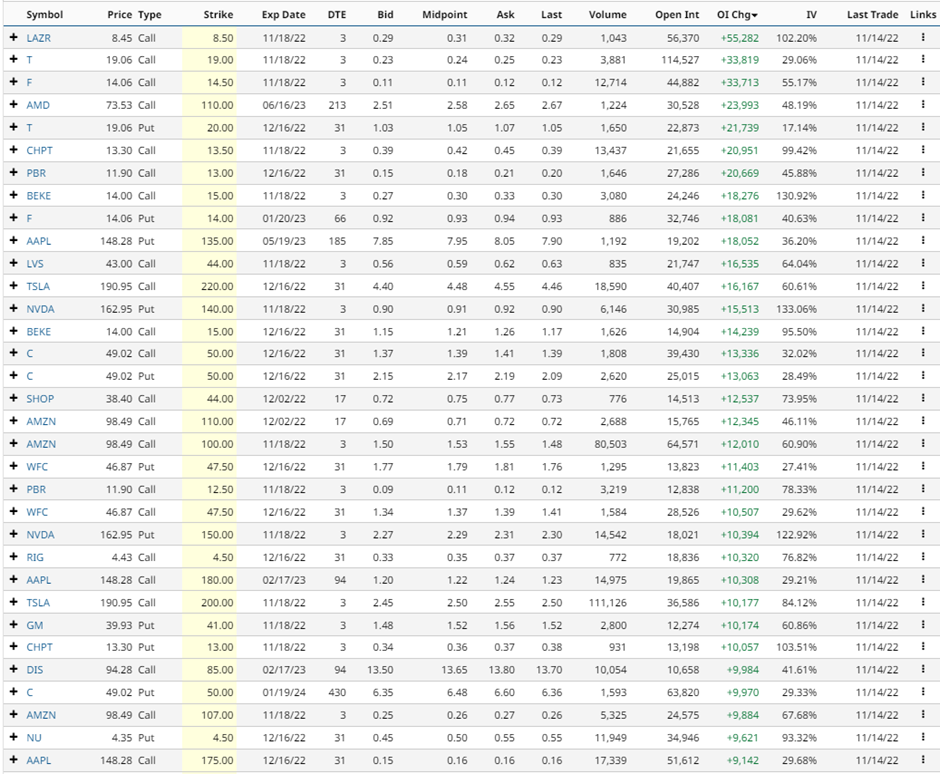
Changes In Open Interest
AT&T (T), Ford (F), Advanced Micro Devices (AMD), Apple (AAPL), Tesla (TSLA), Nvidia (NVDA) and Amazon (AMZN) saw some of the largest changes in open interest last week.
Other stocks with large changes in open interest are shown below:
Please remember that options are risky, and investors can lose 100% of their investment. This article is for education purposes only and not a trade recommendation. Remember to always do your own due diligence and consult your financial advisor before making any investment decisions.
More Stock Market News from Barchart
- Stocks Slide on Weakness in Technology and Retailers
- Qualcomm's 3.9% Total Yield to Shareholders Bodes Well for the Stock
- These 3 Dividend Aristocrats Are Rated 100% Buy
- China’s Alibaba Group May See a Turnaround
/An%20Intel%20sign%20out%20front%20of%20a%20corporate%20office%20by%20wolterke%20via%20Adobe%20Stock.jpeg)
/A%20close-up%20of%20a%20SpaceX%20sign%20by%20Sundry%20Photography%20via%20Adobe%20Stock.jpeg)


/A%20close-up%20of%20the%20Broadcom%20logo%20on%20a%20smartphone%20by%20Timon%20via%20Adobe%20Stock.jpeg)