
September S&P 500 E-Mini futures (ESU26) are up +0.48%, and September Nasdaq 100 E-Mini futures (NQU26) are up +1.02% this morning as investors cheered strong growth in Microsoft’s cloud business, signaling...
Reported net income attributable to Valero stockholders of $3.7 billion, or $12.62 per share Reported adjusted net income attributable to Valero stockholders of $3.7 billion, or $12.54...
Barchart Research What to Expect from VLO Earnings VLO Generated July 29, 2026 Current Price $301.32 EPS Estimate $$9.87 Consensus Rating Moderate Buy Average Move 2.97% Valero's Refining Windfall May...

The S&P 500 Index ($SPX ) (SPY ) today is down -0.71%, the Dow Jones Industrial Average ($DOWI ) (DIA ) is down -1.53%, and the Nasdaq 100 Index ($IUXX ) (QQQ ) is down -0.98%. September E-mini S&P futures...

As crack spreads widen amid tight refining capacity, Delek U.S. Holdings, PBF Energy, and Par Pacific Holdings post strong YTD gains ahead of their upcoming Q2 earnings reports.

The S&P 500 Index ($SPX ) (SPY ) today is down -0.18%, the Dow Jones Industrial Average ($DOWI ) (DIA ) is down -0.85%, and the Nasdaq 100 Index ($IUXX ) (QQQ ) is down -0.23%. September E-mini S&P futures...

Amid intensifying Iran war disruptions and record crack spreads, Valero, Marathon Petroleum, and Phillips 66 shares have surged to all-time highs, backed by strong earnings, buybacks, and dividends.
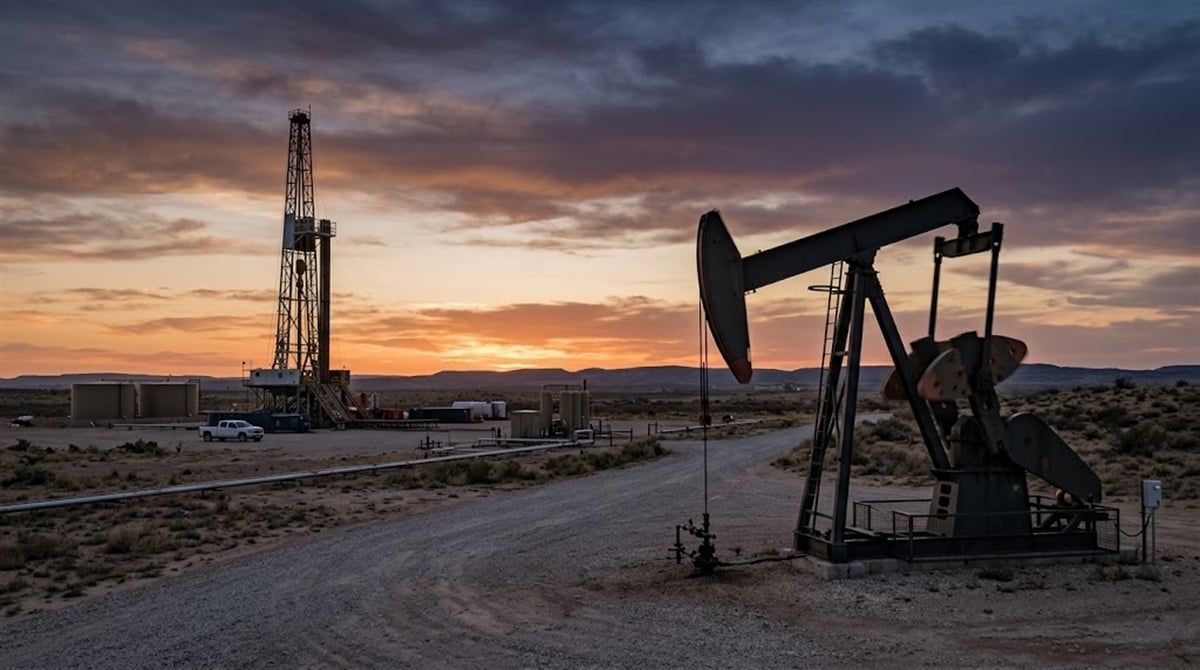
Rising oil prices tied to Iran tensions and surging AI-driven power demand are boosting Valero, Marathon Petroleum, GE Vernova and Ecovyst, analysts say, as refiners and grid suppliers convert scarcity...