
I sat down with Ed Yardeni and Kevin Mahn to discuss why the S&P 500 could be headed to 10,000 by 2030.
/Sign%20of%20Intel%20at%20entrance%20%20by%20michaelmond.jpeg)
Intel's improving data center business is giving investors another reason to stay bullish.
These ETFs may not be the best way to bet on chip stocks, but for traders, they are tools worth considering.
/A%20close-up%20of%20the%20Broadcom%20logo%20on%20a%20smartphone%20by%20Timon%20via%20Adobe%20Stock.jpeg)
Broadcom’s projected $200 billion Samsung partnership is less about size and more about securing the AI chip supply chain for years to come.
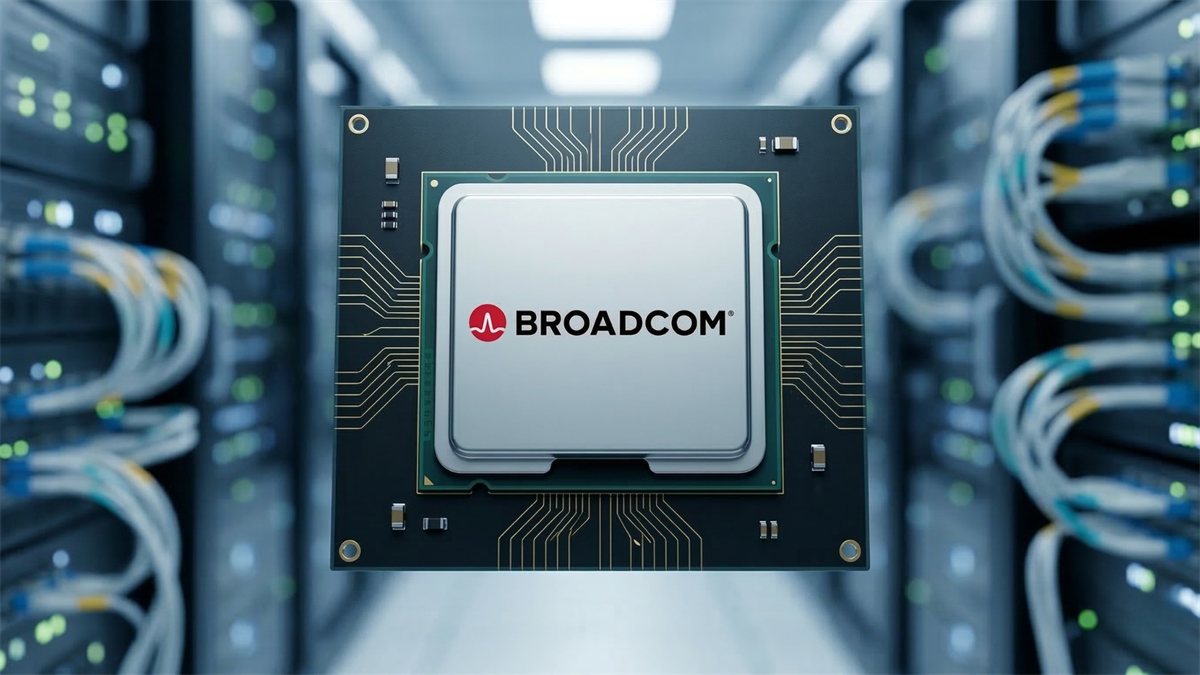
Broadcom and Samsung signed a five-year, $200 billion deal for memory chips, including HBM, and potential advanced packaging collaboration to support Broadcom's AI accelerator growth.
/Engineer%20in%20Sterile%20Coverall%20Holds%20Microchip%20with%20Gloves%20and%20Examines%20it%20by%20Gorodenkoff%20via%20Shutterstock.jpg)
Amkor just landed a $1.5 billion Nvidia partnership. So, should you buy, sell, or hold the stock now?
With this new deal running through 2030, how should investors approach AVGO?
/A%20close-up%20shot%20of%20the%20Taiwan%20Semi%20logo%20on%20a%20corporate%20building%20by%20Jack%20Hong%20via%20Shutterstock.jpg)
Taiwan Semiconductor (TSM) is showing unusually heavy call option volume today. Investors are earning high covered call yields, over 3.4% for the next month, by selling out-of-the-money calls.
/Semiconductor%20chip%20by%20Mykola%20Pokhodzhay%20via%20iStock.jpg)
Amkor posted its strongest quarter ever, but cautious guidance stole the spotlight from its AI-driven growth.

Meta Platforms is set to report second-quarter 2026 results on July 29 after raising its full-year capital expenditure outlook to $125 billion–$145 billion to fund expanded AI infrastructure, data centers,...