or
Faster, Cleaner, Better.

Lumber Physical Nov '24 (LBX24)

570.00s -20.00 (-3.39%) 11/15/24 [CME]
N/A x N/A N/A x N/A
underlying price ()
Quote Overview for Fri, Nov 15th, 2024
Day Low
545.50
Day High
570.00
Open 545.50
Previous Close 590.00 590.00
Volume 4 4
Open Interest 3 3
Stochastic %K 80.32% 80.32%
Weighted Alpha +1.18 +1.18
5-Day Change +11.50 (+2.06%) +11.50 (+2.06%)
52-Week Range 473.00 - 640.50 473.00 - 640.50
  • 1D
  • 5D
  • 1M
  • 3M
  • 6M
  • 1Y
  • 5Y
  • MAX
Full Chart
  • OHLC Bars
  • Colored OHLC Bars
  • HLC Bars
  • Candlestick Hollow
  • Candlestick Open-to-Close
  • Candlestick Close-to-Close
  • Heikin-Ashi
  • Line Chart
  • Area Chart
  • Renko
  • Column
  • Baseline
  • Line Break
  • Range
  • Kagi
  • Point And Figure

Contract Specifications

See More
Contract
Physically-Delivered Lumber
Contract Size
27,500 board foot
Tick Size
50 cents per thousand board feet ($13.75 per contract)
Trading Hours
9:00a.m. - 3:05p.m. CST
Exchange
CME
Point Value
$27.50
Margin/Maintenance
$1,210/1,100
First Notice Date
11/25/24
Expiration Date
11/15/24 (expired)

Seasonal Chart

Lumber Physical Nov '24
Average Price Chart for 5 Prior Nov Contracts

Commitment of Traders Positions as of Jul 8, 2025

View Chart Details
Commercials - Long / Short
2,592 (-556)
4,835 (-380)
Non-Commercials - Long / Short
3,375 (+568)
1,520 (+323)
Producers - Long / Short
2,262 (-552)
4,710 (-390)
Swap Dealers - Long / Short
330 (-2)
125 (+12)
Managed Money - Long / Short
1,202 (+611)
1,072 (+234)
Other Reportables - Long / Short
2,173 (-43)
448 (+89)
Get Realtime - Quotes and Charts for Futures Traders. Learn More >>

Price Performance

See More
Period Period Low Period High Performance
1-Month
516.00 +10.47%
on 10/17/24
Period Open: 529.50
600.00 -5.00%
on 11/14/24
+40.50 (+7.65%)
since 10/15/24
3-Month
495.00 +15.15%
on 09/13/24
Period Open: 540.00
600.00 -5.00%
on 11/14/24
+30.00 (+5.56%)
since 08/15/24
52-Week
473.00 +20.51%
on 07/16/24
Period Open: 573.50
640.50 -11.01%
on 03/12/24
-3.50 (-0.61%)
since 11/15/23

More Lumber Physical Quotes

All Futures Prices
Please wait...
Please wait...
false

Most Recent Stories

More News
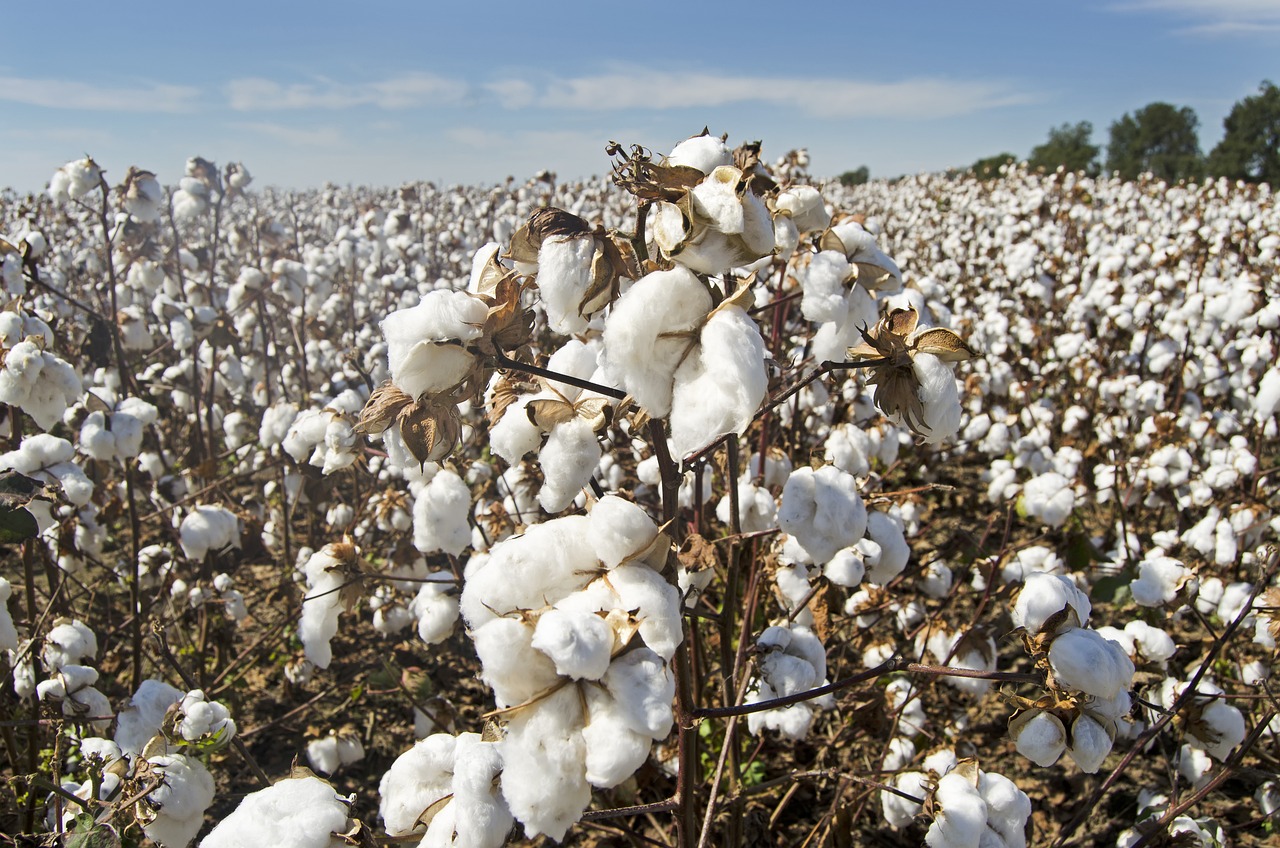
Cotton Pushes Losses into the Weekend

Cotton futures ended the Friday session with losses of 5 to 30 points, as December was down 104 on the week. Crude oil is up $2.10 /barrel at $68.67, with the US dollar index $0.233 higher to $97.555....

CTZ25 : 67.42s (-0.46%)
CTV25 : 66.20s (-0.08%)
CTZ24 : 71.40s (-1.37%)
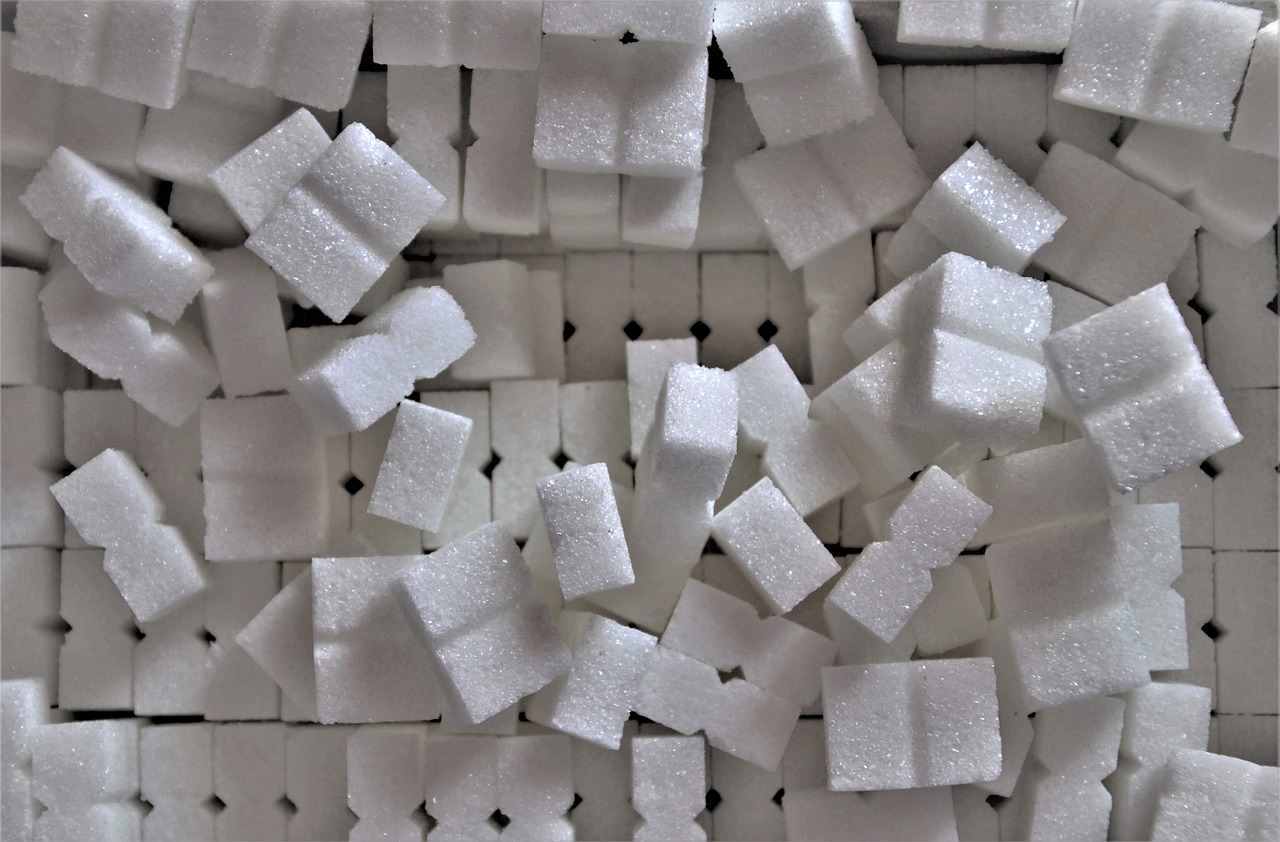
Sugar Prices Rally on Strength in Crude Oil Prices

October NY world sugar #11 (SBV25 ) on Friday closed up +0.31 (+1.91%), and August London ICE white sugar #5 (SWQ25 ) closed up +1.20 (+0.25%). Sugar prices were boosted by Friday's sharp rally of more...

CLQ25 : 68.45s (+2.82%)
SBV25 : 16.57s (+1.91%)
SWV25 : 479.20s (+1.48%)
Plus500 Makes Futures Trading Truly Accessible: Low Margins and Up to $200 in a Commission-Free Bonus!

Trade the most popular US futures of 2025: Agricultural Commodities, Indices, Crypto, Metals, Forex, and more! Join over 30 million people worldwide who trust Plus500. Start trading today with a deposit as low as $100!

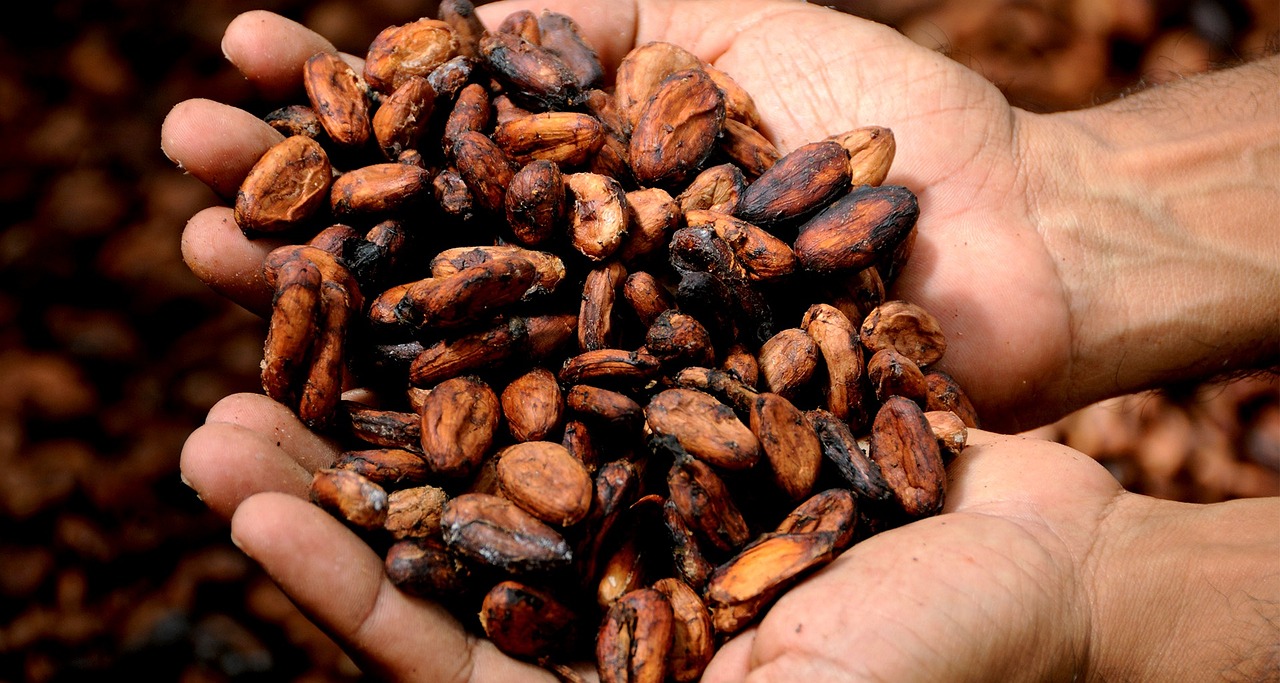
NY Cocoa Rises on Pre-Weekend Short Covering

September ICE NY cocoa (CCU25 ) on Friday closed up +118 (+1.46%), and September ICE London cocoa #7 (CAU25 ) closed down -5 (-0.09%) Cocoa prices on Friday closed mixed, with London cocoa posting an 8.5-month...

CCU25 : 8,177s (+1.46%)
CAZ25 : 5,237s (+0.29%)
Coffee Prices Resume Weakness on Harvest Pressure Despite US Tariff Threats to Brazil

September arabica coffee (KCU25 ) on Friday closed down -1.30 (-0.45%), and September ICE robusta coffee (RMU25 ) closed down -104 (-3.13%). Coffee prices on Friday fell, with robusta coffee slumping to...

RMU25 : 3,216s (-3.13%)
KCU25 : 286.50s (-0.45%)
Cotton Leaking Lower Following USDA Production Increase

Cotton prices are trading with losses of 20 to 50 points so far on Friday trade. Crude oil is up $1.88/barrel at $68.45, with the US dollar index $0.193 higher to $97.515. The monthly update to the USDA...

CTZ25 : 67.42s (-0.46%)
CTV25 : 66.20s (-0.08%)
CTZ24 : 71.40s (-1.37%)
Crude Oil Strength Lifts Sugar Prices

October NY world sugar #11 (SBV25 ) today is up +0.24 (+1.48%), and August London ICE white sugar #5 (SWQ25 ) is up +6.30 (+1.31%). Sugar prices are moving higher today as a sharp +2% rally in WTI crude...

CLQ25 : 68.45s (+2.82%)
SBV25 : 16.57s (+1.91%)
SWV25 : 479.20s (+1.48%)
Cocoa Prices Mixed on Pre-Weekend Short Covering

September ICE NY cocoa (CCU25 ) today is up +61 (+0.76%), and September ICE London cocoa #7 (CAU25 ) is down -38 (-0.72%) Cocoa prices today are mixed, with London cocoa posting an 8.5-month low. Cocoa...

CCU25 : 8,177s (+1.46%)
CAZ25 : 5,237s (+0.29%)
Q2 in Soft Commodities- Where are They Heading in Q3 and Beyond?

Soft commodities were on bullish fire in 2023 and 2024, but the prices reached levels where they ran out of upside steam. After rising to record highs, Arabica coffee, cocoa, and frozen concentrated orange...

KCU25 : 286.50s (-0.45%)
OJU25 : 288.85s (+9.48%)
CCU25 : 8,177s (+1.46%)
SBV25 : 16.57s (+1.91%)
CTZ25 : 67.42s (-0.46%)
US Tariff Threat on Imports from Brazil Underpins Arabica Coffee Prices

September arabica coffee (KCU25 ) today is up +0.70 (+0.24%), and September ICE robusta coffee (RMU25 ) is down -74 (-2.23%). Coffee prices today are mixed, with arabica coffee posting a 1.5-week high...

RMU25 : 3,216s (-3.13%)
KCU25 : 286.50s (-0.45%)

Barchart Trading Guide

The Barchart Trading Guide is a Buy Signal with a Maximum Signal Strength.

Key Turning Points

3rd Resistance Point 602.67
2nd Resistance Point 586.33
1st Resistance Point 578.17
Last Price 570.00s
1st Support Level 553.67
2nd Support Level 537.33
3rd Support Level 529.17

See More

52-Week High 640.50
Fibonacci 61.8% 576.51
Last Price 570.00s
Fibonacci 50% 556.75
Fibonacci 38.2% 536.98
52-Week Low 473.00

See More

Solutions for Ag Professionals barchart.com/cmdty
Data and Statistics for Coffee and Cotton
Explore Data
cmdtyView Pro for Ag Professionals
Start Free Trial
We help Commodity Professionals make better decisions
Learn Now
Want to use this as
your default charts setting?
Save this setup as a Chart Templates
Switch the Market flag
for targeted data from your country of choice.
Open the menu and switch the
Market flag for targeted data from your country of choice.
Want Streaming Chart Updates?
Switch your Site Preferences
to use Interactive Charts
Need More Chart Options?
Right-click on the chart to open the Interactive Chart menu.
Use your up/down arrows to move through the symbols.
Free Barchart Webinar
3 Explosive Trends for 2025 You Can't Afford to Miss