[[ type === 'moc' ? 'MARKET ON CLOSE' : 'FREE WEBINAR' ]]
[[ timeLabel ]] WATCH LIVE:
Your browser of choice has not been tested for use with Barchart.com. If you have issues, please download one of the browsers listed here.
Stocks | Futures | Watchlist | News | More
or
Faster, Cleaner, Better.

Soybean Oil May '22 (ZLK22)

[[ item.lastPrice ]] [[ item.priceChange ]] ([[ item.percentChange ]]) [[ item.tradeTime ]] [CBOT]
[[ item.bidPrice ]] x [[ item.bidSize ]] [[ item.askPrice ]] x [[ item.askSize ]]
[[ rootItem.symbol ]]underlying price [[ rootItem.lastPrice ]] [[ rootItem.priceChange ]] ([[ rootItem.percentChange ]]) [[ rootItem.tradeTime ]]
News & Headlines for [[ item.sessionDateDisplayLong ]]
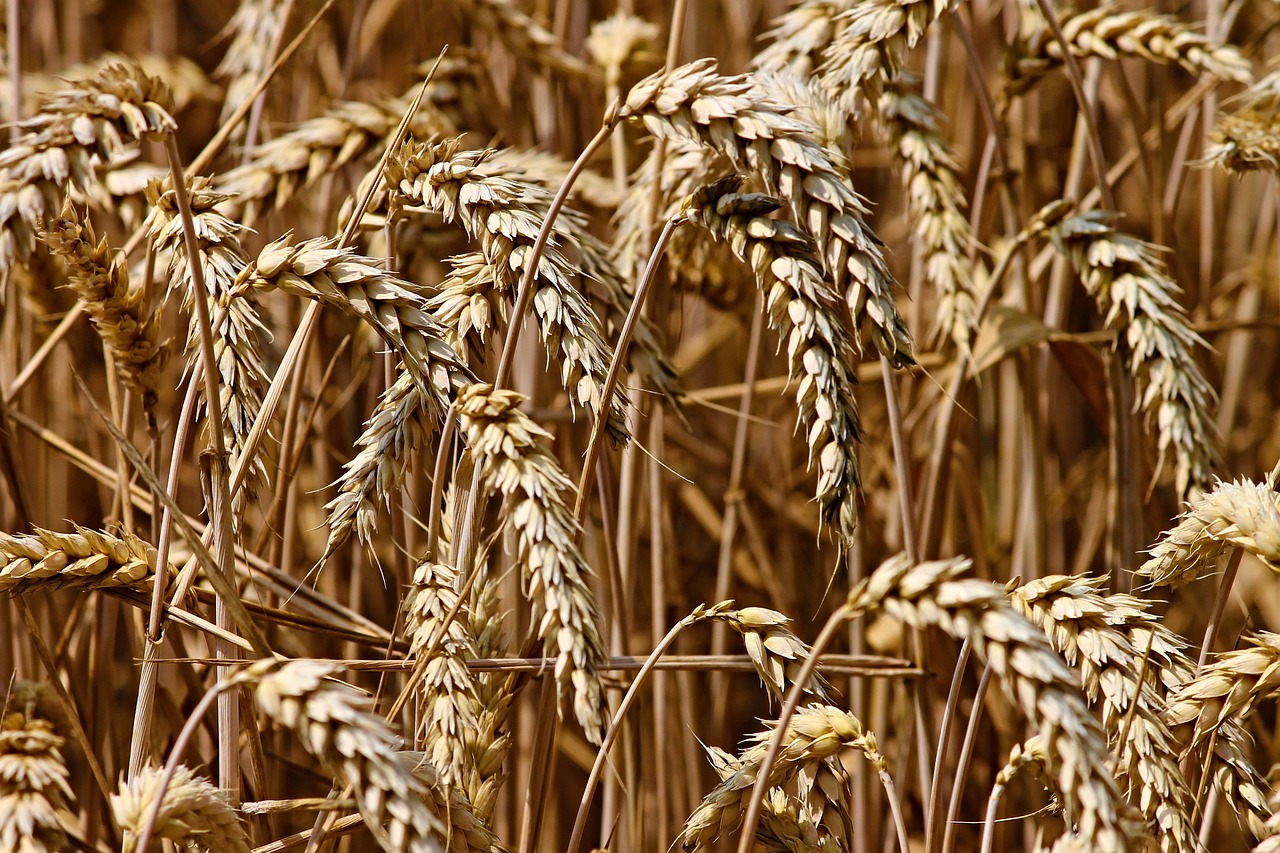
Wheat Prices Are Headed Higher: Buy December SRW Wheat Here

December soft red winter wheat futures present a buying opportunity on more price strength.

ZWZ26 : 688-4 (-0.15%)
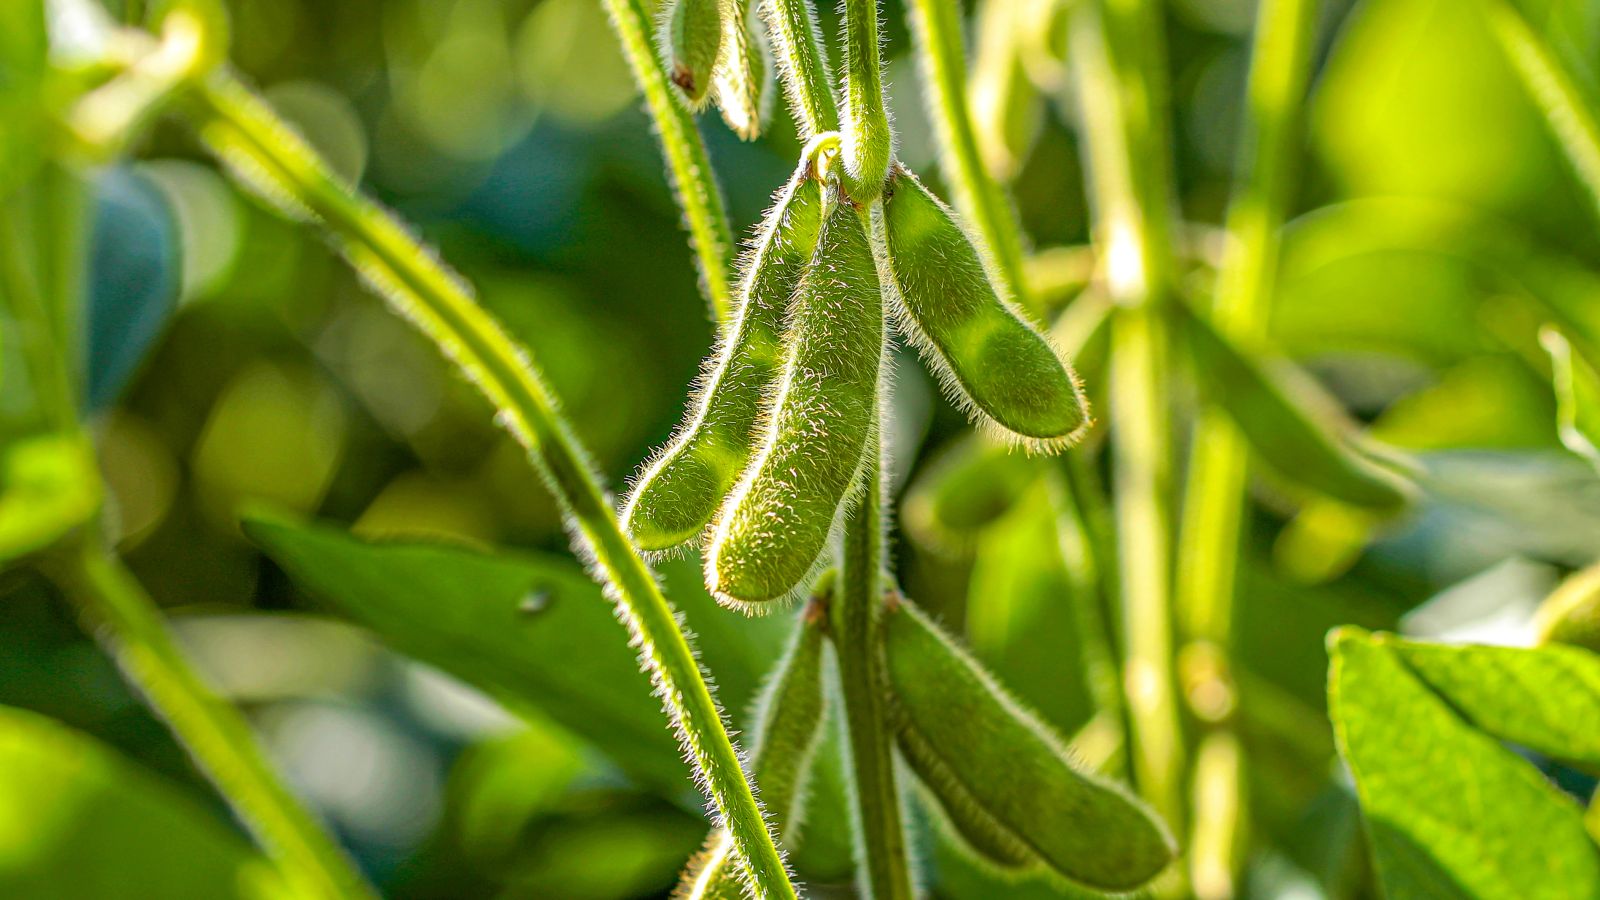
Corn Holding Higher on Monday AM Trade

Corn price action is up 1 ¾ to 2 ¼ cents in the front months so far on Monday morning. Futures rounded out the week in rally mode, as contracts were up 5 to 11 ¼ cents across the board on Friday September...
ZCZ26 : 488-2 (+1.03%)
ZCU26 : 463-4 (+0.98%)
ZCPZ26US.CM : 4.5415 (+1.15%)
ZCPAUS.CM : 4.3469 (+1.08%)
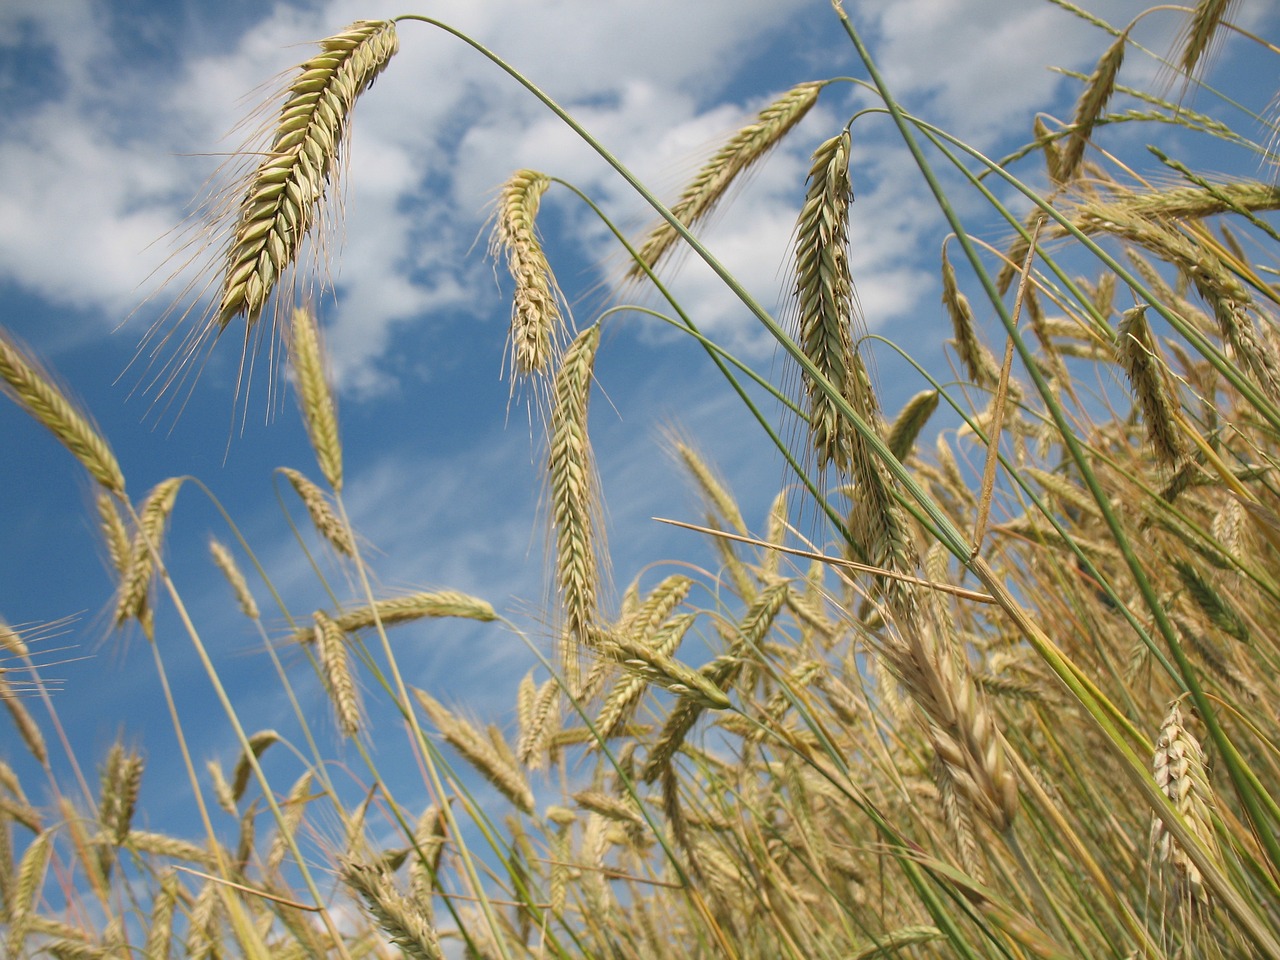
Soybeans Popping Higher on Monday Morning

Soybeans are trading with 4 to 5 cent gains so far on Monday AM trade. Futures posted gains of 5 ½ to 11 ¾ cents across most contracts on Friday, with September up 18 ¾ cents on the week. November was...
ZSPAUS.CM : 11.6733 (+1.40%)
ZLZ26 : 70.01 (+1.51%)
ZMZ26 : 319.5 (+1.01%)
ZSPX26US.CM : 11.5089 (+1.45%)
ZSX26 : 1209-0 (+1.38%)
ZSU26 : 1194-2 (+1.40%)
ZSX26 : 1209-0 (+1.38%)
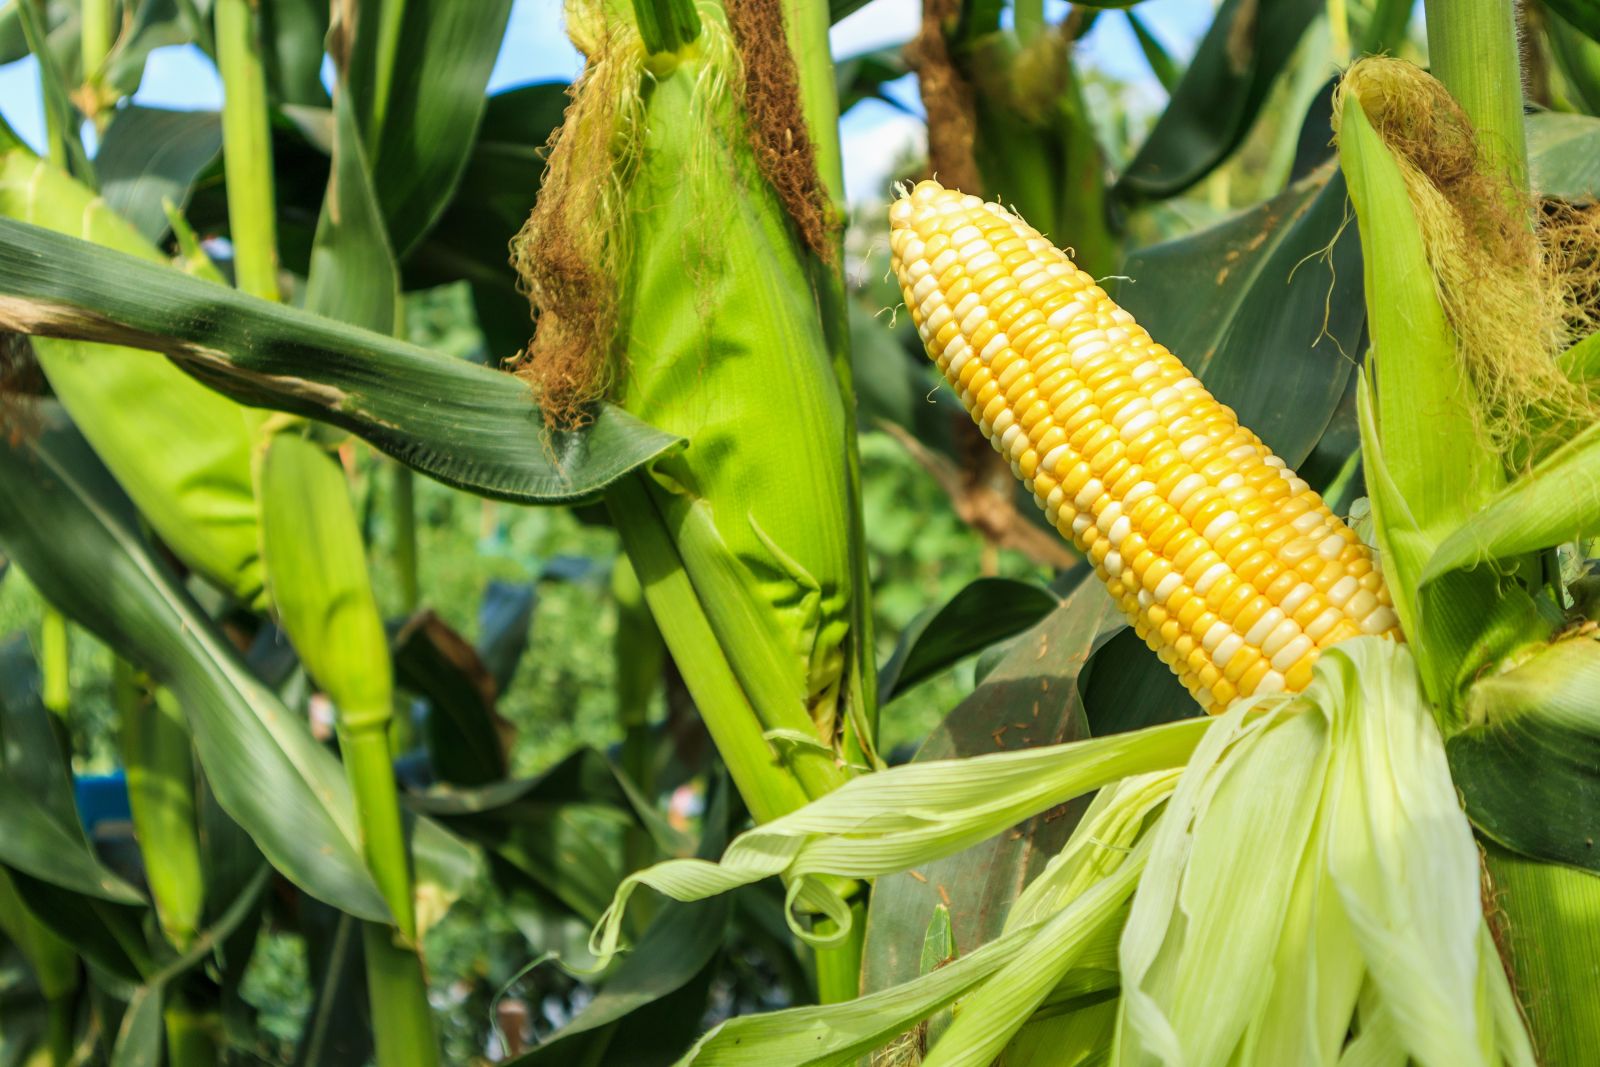
Wheat Falling Back Early on Monday

Wheat is slipping lower across the winter wheat contracts on Monday morning. The wheat complex led the grain rally on Friday, following more Black Sea news. Chicago SRW contracts were up 11 3/4 to 22 cents...

KEZ26 : 767-4 (-0.03%)
KEU26 : 754-0 (-0.03%)
MWU26 : 6.7625 (-0.29%)
ZWU26 : 673-6 (-0.15%)
ZWZ26 : 688-4 (-0.15%)
Why Is This Monday Morning Different in the Commodity Complex?

The usual Monday morning headlines mixed with the annual Midwest Crop Tour garnered most of the attention early Monday morning.

WRT World Agricultural Supply and Demand August 16

Grain + Cotton Fundamentals

Soybean Analysis & Targets

Educational and Actionable information using Fibonacci and W.D. Gann analysis.
ZSU26 : 1194-2 (+1.40%)
Cattle Markets Crash as Plant Shutdowns Pressure Sentiment

Tyson to shutdown two plants and sell another

Building Better Commodity Spreads – Part 5: When History Meets Today: Why Forward Curves Matter

Historical seasonality is only part of the equation. In Part 5 of the Building Better Commodity Spreads series, we explore how forward-curve analysis helps determine whether today's market supports a historical...

USDA reports and Black Sea escalation spark grains

Cattle-on-Feed next Friday

Barchart Exclusives

Fortinet Stock Is Still a Buy After Hitting New All-Time Highs
Fortinet (FTNT) demonstrates strong momentum, with a 98% gain over the past year. FTNT is projected to grow revenue 19.41% this year and 10.97% next year, with earnings expected to rise 25.02% and 8.95%, respectively. Analyst sentiment is broadly positive with price targets ranging from $102 to $220. Technical indicators... Read more

Barchart Grains News

Soybeans Popping Higher on Monday Morning
Soybeans are trading with 4 to 5 cent gains so far on Monday AM trade. Futures posted gains of 5 ½ to 11 ¾ cents across most contracts on Friday, with September up 18 ¾ cents on the week. November was up 16 ¼ cents. Open interest was down 453... Read more
Want to use this as
your default charts setting?
Save this setup as a Chart Templates
Switch the Market flag
for targeted data from your country of choice.
Open the menu and switch the
Market flag for targeted data from your country of choice.
Want Streaming Chart Updates?
Switch your Site Preferences
to use Interactive Charts
Need More Chart Options?
Right-click on the chart to open the Interactive Chart menu.
Use your up/down arrows to move through the symbols.