[[ type === 'moc' ? 'MARKET ON CLOSE' : 'FREE WEBINAR' ]]
[[ timeLabel ]] WATCH LIVE:
Your browser of choice has not been tested for use with Barchart.com. If you have issues, please download one of the browsers listed here.
Stocks | Futures | Watchlist | News | More
or
Faster, Cleaner, Better.

Gulf Coast No. 6 Fuel Oil 3.0% Platts Futures Dec '20 (JMFZ20)

[[ item.lastPrice ]] [[ item.priceChange ]] ([[ item.percentChange ]]) [[ item.tradeTime ]] [NYMEX]
[[ item.bidPrice ]] x [[ item.bidSize ]] [[ item.askPrice ]] x [[ item.askSize ]]
[[ rootItem.symbol ]]underlying price [[ rootItem.lastPrice ]] [[ rootItem.priceChange ]] ([[ rootItem.percentChange ]]) [[ rootItem.tradeTime ]]
News & Headlines for [[ item.sessionDateDisplayLong ]]
Grain Spreads: Gap Hunting in Soybeans

New Crop Speculation

Ahead of Walmart Earnings, Here Is What Barchart Options Data Shows for WMT Stock

Walmart shares have been on a run heading into the company’s Q1 earnings on May 20. But options data suggests WMT stock will push further up after the quarterly print.

TGT : 127.24 (+3.11%)
WMT : 134.20 (+0.64%)
Trade headlines subsided, and prices followed. What's next?

Grain markets saw follow-through strength in the early morning trade but fizzled into the afternoon. What's next for prices?

Stocks Settle Lower on Rising Bond Yields

The S&P 500 Index ($SPX ) (SPY ) on Tuesday closed down -0.67%, the Dow Jones Industrial Average ($DOWI ) (DIA ) closed down -0.65%, and the Nasdaq 100 Index ($IUXX ) (QQQ ) closed down -0.61%. June E-mini...

ALK : 36.21 (-3.08%)
HL : 16.36 (-5.21%)
SNDK : 1,383.29 (+3.77%)
CDE : 16.76 (-4.23%)
ADI : 414.31 (-1.02%)
STUB : 9.54 (+2.25%)
DASH : 154.65 (-4.93%)
CIEN : 541.92 (+3.32%)
CRWV : 99.81 (-3.82%)
STX : 733.35 (-1.01%)
AMD : 414.05 (-1.65%)
SCCO : 169.00 (-1.69%)
SoftBank Just Dumped Circle Stock. Don’t Panic and Keep Adding CRCL Here.

SoftBank fully exited Circle Internet Group in Q1 2026. Here is what investors need to know about the stablecoin giant's fundamentals.

TMUS : 193.42 (+1.45%)
BLK : 1,036.30 (-4.57%)
META : 602.61 (-1.41%)
LMND : 53.97 (-0.94%)
CRCL : 111.03 (-0.32%)
SFTBY : 17.2600 (N/A)
NMRA : 1.6700 (-5.65%)
ICE : 154.11 (-1.21%)
^USDCUSD : 0.999980 (+0.01%)
UBER : 74.09 (-1.32%)
DASH : 154.65 (-4.93%)
LIFE : 19.08 (-7.92%)
Dollar Rallies and Gold Falls as T-note Yields Climb

The dollar index (DXY00 ) on Tuesday rallied to a 6-week high, finishing up by 0.14%. The dollar moved higher on Tuesday as higher T-note yields are strengthening the dollar’s interest rate differentials....

DXY00 : 99.321 (+0.13%)
GCM26 : 4,485.4 (-1.59%)
SIN26 : 73.970 (-4.49%)
^USDJPY : 159.051 (-0.02%)
^EURUSD : 1.16039 (-0.02%)
Crude Oil Prices Slip on Diplomatic Hopes to End Iran War

June WTI crude oil (CLM26 ) on Tuesday closed down -0.89 (-0.82%), and June RBOB gasoline (RBM26 ) closed down -0.0645 (-1.72%). Crude oil and gasoline prices retreated on Tuesday after the dollar index...

CLN26 : 104.03 (-0.34%)
RBN26 : 3.5541 (-1.86%)
$DXY : 99.32 (+0.13%)
What is Backwardation in the Crude Oil Futures Market Telling Us?

Crude oil remains in focus after events in the Middle East caused its price to double. Crude oil prices have declined from their recent high, but the jury is still out on whether they are heading for a...

QAN26 : 111.00 (-0.98%)
CLM26 : 108.37 (-0.27%)
Shootin' the Bull about an odd day

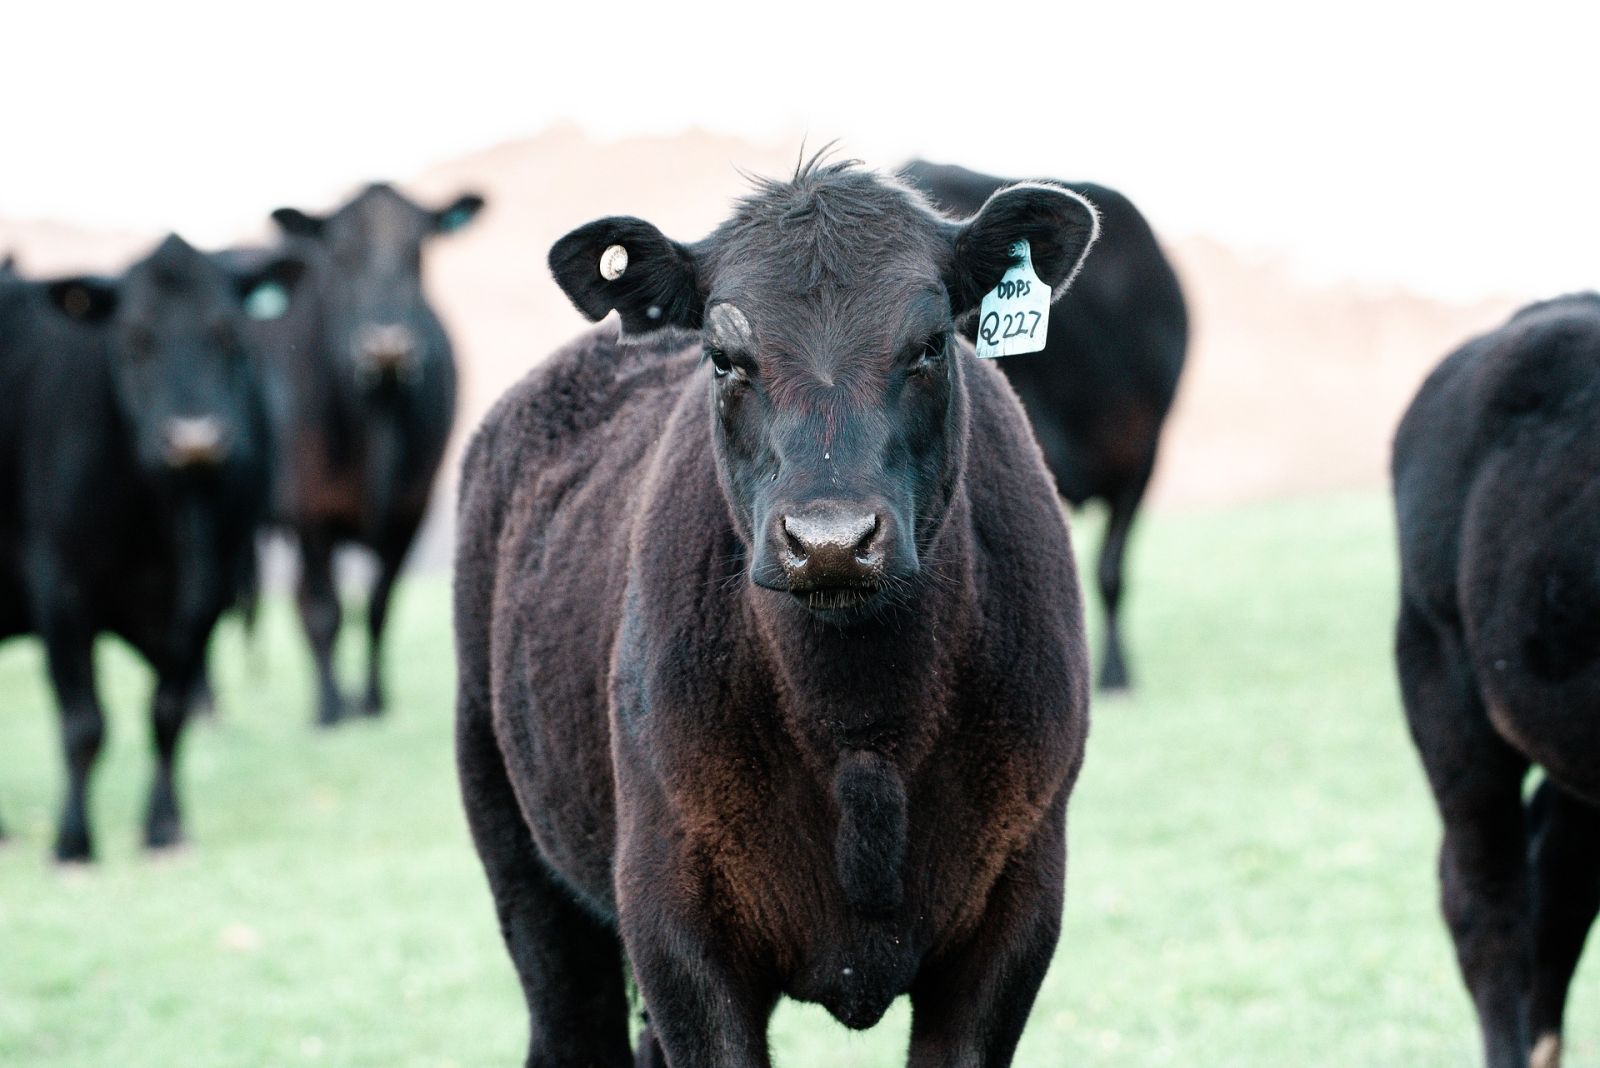
Kind of an odd day of trading where cattle feeders just took it on the chin if placing cattle today.

Barchart Exclusives

IBM Stock Leads Mega-Cap Stock Decliners as Market Volatility Triggers Steep Selloff. That Doesn’t Tell You the Whole Story.
IBM stock has shed 25% in 2026, topping mega-cap decliners. Strong earnings haven't stopped the slide. Here's what investors need to know. Read more
Want to use this as
your default charts setting?
Save this setup as a Chart Templates
Switch the Market flag
for targeted data from your country of choice.
Open the menu and switch the
Market flag for targeted data from your country of choice.
Want Streaming Chart Updates?
Switch your Site Preferences
to use Interactive Charts
Need More Chart Options?
Right-click on the chart to open the Interactive Chart menu.
Use your up/down arrows to move through the symbols.