[[ type === 'moc' ? 'MARKET ON CLOSE' : 'FREE WEBINAR' ]]
[[ timeLabel ]] WATCH LIVE:
Your browser of choice has not been tested for use with Barchart.com. If you have issues, please download one of the browsers listed here.
Stocks | Futures | Watchlist | News | More
or
Faster, Cleaner, Better.

Dated-to-Frontline Brent Swap Futures Mar '18 (JFYH18)

[[ item.lastPrice ]] [[ item.priceChange ]] ([[ item.percentChange ]]) [[ item.tradeTime ]] [NYMEX]
[[ item.bidPrice ]] x [[ item.bidSize ]] [[ item.askPrice ]] x [[ item.askSize ]]
[[ rootItem.symbol ]]underlying price [[ rootItem.lastPrice ]] [[ rootItem.priceChange ]] ([[ rootItem.percentChange ]]) [[ rootItem.tradeTime ]]
Quote Overview for [[ item.sessionDateDisplayLong ]]
[[ rowChartData.labelLow ]]
[[ rowChartData.lowPriceFormatted ]]
[[ rowChartData.lowPrice ]]
[[ rowChartData.labelHigh ]]
[[ rowChartData.highPriceFormatted ]]
[[ rowChartData.highPrice ]]
since [[ rowChartData.lowDate ]]
since [[ rowChartData.highDate ]]
[[ value ]] [[ value ]] ([[ financialData.relativeStrengthDirection14d ]]) ([[ financialData.highPercent1y ]]) ([[ financialData.lowPercent1y ]])

Contract Specifications

See More
Contract
N/A
Contract Size
N/A
Tick Size
N/A
Trading Hours
N/A
Exchange
NYMEX
Point Value
$100
Expiration Date
04/03/18 (expired)
Get Realtime - Quotes and Charts for Futures Traders. Learn More >>

More Dated-to-Frontline Brent Swap Futures Quotes

All Futures Prices
Please wait...

Most Recent Stories

More News
Amazon's Massive Capex Spending Reduces FCF to a Trickle - But Does the Market Care?

Amazon produced just $1.232 billion in free cash flow on a trailing 12-month basis in Q1. That's barely 0.17% of its TTM sales, despite a 19.8% operating cash flow margin. But does the market care?

AMZN : 268.26 (+1.21%)
Sell in May and Go Away? Here's What the Stats Say.

Long-term historical data points to the May-October period as lousy for stocks. But that hardly tells the whole story.

Two Setups, One Framework: What eBay and Teva Reveal About Trade Selection

eBay and Teva represent two distinct paths to opportunity—steady trend continuation and a breakout from consolidation. Both illustrate how aligning structure with strategy can improve outcomes in options...

Cattle, wheat, corn, soybeans, crude and S&P surge to new highs

Historic dissents in Fed interest rate pause

These Are April's 2 Hottest AI Stocks. Should You Buy Them in May?

These AI winners surged in April, but upcoming earnings will decide if their rally has more room to run.

META : 608.74 (-0.52%)
NVDA : 198.45 (-0.56%)
ANET : 172.70 (-0.01%)
$NASX : 25,114.44 (+0.89%)
AVGO : 421.28 (+0.92%)
$SPX : 7,230.12 (+0.29%)
INTC : 99.62 (+5.44%)
AMD : 360.54 (+1.71%)
HPE : 28.57 (-0.70%)
ARM : 211.18 (+0.41%)
What Happens When Seasonality and Geopolitics Collide?

Markets don’t always follow their seasonal patterns—especially during geopolitical events. This analysis of RBOB gasoline shows how conflicts can temporarily distort price action, and why structure...

Why a Small Portfolio Outperformed a Larger One — And What It Revealed About Options Income

Two portfolios using the same strategy delivered different results. The reason wasn’t stock selection or timing—it was how close the call strikes were to the stock price. This analysis shows how a...

Soybeans Rounds Out the Week with Strength

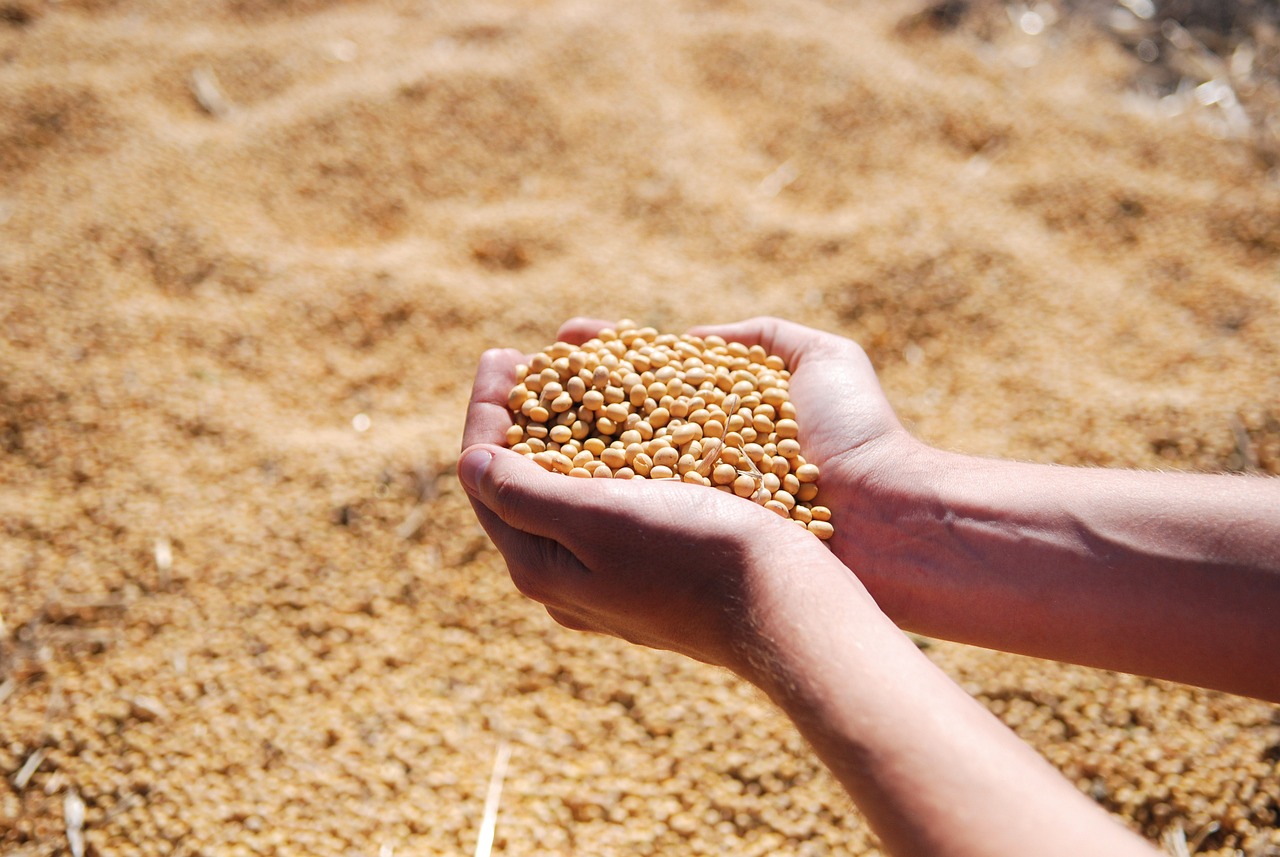
Soybeans futures closed the Friday session with 5 ¾ to 12 ¾ cent gains, as May was 24 cents higher this week. November was up 27 cents on the week. The cmdtyView national average Cash Bean price was...

ZSPAUS.CM : 11.3673 (+1.20%)
ZLN26 : 75.16s (+0.83%)
ZMN26 : 319.3s (+0.13%)
ZSPX26US.CM : 11.1800 (+1.14%)
ZSX26 : 1182-6s (+0.83%)
ZSK26 : 1187-6s (+0.49%)
ZSN26 : 1203-2s (+0.65%)
Cotton Extends Rally on Friday

Cotton futures closed the Friday session with contracts up 89 to 199 points higher, as July was up 483 points for the week. December was up 398 points. The US dollar index was $0.146 higher at $98.065....

CTN26 : 84.19s (+2.42%)
CTK26 : 81.85s (+2.49%)
CTZ26 : 84.56s (+2.04%)
Hogs Faces Pressure on Friday

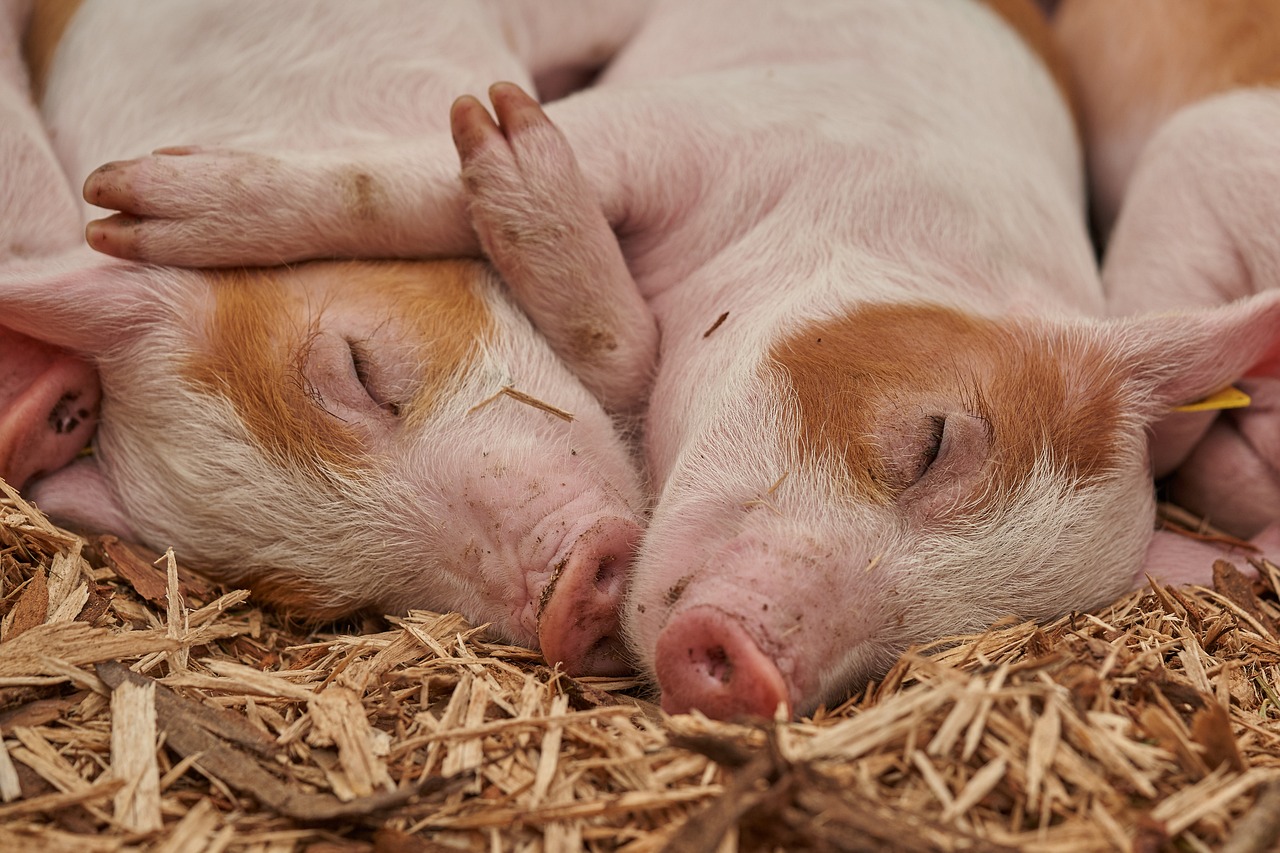
Lean hog futures posted losses of 62 cents to $1.67 at the Friday close, with June slipping 62 cents on the week. USDA’s national base hog price was reported at $92.64 on Friday morning, down 61 cents...

HEM26 : 101.275s (-0.98%)
HEK26 : 92.825s (-0.67%)
HEN26 : 103.375s (-1.59%)

Key Turning Points

3rd Resistance Point N/A
2nd Resistance Point N/A
1st Resistance Point N/A
Last Price N/A
1st Support Level N/A
2nd Support Level N/A
3rd Support Level N/A

See More

52-Week High 0.00
Fibonacci 61.8% N/A
Fibonacci 50% N/A
Fibonacci 38.2% N/A
52-Week Low 0.00

See More

Want to use this as
your default charts setting?
Save this setup as a Chart Templates
Switch the Market flag
for targeted data from your country of choice.
Open the menu and switch the
Market flag for targeted data from your country of choice.
Want Streaming Chart Updates?
Switch your Site Preferences
to use Interactive Charts
Need More Chart Options?
Right-click on the chart to open the Interactive Chart menu.
Use your up/down arrows to move through the symbols.