Contract Specifications
See MoreContract
N/A
Contract Size
N/A
Tick Size
N/A
Trading Hours
N/A
Exchange
MIAX Ag
Point Value
N/A
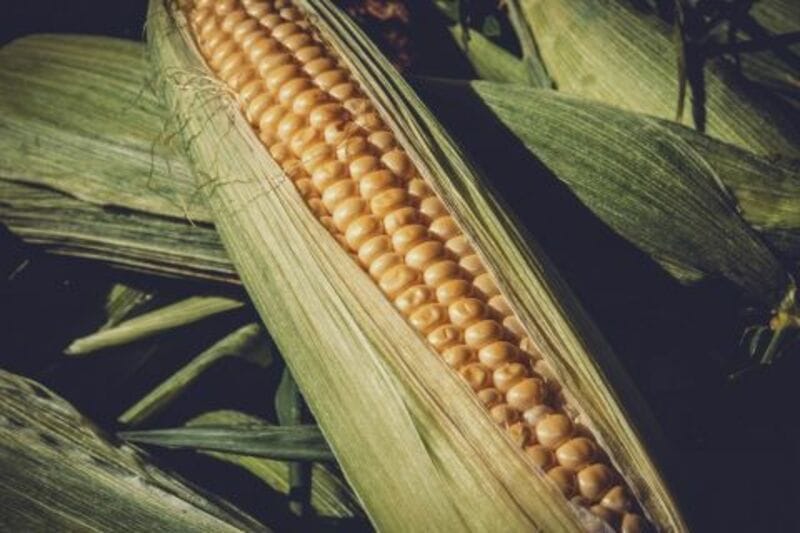
Corn futures slipped into the Monday close as contracts were mostly 1 ½ to 2 ¾ cents higher. July was down ¼ cent. The CmdtyView national average Cash Corn price as 1 1/2 cents higher at $4.10. The...
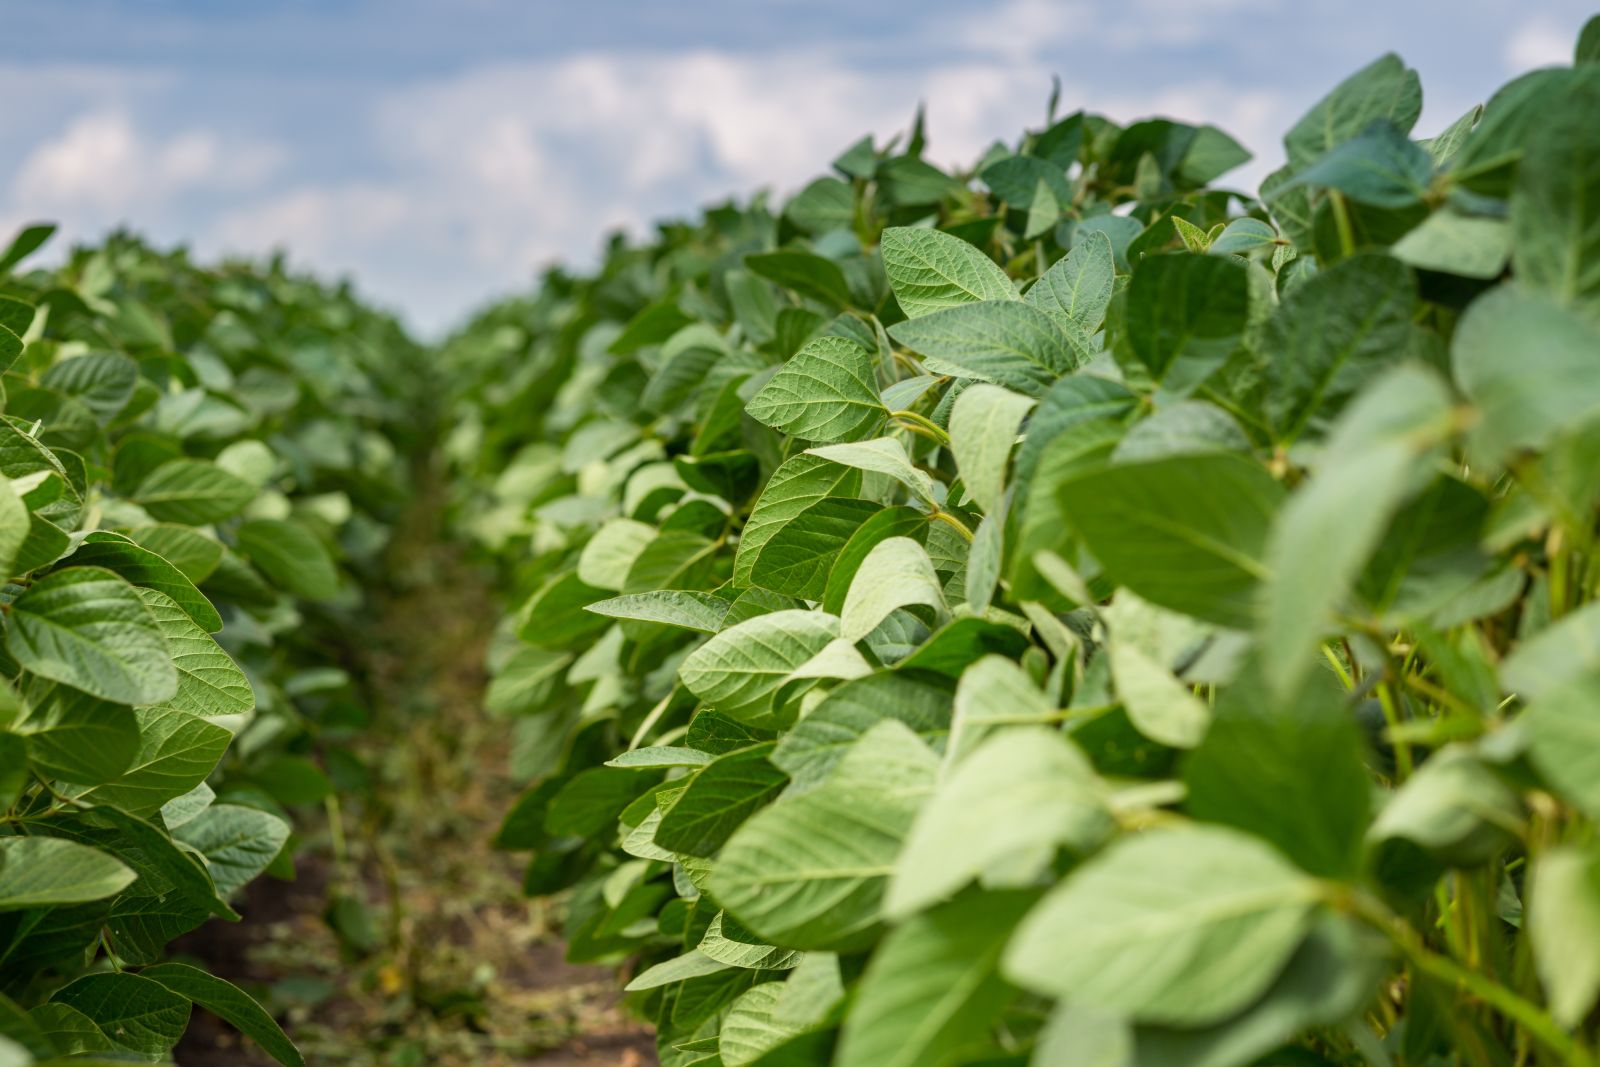
Soybeans closed with Monday gains of 4 to 5 ½ vents. The cmdtyView national average Cash Bean price was up a nickel at $11.50 3/4. Soymeal futures were down $3.20 to $6.30, with Soy Oil futures 148 to...

The wheat complex was lower across the three exchanges. Chicago SRW contracts were fractionally to 5 cents lower on the day. KC HRW futures were down 4 ¼ to 10 cents at the close. MPLS spring wheat was...
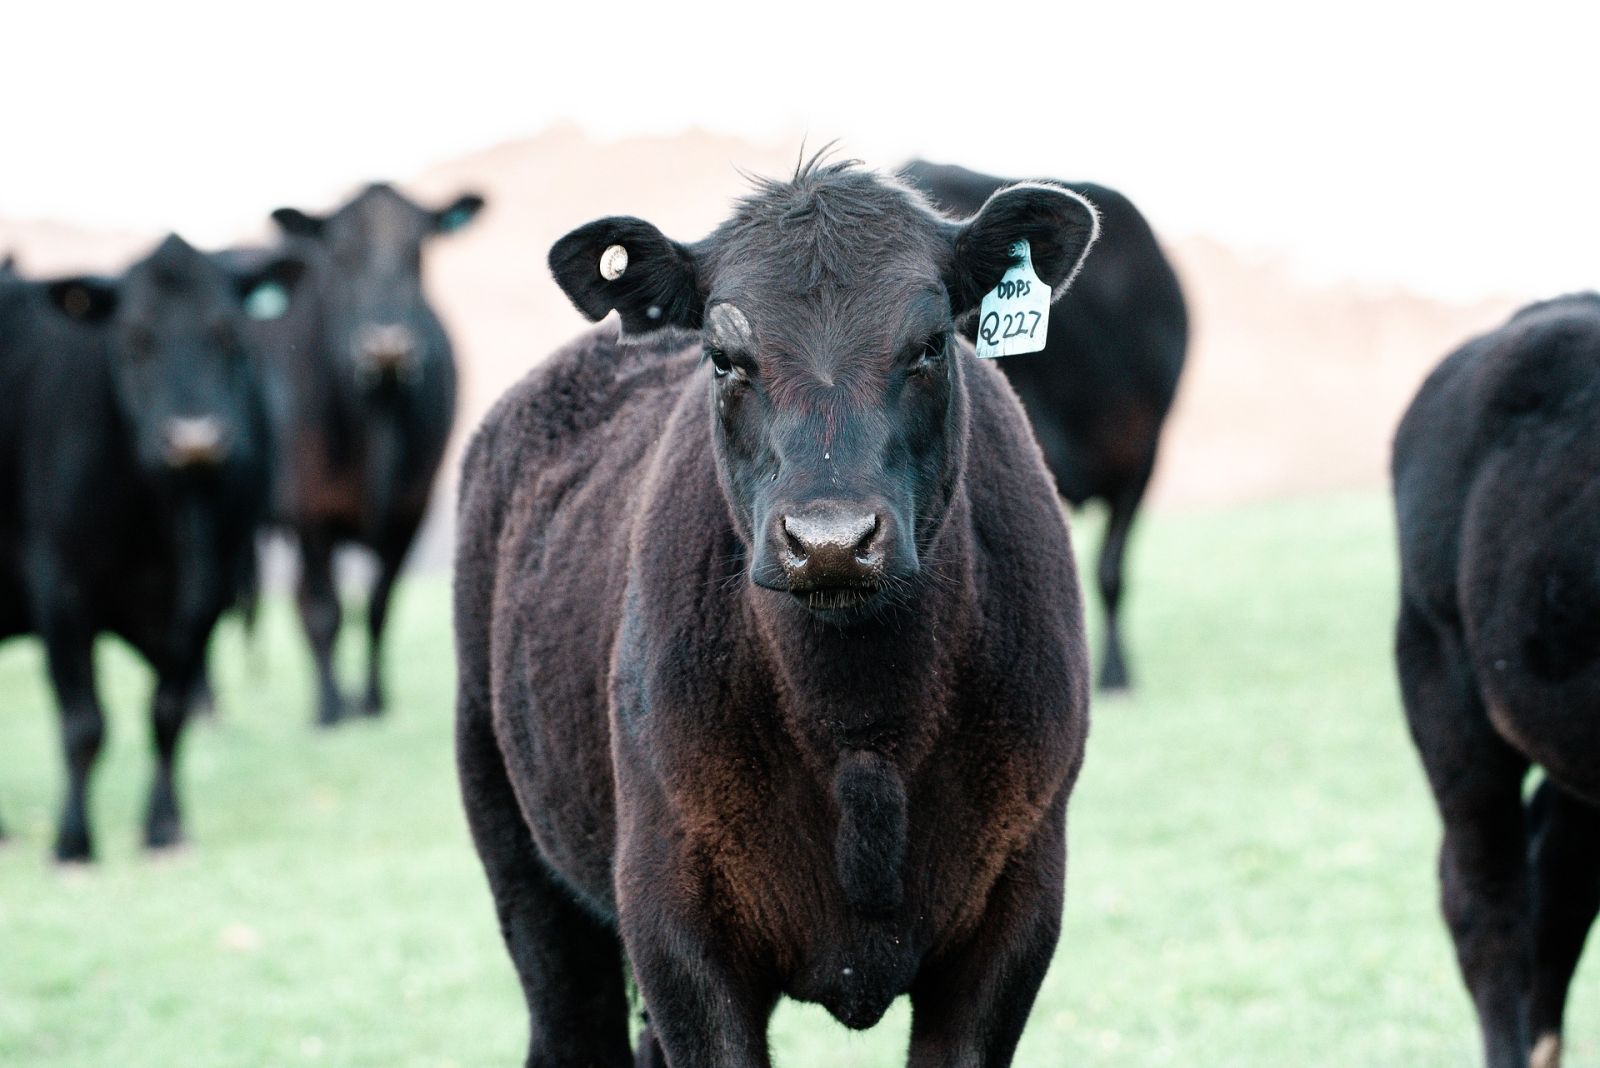
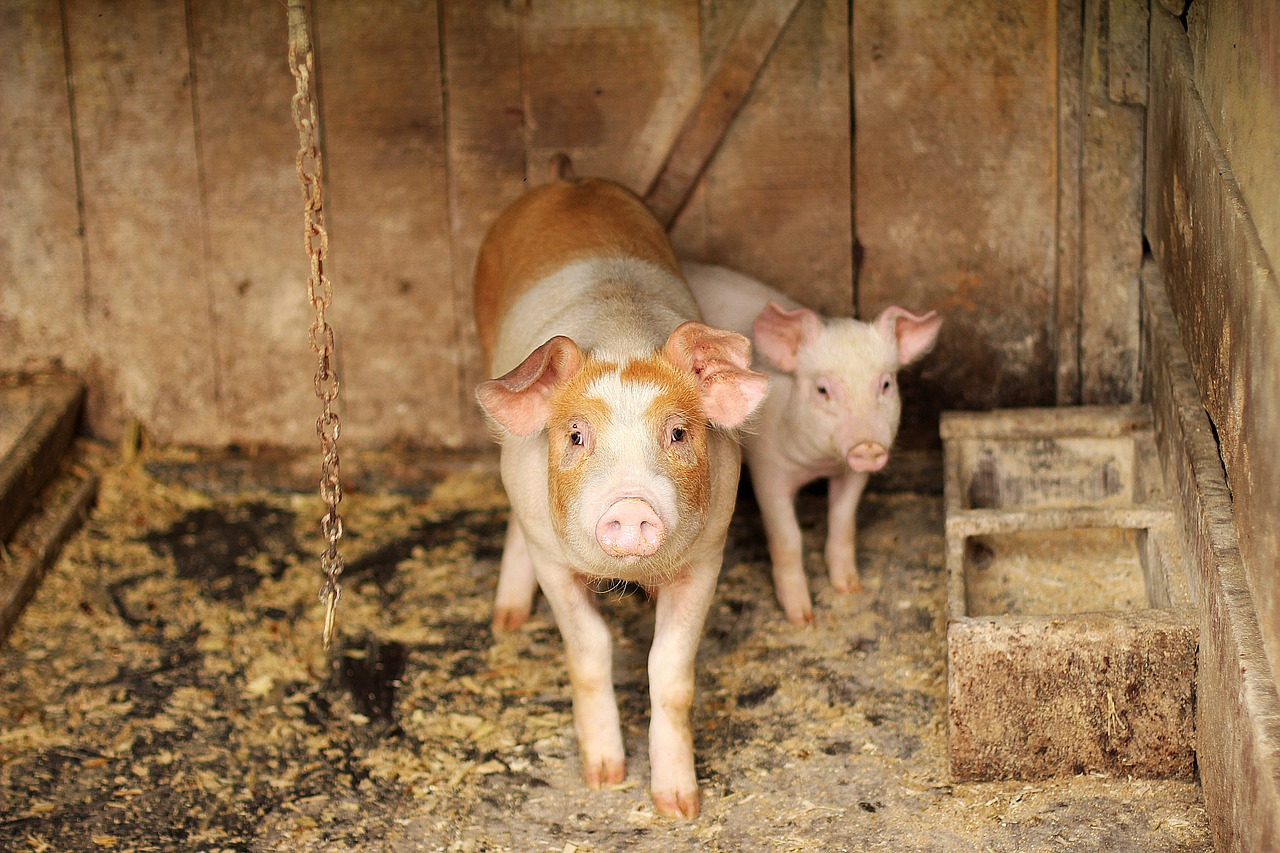
The focus is on the December and February fat cattle. Currently, they will be the most expensive inventory ever placed to date.
Crop Progress - 2026-07-13

Heat waves in the U.S. and Europe are hitting grains.

Soybeans are trading with midday gains of 7 to 11 ½ cents so far. The cmdtyView national average Cash Bean price is up 9 1/2 cents at $11.54 1/4. Soymeal futures are down $2.30, with Soy Oil futures 248...
Corn futures are holding onto the overnight gains at Monday’s midday, with contracts up 4 to 5 cents so far. The CmdtyView national average Cash Corn price is 4 cents higher at $4.12 1/2. Updated forecasts...
The wheat complex is mostly lower across the three exchanges. Chicago SRW contracts are down 2 to 3 cents on the day. KC HRW futures are down 7 to 8 1/2 cents at the midday part of the session. MPLS spring...