Your browser of choice has not been tested for use with Barchart.com. If you have issues, please download one of the browsers listed here.
Stocks | Futures | Watchlist | News | More
or

S&P 500 Cons Disc Jun '19 (BIM19)

[[ item.lastPrice ]] [[ item.priceChange ]] ([[ item.percentChange ]]) [[ item.tradeTime ]] [CME]
[[ item.bidPrice ]] x [[ item.bidSize ]] [[ item.askPrice ]] x [[ item.askSize ]]
[[ rootItem.symbol ]]underlying price [[ rootItem.lastPrice ]] [[ rootItem.priceChange ]] ([[ rootItem.percentChange ]]) [[ rootItem.tradeTime ]]
Quote Overview for [[ item.sessionDateDisplayLong ]]
[[ rowChartData.labelLow ]]
[[ rowChartData.lowPriceFormatted ]]
[[ rowChartData.lowPrice ]]
[[ rowChartData.labelHigh ]]
[[ rowChartData.highPriceFormatted ]]
[[ rowChartData.highPrice ]]
since [[ rowChartData.lowDate ]]
since [[ rowChartData.highDate ]]
[[ value ]] [[ value ]]

S&P 500 Cons Disc Futures Market News and Commentary

S&P 500 Falls from a Record High on Hawkish Powell

The S&P 500 Index ($SPX) (SPY) Wednesday closed down by -0.29%, the Dow Jones Industrials Index ($DOWI) (DIA) closed down by -0.25%, and the Nasdaq 100 Index ($IUXX) (QQQ) closed down by -0.45%.

Stocks on Wednesday gave up mid-session gains and turned lower as hawkish comments from Fed Chair Powell pushed bond yields higher and sparked the selling of chip stocks when he said the Fed was in no rush to ease monetary policy. 

Stocks initially rallied Wednesday afternoon, with the S&P 500 and Dow Jones Industrials climbing to new record highs and the Nasdaq 100 climbing to a 3-week high.  The FOMC’s decision Wednesday to cut the fed funds target range by -50 bp and project another -50 bp worth of rate cuts by year-end pushed stock prices higher.  Also, Wednesday’s US housing starts and building permits reports were better than expected, bolstering the prospects for a soft landing and supporting stocks.

The FOMC voted 11-1 to cut the federal funds target range by -50 bp... Read more

Contract Specifications

See More
Contract
S&P 500 Consumer Discretionary Sector Index
Contract Size
$100 times Index
Tick Size
0.10 points ($10.00 per contract)
Trading Hours
5:00p.m. - 4:00p.m. (Sun-Fri) (Settles 3:00p.m.) CST
Exchange
CME
Point Value
$100
Expiration Date
06/20/19 (expired)

Seasonal Chart

S&P 500 Cons Disc Jun '19
Average Price Chart for 5 Prior Jun Contracts
Get Realtime - Quotes and Charts for Futures Traders. Learn More >>

Price Performance

See More
Period Period Low Period High Performance
1-Month
1,102.60 +10.00%
on 06/03/19
1,215.80 -0.24%
on 06/20/19
+44.25 (+3.79%)
since 05/21/19
3-Month
1,102.60 +10.00%
on 06/03/19
1,221.90 -0.74%
on 04/24/19
+59.25 (+5.14%)
since 03/21/19
52-Week
932.00 +30.13%
on 12/24/18
1,221.90 -0.74%
on 04/24/19
+86.65 (+7.69%)
since 06/21/18

More S&P 500 Cons Disc Quotes

All Futures Prices
Please wait...

Most Recent Stories

More News
Implied Volatility Surging for Sarepta Therapeutics (SRPT) Stock Options

Investors in Sarepta Therapeutics, Inc. SRPT need to pay close attention to the stock based on moves in the options market lately. That is because the Oct 18, 2024 $80 Call had some of the highest implied...

SRPT : 126.22 (+0.97%)
Should You Buy BK Stock as it Hits All-Time High on Fed Cuts Rates?

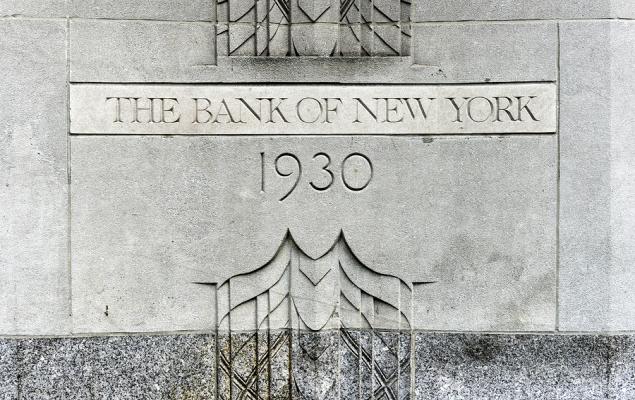
Shares of The Bank of New York Mellon Corporation BK, popularly known as BNY Mellon, have performed well this year. The stock touched its all-time high of $71.80 during Wednesday’s trading session as...

BK : 70.94 (-0.14%)
STT : 87.86 (+0.80%)
NTRS : 91.18 (+0.96%)
Do Options Traders Know Something About AirSculpt Technologies (AIRS) Stock We Don't?

Investors in AirSculpt Technologies, Inc. AIRS need to pay close attention to the stock based on moves in the options market lately. That is because the Oct. 18, 2024 $1.00 Call had some of the highest...

AIRS : 4.54 (+2.48%)
Is the Options Market Predicting a Spike in BrightSphere (BSIG) Stock?

Investors in BrightSphere Investment Group Inc. BSIG need to pay close attention to the stock based on moves in the options market lately. That is because the Oct 18, 2024 $22.50 Put had some of the highest...

BSIG : 25.26 (+0.56%)
Are Options Traders Betting on a Big Move in Hooker Furniture (HOFT) Stock?

Investors in Hooker Furnishings Corporation HOFT need to pay close attention to the stock based on moves in the options market lately. That is because the Nov 15, 2024 $25.00 Call had some of the highest...

HOFT : 18.71 (+1.35%)
Should You Follow Insider Buying on This Energy Dividend Stock?

The article examines whether investors should follow insider buying on a promising energy dividend stock.

CRGY : 11.42 (+2.88%)
CLV24 : 71.64 (+1.03%)
NGV24 : 2.262 (-0.96%)
XLE : 88.73 (+0.93%)
Fed Cuts Rates by 50 Basis Points: Sector ETFs to Play

On Sept. 18, 2024, the Federal Reserve implemented its first interest rate cut in four years, reducing the benchmark rate by half a percentage point (50 basis points). This move comes in response to cooling...

VNQ : 97.98 (-0.18%)
XLU : 77.89 (-0.75%)
IHF : 57.74 (+0.19%)
VDC : 219.11 (+0.10%)
IYK : 70.77 (-0.32%)
FTXG : 25.94 (+0.18%)
Wolverine Hits 52-Week High: Can Innovation Drive the Stock Higher?

Shares of Wolverine World Wide, Inc. WWW hit a 52-week high of $15.37 on Wednesday before finally closing at $14.89. So far, WWW stock has rallied 67.5% against the Zacks Shoes and Retail Apparel industry’s...

ANF : 138.39 (+2.17%)
BOOT : 162.48 (+1.34%)
WWW : 15.01 (+0.81%)
SHOO : 48.37 (+1.92%)
Cracker Barrel (NASDAQ:CBRL) Reports Q2 In Line With Expectations

Cracker Barrel (NASDAQ:CBRL) Reports Q2 In Line With Expectations

CBRL : 42.51 (+2.29%)
Small-Cap Growth ETF (FYC) Hit a New 52-Week High

For investors seeking momentum, Smallcap Growth Alphadex Fund First Trust FYC is probably on the radar. The fund just hit a 52-week high and is up 44.91% from its 52-week low price of $51.39/share.But...

FYC : 74.76 (+1.65%)

Key Turning Points

3rd Resistance Point N/A
2nd Resistance Point 1,222.97
1st Resistance Point 1,218.03
Last Price 1,212.85s
1st Support Level 1,205.93
2nd Support Level 1,198.77
3rd Support Level N/A

See More

52-Week High 1,221.90
Last Price 1,212.85s
Fibonacci 61.8% 1,111.16
Fibonacci 50% 1,076.95
Fibonacci 38.2% 1,042.74
52-Week Low 932.00

See More

Want to use this as
your default charts setting?
Save this setup as a Chart Templates
Switch the Market flag
for targeted data from your country of choice.
Open the menu and switch the
Market flag for targeted data from your country of choice.
Want Streaming Chart Updates?
Switch your Site Preferences
to use Interactive Charts
Need More Chart Options?
Right-click on the chart to open the Interactive Chart menu.
Use your up/down arrows to move through the symbols.

Free Barchart Webinar