
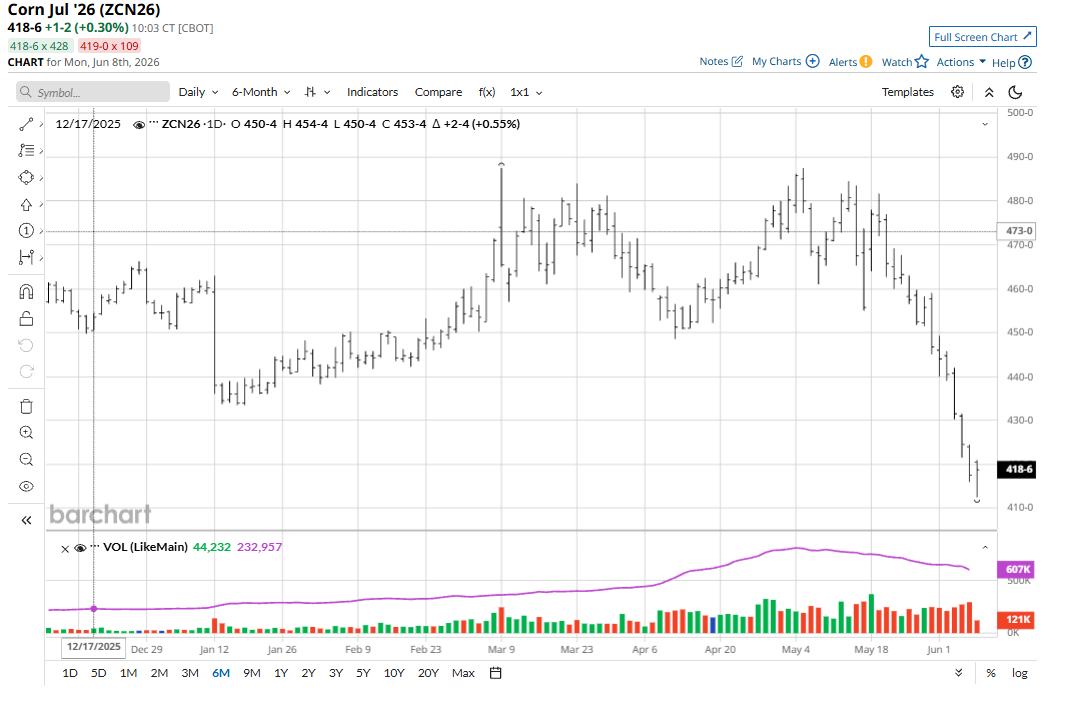
The daily bar chart for July corn (ZCN26) futures looks like the face of Yosemite’s El Capitan: a steep and perilous cliff. Even famed climber Alex Honnold would have second thoughts about trying to rescue the corn market from El Cap. And the winter wheat and soybean futures markets are not faring much better. What’s it going to take to fix the hemorrhaging grain futures markets? Read on.
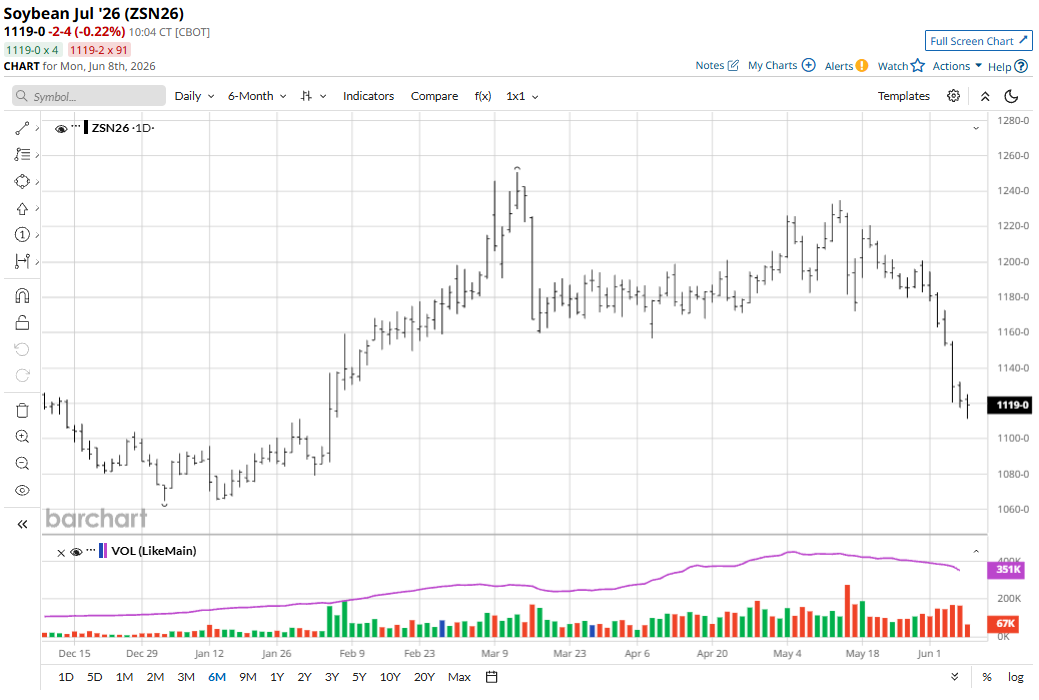
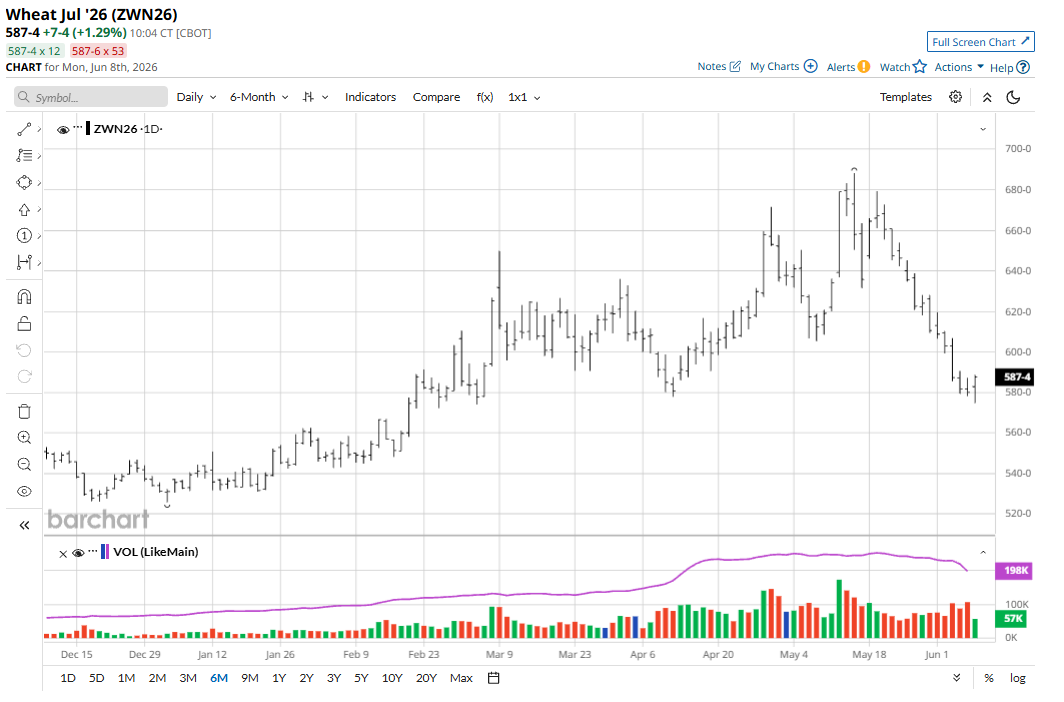
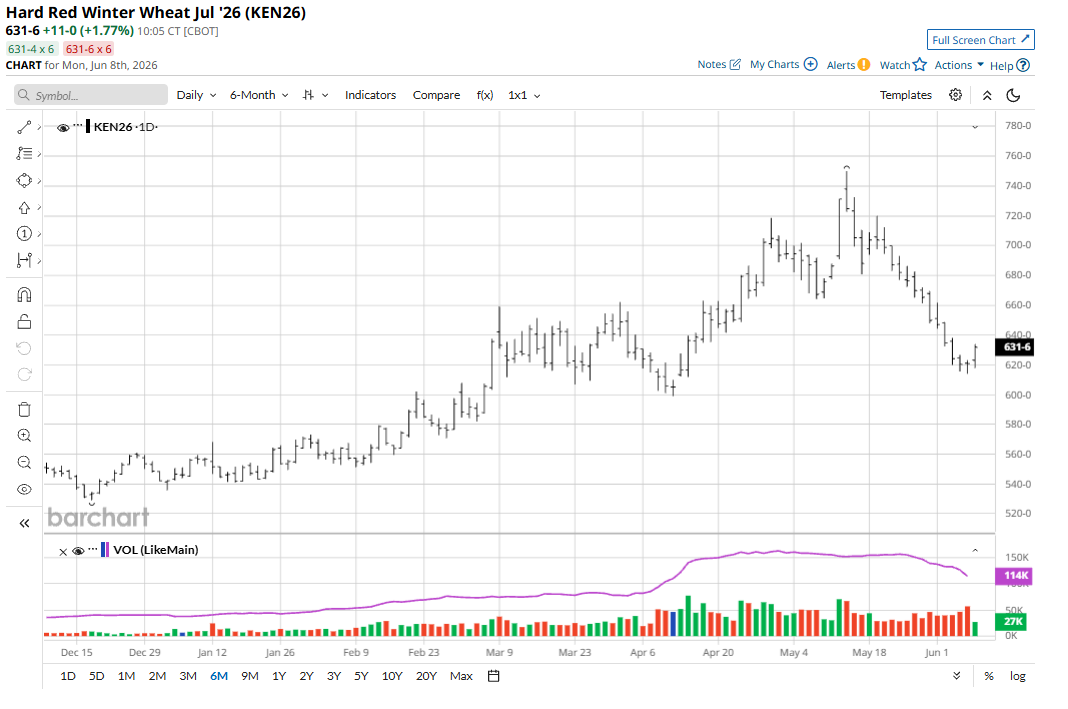
July corn futures on Friday fell 7 cents to $4.17 1/2 and hit another contract low. For the week, July corn was down a stunning 29 1/4 cents. July soybeans (ZSN26) lost 8 cents on Friday to $11.21 1/2, hit a four-month low, and for the week were down a whopping 65 1/4 cents. July soft red winter (SRW) wheat (ZWN26) futures on Friday closed down 1 3/4 cents to $5.80 and for the week were down 30 1/2 cents. July hard red winter (HRW) wheat (KEN26) futures rose 1/2 cent to $6.20 3/4 but for the week lost 29 cents. July SRW and HRW hit seven-week lows on Friday.
The stunning price downdrafts in the grain futures market continued, with Friday’s technically bearish weekly low closes in all the grains suggesting follow-through, chart-based selling early this week.
The grain futures markets have been caught in a price downdraft from weak long liquidation from the retail speculators and big fund players. New speculator short-selling activity also likely entered the grain markets late last week.
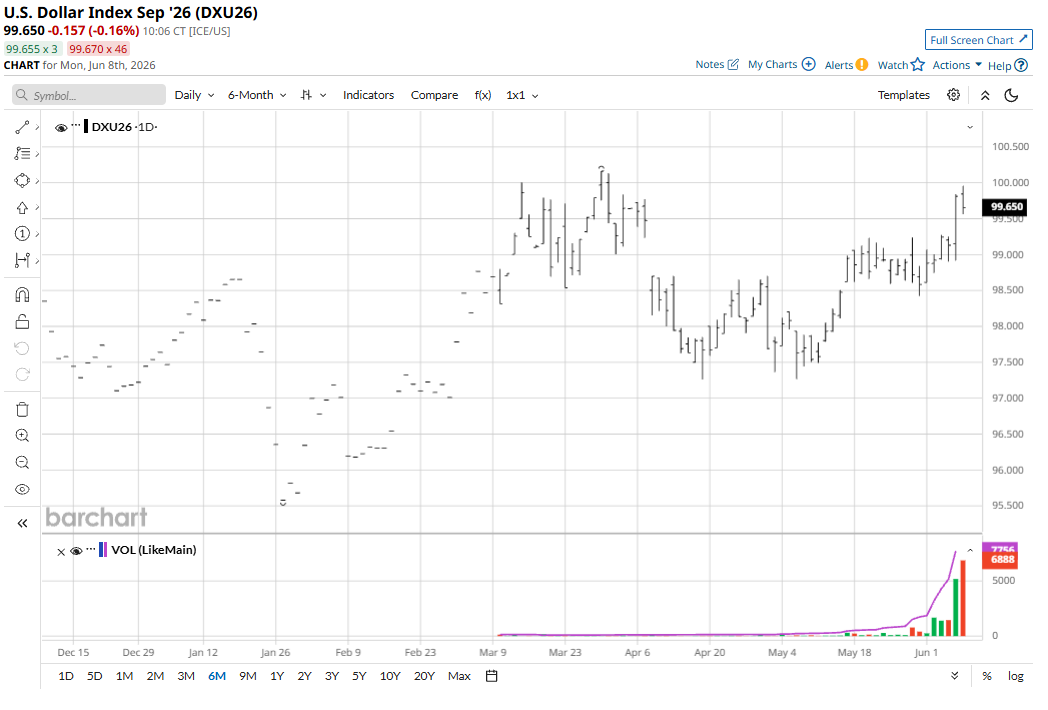
The strong rally in the U.S. dollar index ($DXY) late last week was also a bearish outside-market development for the grains. The USDX hit a two-month high on Friday.
Midwest Weather Leans Price-Bearish
The main price-bearish fundamental in the corn and soybean futures markets is generally good growing weather over much of the Midwest. “Rain makes grain,” has the grain market bears willing to continue to play the short sides in corn and soybeans. Also, recent beneficial rains in U.S. winter wheat country (especially HRW regions) have also worked to put price pressure on winter wheat markets. Weather forecasts for the Midwest for the next couple of weeks do not point to any threatening weather conditions for the young U.S. corn and soybean crops.
Relative Strength Index Readings Suggests Price Bottoms Close at Hand
Relative Strength Index (RSI) technical indicator readings on the daily bar charts for the grains are presently at technically oversold levels, which coincide with near-term market bottoms being put in place over the past 12 months. Thus, a high-range daily close in a trading session would be one early clue of seller exhaustion in the grain futures. For example, July corn as of Friday’s close had gone 13 trading sessions in a row without having a daily close be close to the session high. The only day that came close was May 28, which saw July corn close just above mid-range.
Grain traders will keep watching the weekly USDA crop progress reports. Next week’s reports will likely show most of the U.S. corn crop in good condition for this time of year.
Big Grain Markets Data Point in Late June
The late-June USDA U.S. planted acreage updates are starting to draw trader attention and speculation on what the agency will report. There are growing notions that U.S. planted corn acres won’t be reduced much, despite high fertilizer prices that may have prompted some producers to switch intended corn acres to soybeans.
On Thursday of this week, USDA’s monthly supply and demand report (WASDE) will update U.S. grain stocks.
Weekly USDA crop progress data on Monday afternoons will continue to be closely scrutinized by grain futures traders.
When the Calendar Turns to July
The late long-time grain market watcher Conrad Leslie once told me during an interview: “Come July, traders and producers will have their eyes to the sky.”
Early July finds most of the U.S. corn crop in its most critical pollination growth stage. Soybeans will also need more moisture in July. However, the month of July tends to turn hotter and drier than the month of June. Grain markets’ trading history shows that the trading week after the Independence Day holiday can be pivotal for the grain markets. Existing price trends in the grains can be accelerated or reversed. Given the steep price downdrafts in the grains at present, it’s very difficult to imagine prices accelerating any harder to the downside!
Don’t be surprised to see some degree of a weather-market scare pop up rapidly in corn and/or soybeans in the coming months. More years than not, one occurs. If the corn and soybean markets catch a weather-market-scare price updraft, wheat futures prices will very likely catch the tailwind, too.
A Positive for the Soybean Complex
Global biofuel demand is likely to continue to offer support for soybean oil futures, which may put in a price floor in the soy complex futures soon.
Meanwhile, elevated food prices worldwide and heightened inflation worries should also work to keep a floor under grain futures prices in the coming weeks and months.
My Bias
I believe the steep selloffs in the grain futures have been overdone on the downside and that grain futures prices right now are probably value-buying opportunities — especially on a longer-term basis. Commodity markets’ price history shows that time and time again, traders push markets too high and too low, and then they see corrective price moves in the opposite direction, to end the existing price trends. It’s also my bias that the grain markets will see some degree of a weather-market scare in the next three months (probably sooner rather than later), to at least temporarily boost prices.
Finally, I still believe the grain markets are on the verge of major bull moves that could rival those seen in the metals markets over the past couple years. Why? Problematic Inflation and perceived food shortages. The difficulty in playing such a scenario is getting right the timing of getting long the grains. That’s never easy.
Tell me what you think. I read every one of your emails. My email address is jim@jimwyckoff.com. I enjoy getting feedback from all of you, my valued Barchart readers.
On the date of publication, Jim Wyckoff did not have (either directly or indirectly) positions in any of the securities mentioned in this article. All information and data in this article is solely for informational purposes. For more information please view the Barchart Disclosure Policy here.

/Micron%20Technology%20Inc_%20logo%20on%20building-by%20vzphotos%20vis%20iStock.jpg)

/AI%20(artificial%20intelligence)/AI%20engineer%20working%20on%20laptop%20by%20ART%20STOCK%20CREATIVE%20via%20Shutterstock.jpg)
