Contract Specifications
See MoreContract
N/A
Contract Size
N/A
Tick Size
N/A
Trading Hours
N/A
Exchange
NYMEX
Point Value
$10,000
Expiration Date
06/25/20 (expired)

Barchart supports the global finance, media and commodity markets with data and technology for trading, investing and risk management.

The star fund manager believes that the crypto's price can reach $1.25 million per coin.

Many of the best option-selling opportunities emerge before a stock becomes a momentum favorite. This article examines First Majestic Silver and Baxter International, two stocks transitioning from weakness...

Many investors assume outperforming the market requires constant prediction and complex strategies. In reality, some of the most durable results come from simple, repeatable systems built around consistency,...

Rushing to own the latest “hot” stock can make you a financial victim in just a matter of days… or even hours.

Successful spread trading is not about finding the best trades—it’s about eliminating the majority that don’t meet structural standards. This article outlines a practical filtering framework using...
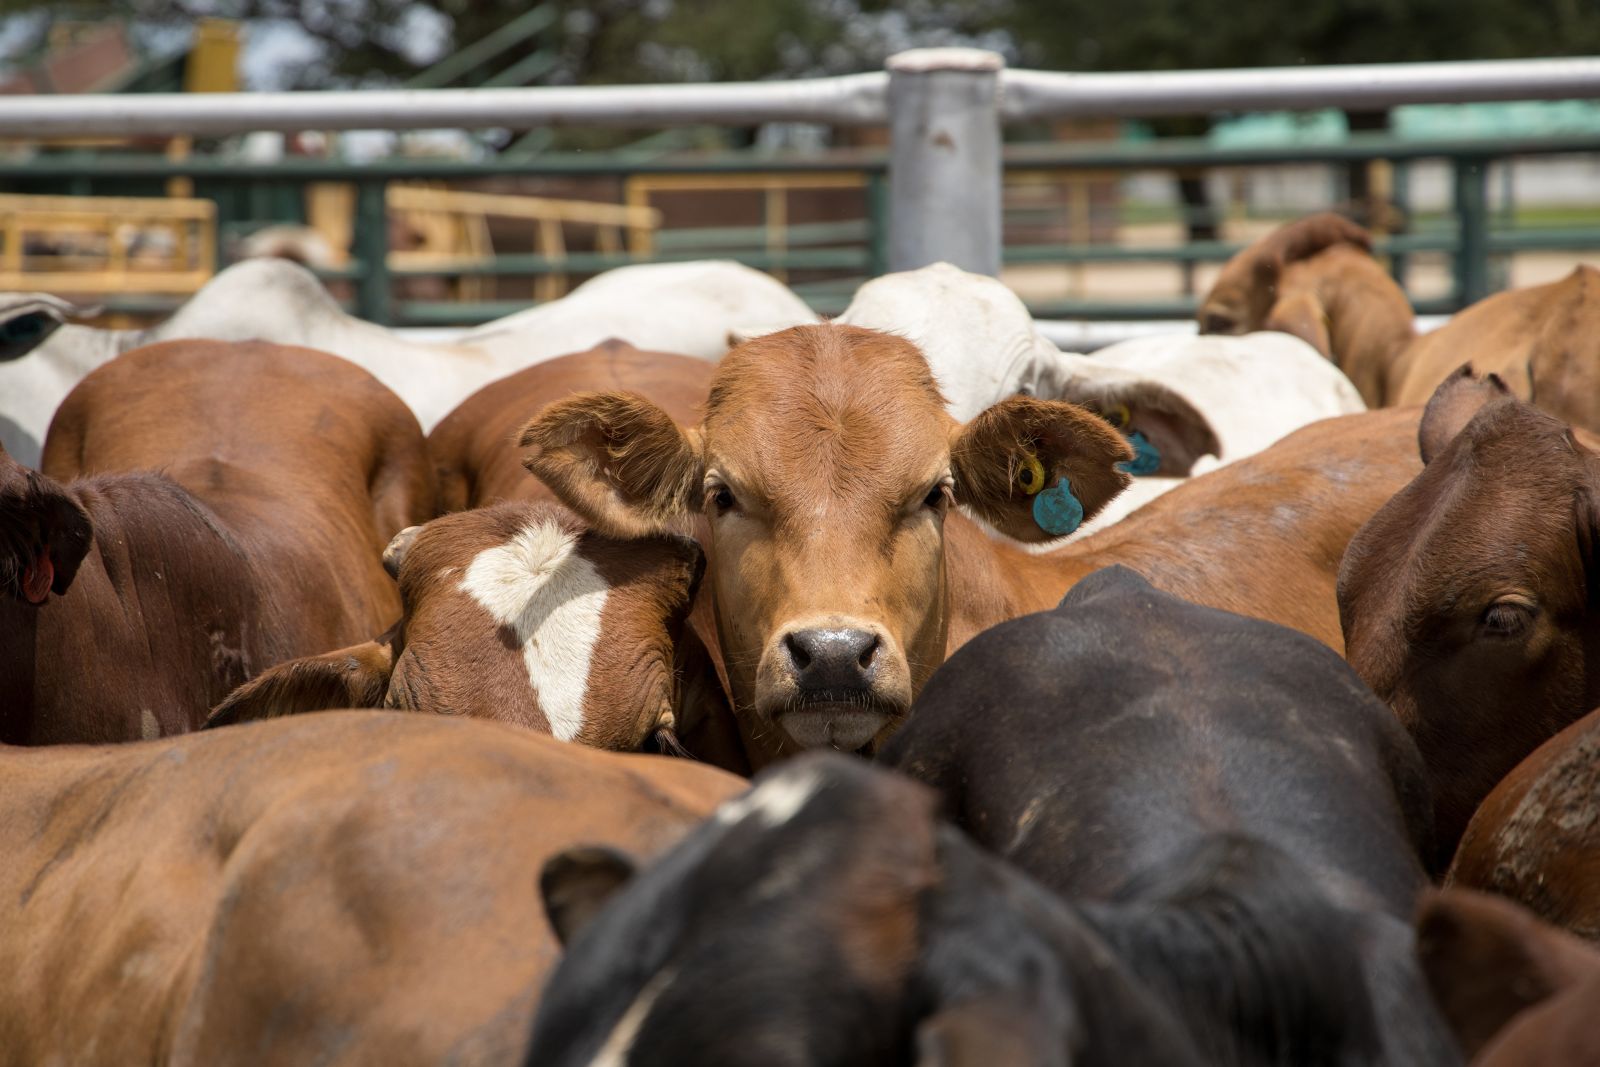
Cattle markets trade down to low end of recent trading range
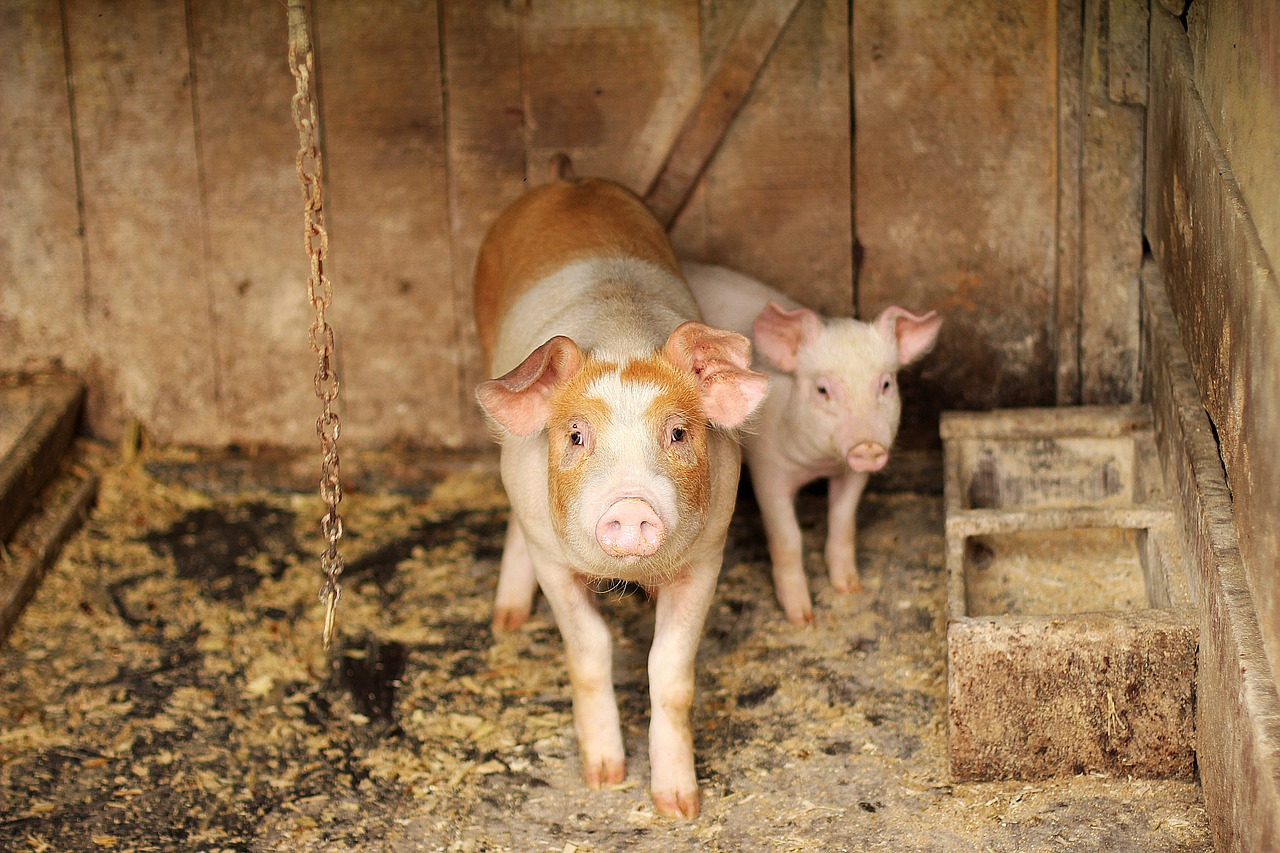
Lean hog futures were down 80 cents to $2.62 at the close, as June was up just a dime on the week. USDA’s national base hog price was reported at $93.23 on Friday afternoon, down 41 cents from the day...

Live cattle futures were $1.50 to $2.40 lower on Friday, with June down $1.05 this week. Cash trade picked up on Friday to $255-258 across the country. Feeder cattle futures were down $4.60 to $5.02 in...
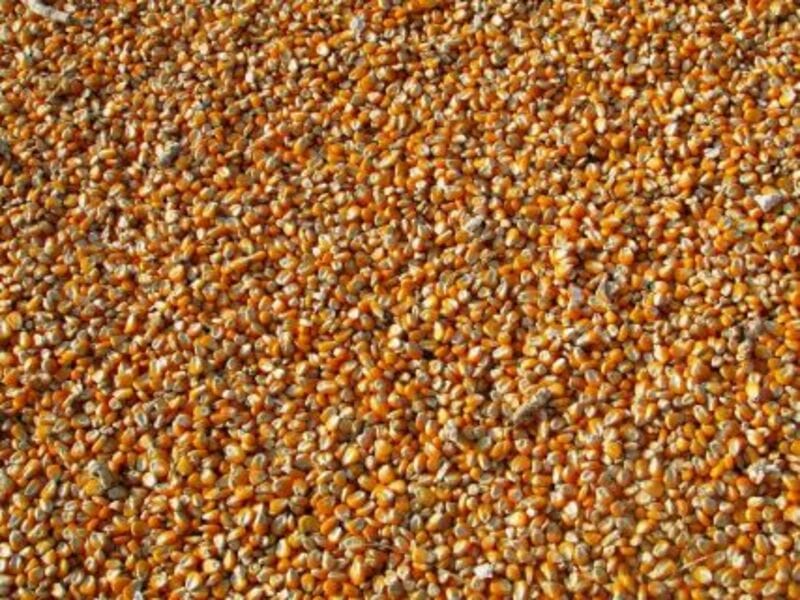
Corn futures posted 2 to 9 cent losses across the board on Friday with money coming out at month-end. July fell 16 ½ cents this week. Crude Oil was a pressure factor, down $1.14/bbl, money was flowing...
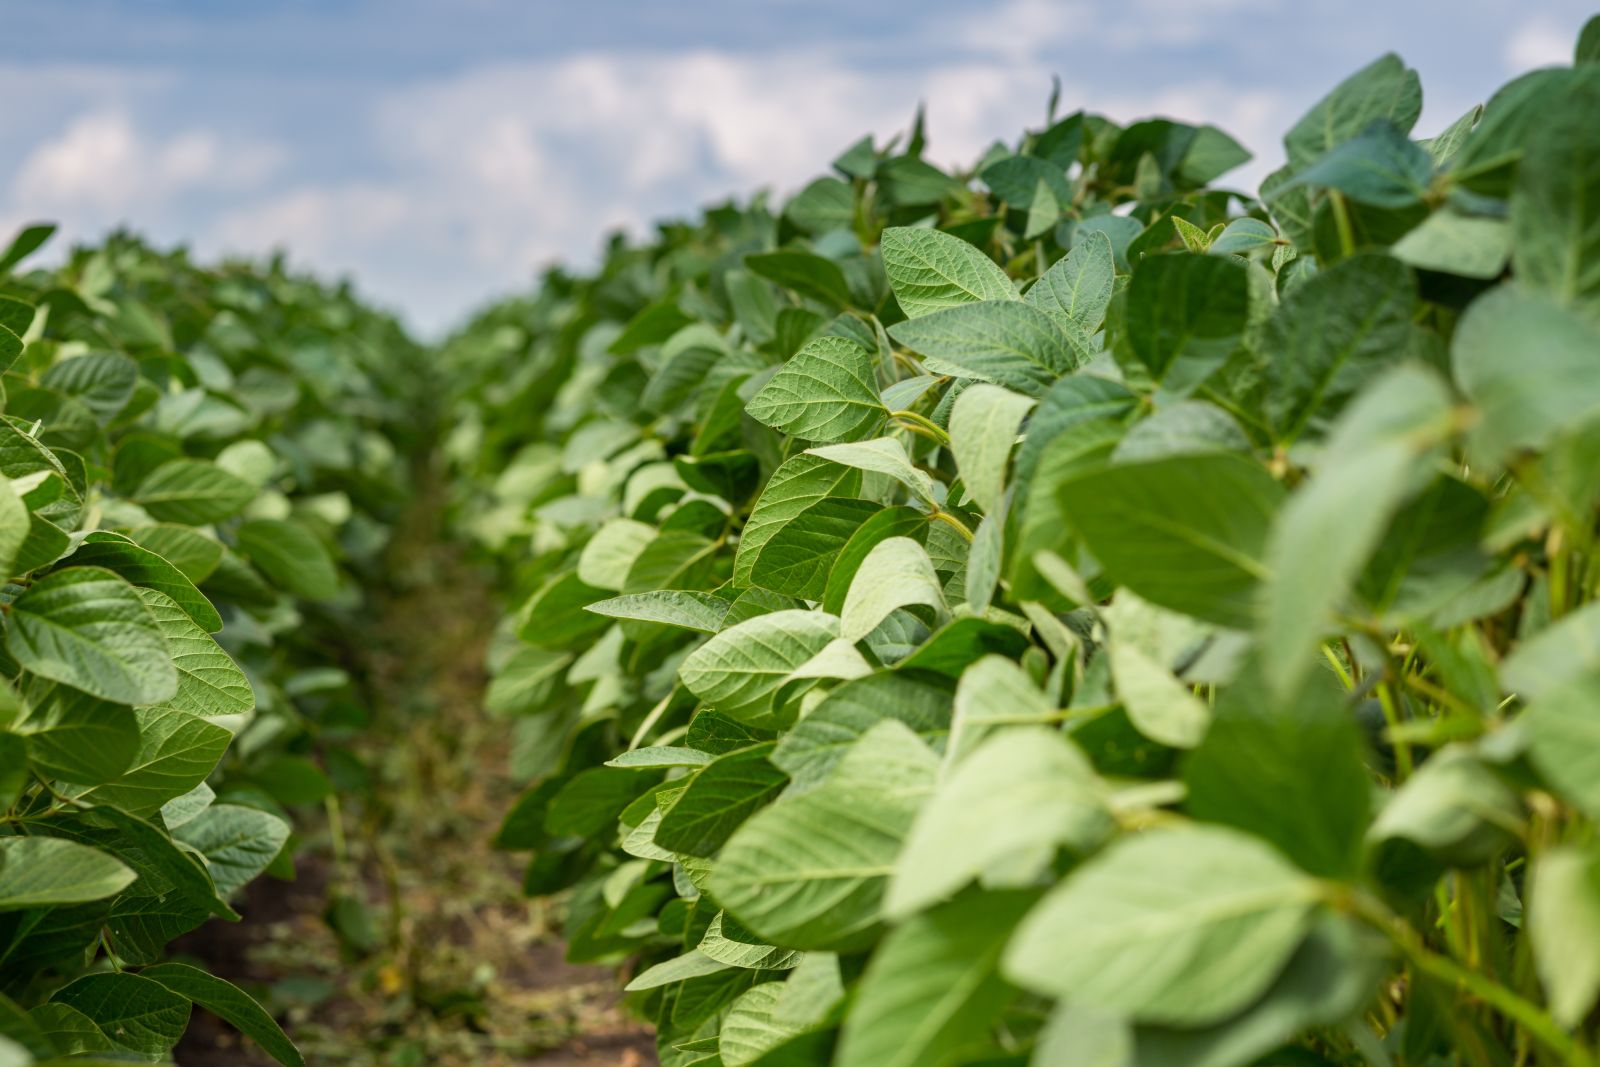
Soybeans saw fractional losses in some deferreds, with nearbys down 7 ¾ cents on Friday. July was down 9 ¾ cents this week. The cmdtyView national average Cash Bean price was down 9 1/4 cents at $11.25...

