Contract Specifications
See MoreContract
N/A
Contract Size
N/A
Tick Size
N/A
Trading Hours
N/A
Exchange
NYMEX
Point Value
$100
Expiration Date
01/08/15 (expired)

Barchart supports the global finance, media and commodity markets with data and technology for trading, investing and risk management.


When there’s an iconic brand, a blue-chip stock, down more than 70% from its peak price, and I can still own it with a downside risk level I define myself? “Just Do It” sings in my ears.

Silver remains under pressure after a sharp decline from highs, with wave four correction still in play. Current structure suggests another leg lower may develop within wave C.
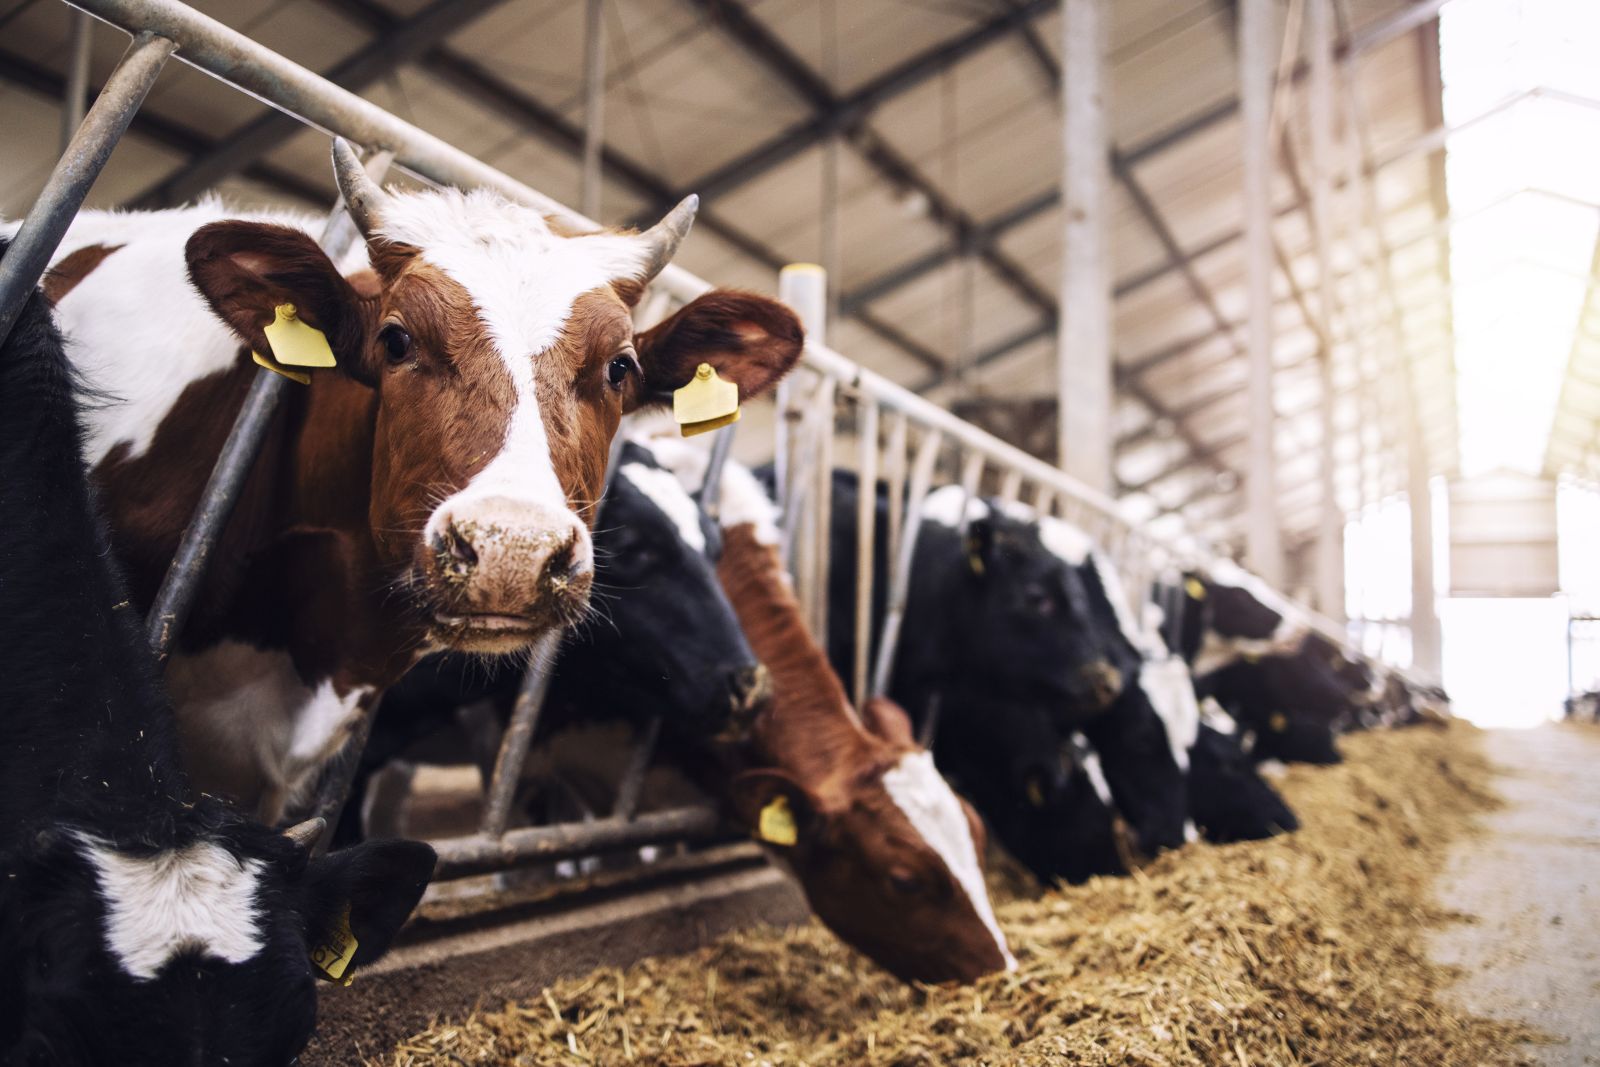
Live cattle futures posted 65 cent to $2.15 gains on Thursday, with April $7.70 higher on the week. Cash trade got kicked off with strength on Thursday, with trade at $245 across the country, up $10 from...
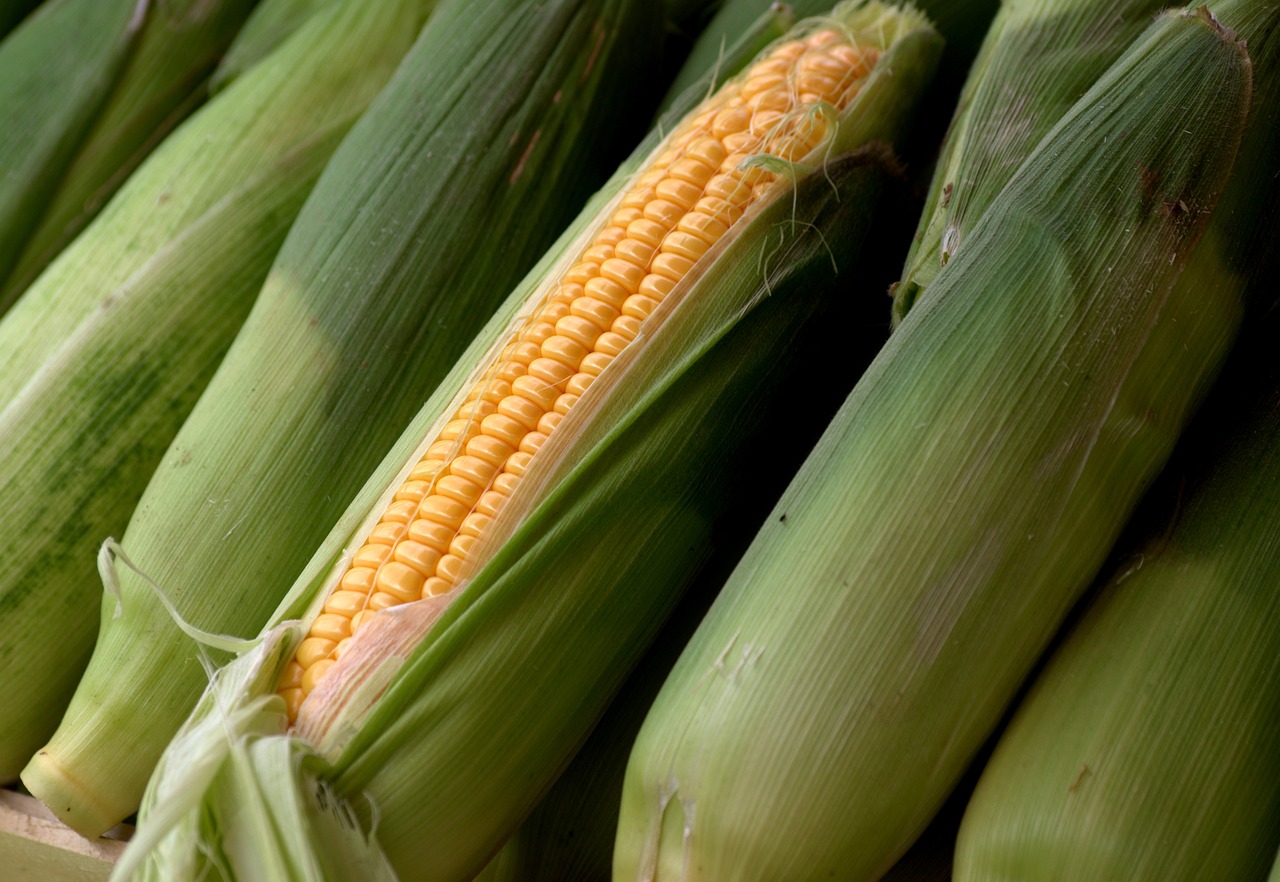
Corn futures headed into the long weekend, with some front month weakness as money was being taken off the table. Old crop contracts were fractionally to 2 cents lower, as new crop was steady to fractionally...
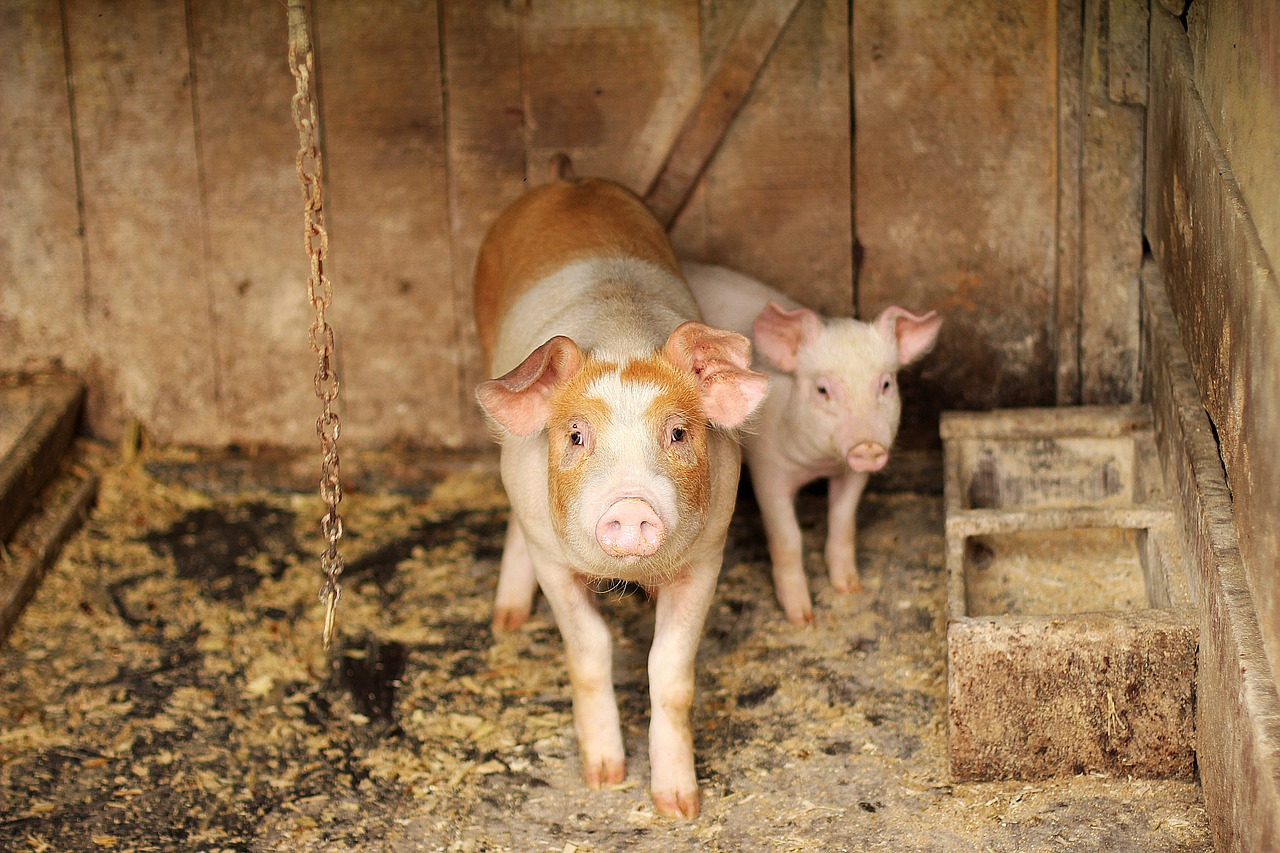
Lean hog futures were 20 to 77 cents higher on Thursday, as April slipped 42 cents this week. USDA’s national base hog price was reported at $90.35 on Thursday afternoon, up 18 cents from the day prior....
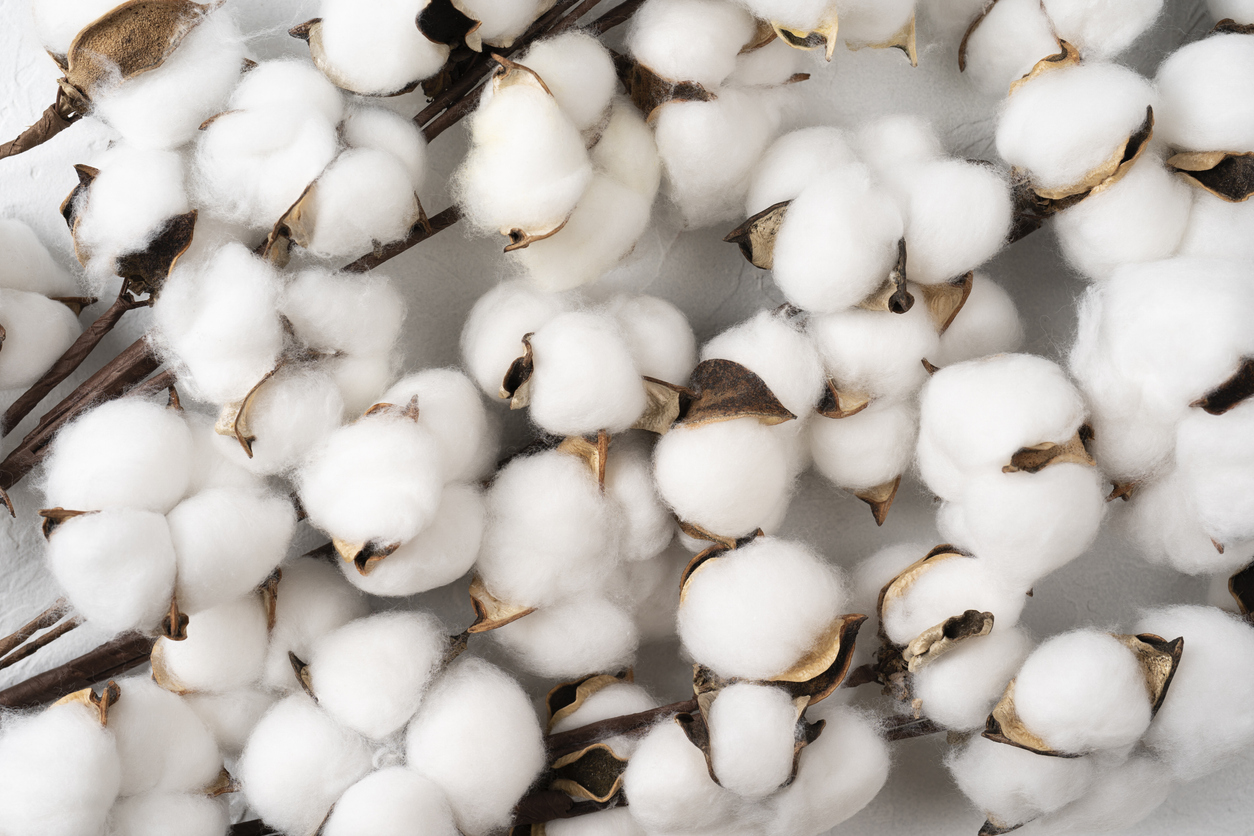
Cotton futures were up 16 points to down 21 points at the Thursday close, as May was up 146 points this week. The US dollar index was $0.402 higher at $99.860. Crude Oil was up $11.94 at $112.06, after...
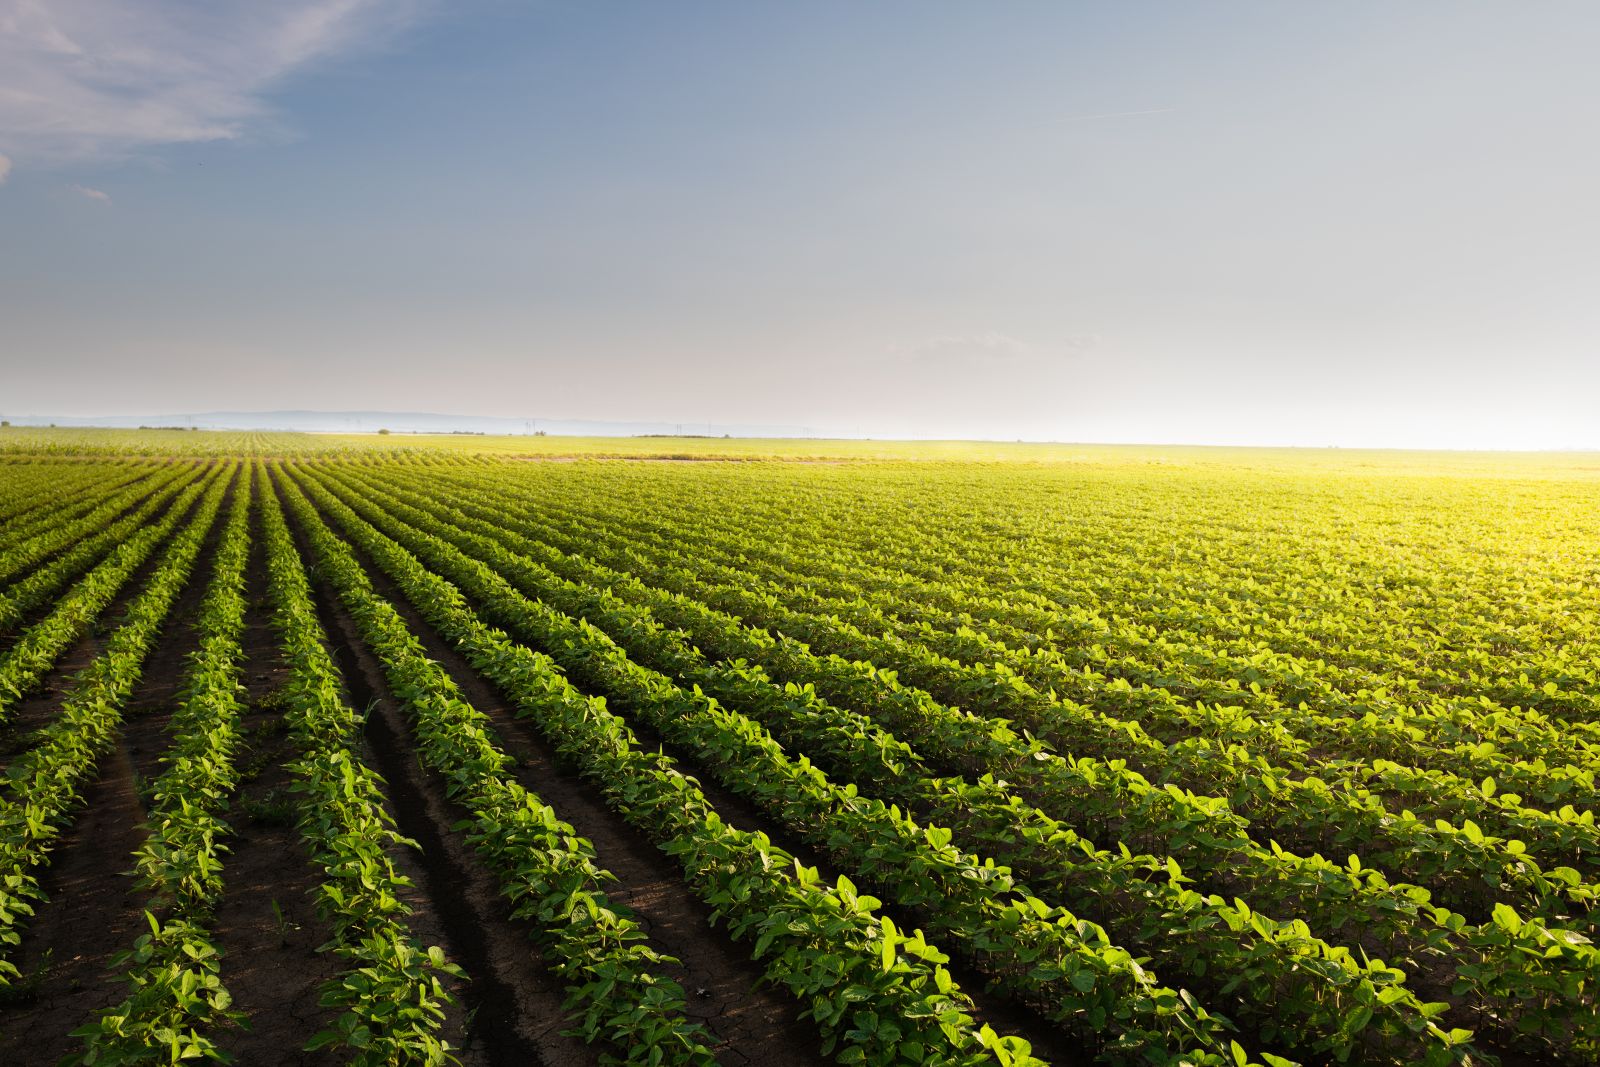
Soybeans saw losses of 1 to 5 ¼ cents in most contracts on Thursday, as May saw a 4 ¼ cent gain this week. The cmdtyView national average Cash Bean price was down 5 1/2 cents at $10.94. Soymeal futures...

The wheat complex held on for marginal gains to head into the long weekend. Chicago SRW futures saw fractional to 2 cent gains on the day, with May down 6 ¾ cents on the week. KC HRW futures were 2 to...

The war in Iran is driving a historic surge in energy and grain prices while simultaneously threatening to break the cattle market due to rising input costs and shrinking consumer disposable income.
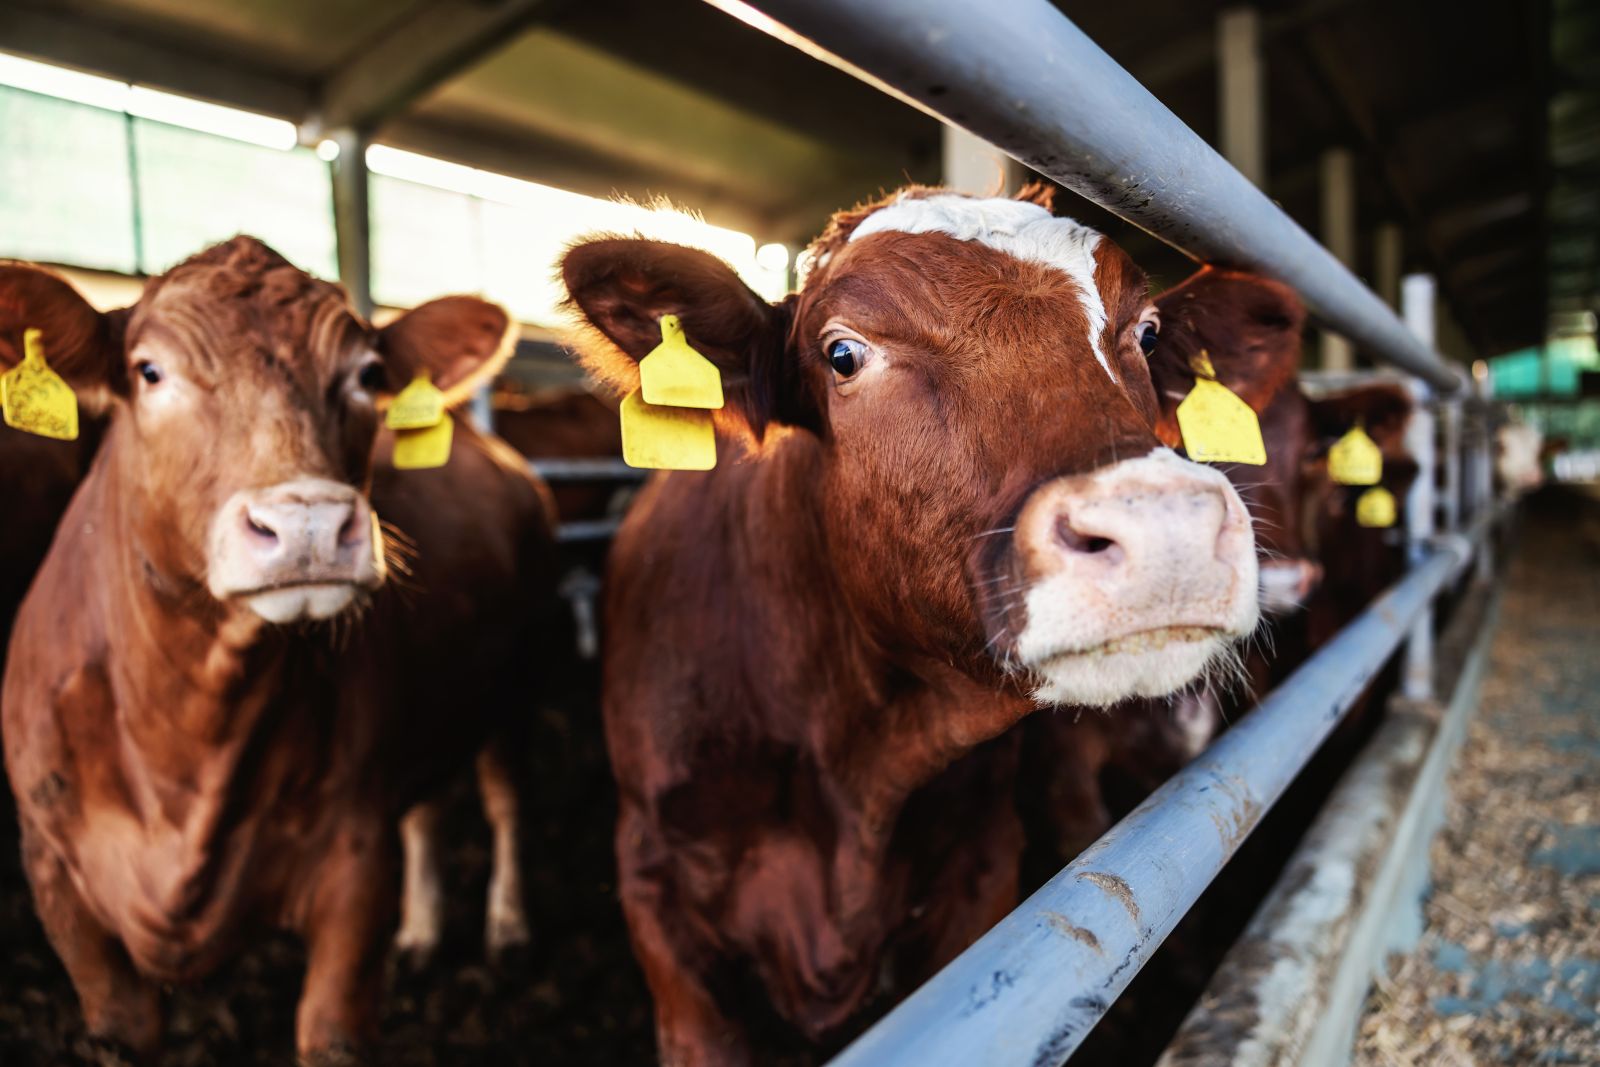
New Contract Highs in the Live Cattle Market - Grains Still Look Overpriced
