The past month has been chaotic and unsettling for the market as it shifts from one obsession to another, although investors have been surprisingly resilient. But how much longer will that resilience last?
Reports of retail investors pulling back might be temporary. But I don’t read surveys, I read charts. And in my recent review of the 20 largest stocks that comprise nearly half of the S&P 500 Index ($SPX) by weight, I frankly found nothing.
Can they rally suddenly on a social media post? Sure. But can they sustain the rally based on what I perceive as selling pressure that is unlikely to abate any time soon? There’s always a chance. But that chance is fairly small… and shrinking.
A quick look at the State Street SPDR S&P 500 ETF Trust (SPY) in ROAR Score format may help you to see what I see. I am constantly looking at ETFs and stocks in this format, alongside my traditional technical charts from Barchart.com. It is truly the best 1-2 punch I’ve had in my career for managing risk.
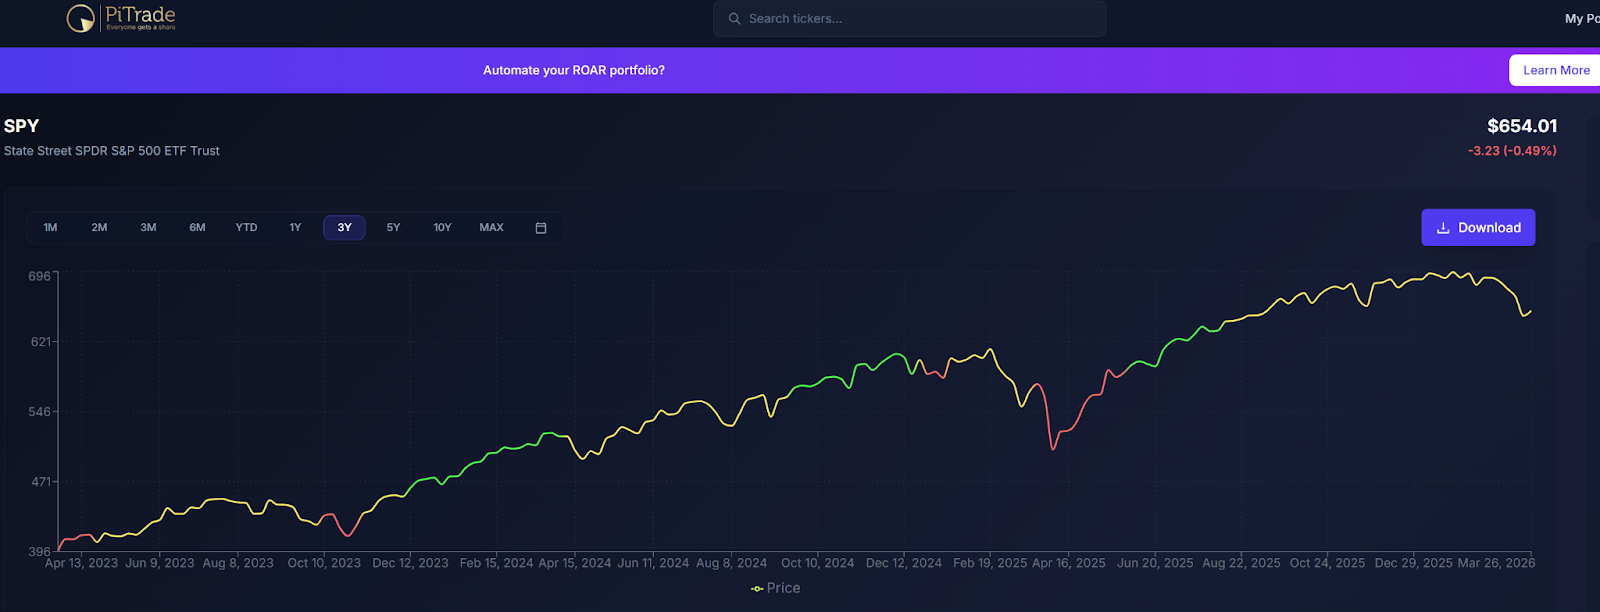
The ROAR Score for SPY shown above covers its path over the past 3 years. Bottom line: other than a well-prepared signal that fired in time to warn of an eventual 15% drop (out of 20% total) in SPY around this time last year, the path has been smooth. Not much green/lower risk, but plenty of yellow (neutral risk).
However, since ROAR is simply my automated spin on the actual price and trend data presented in charts like the ones from Barchart.com, it still helps to look at the chart itself. Here it is.
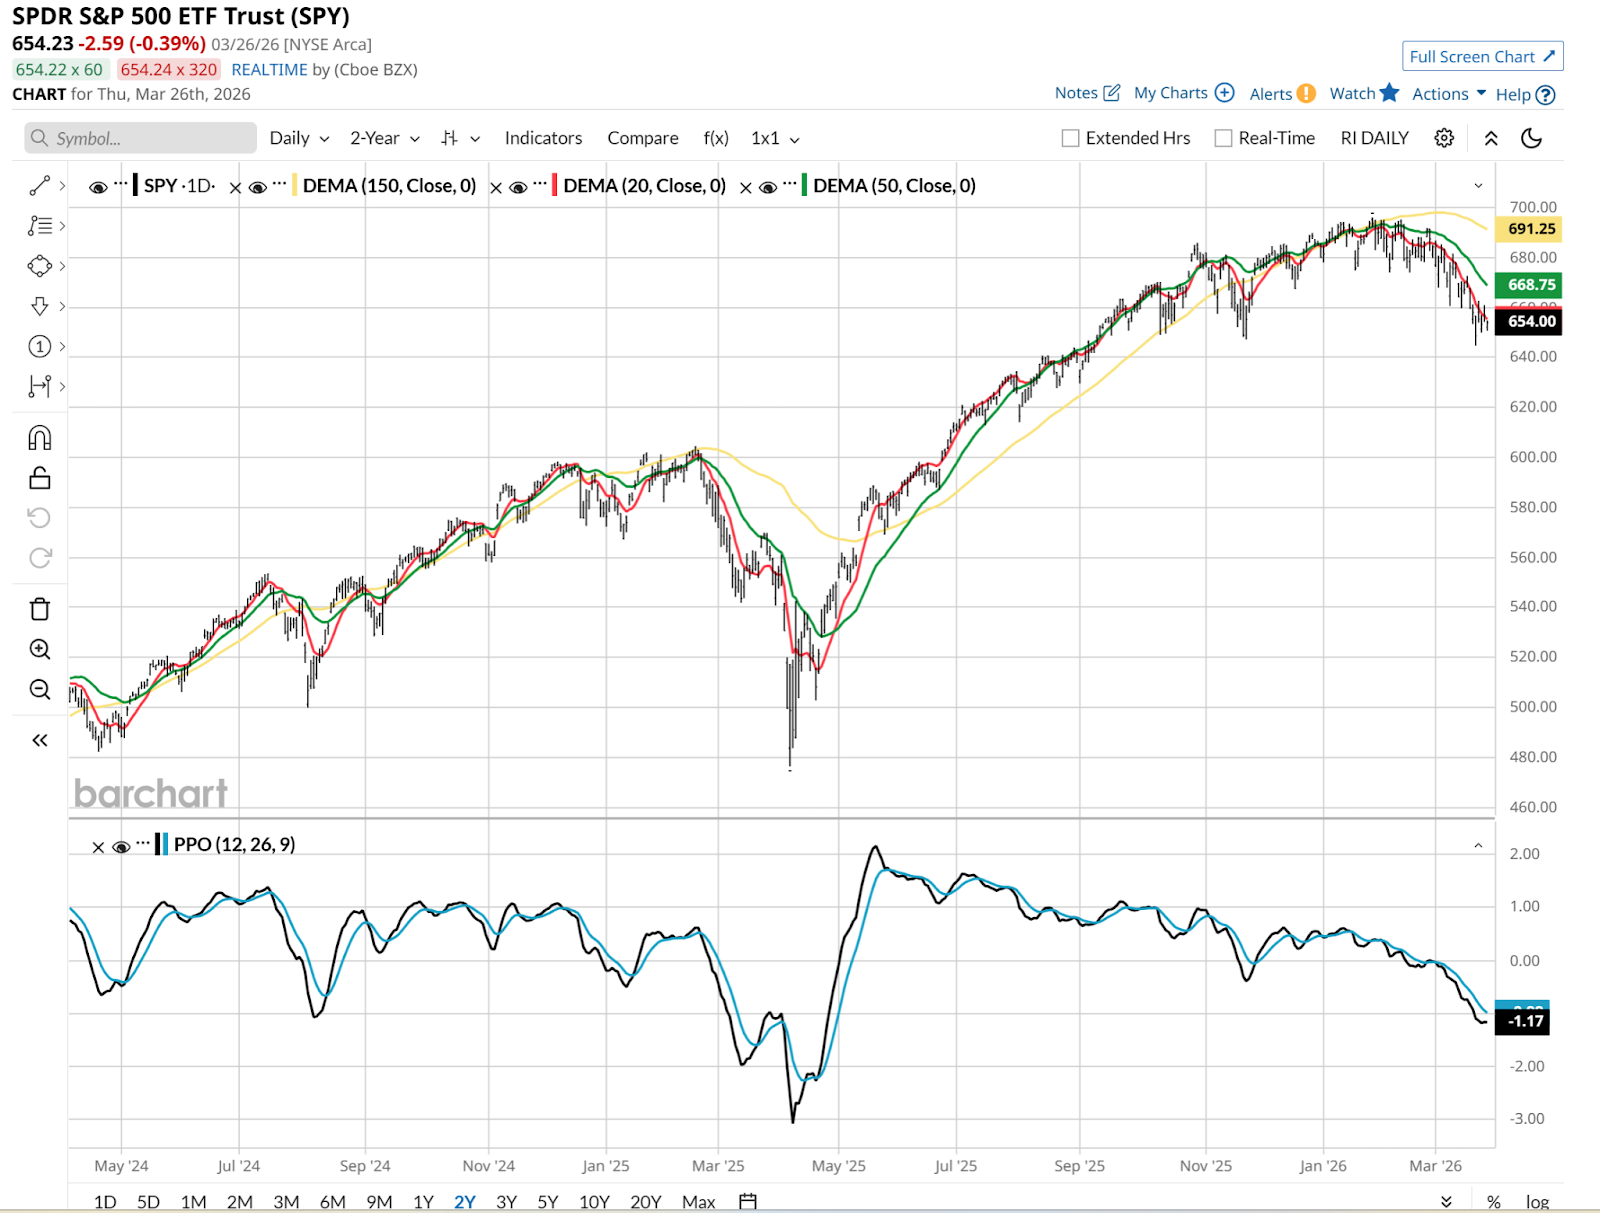
I’ve been highlighting this frequently the past few months. That Percentage Price Oscillator (PPO) at the bottom is about as rough a view as I’ve seen, maybe ever. That has everything to do with the dominance of index investing and algorithmic trading. And that is what helped spur the S&P 500’s transition during March. Not in direction, but in cause. It entered March concerned about the ability of AI to do more than change our lives. If stocks are to flourish, the companies changing our lives need to profit mightily. There’s too much spending happening now for that to fail and still please the stock market.
The war in Iran will bring relief at some point. But that will only shift the focus back to the AI concerns, an economy starting to feel the weight of more than a decade of massive consumer and government debt buildup, and a housing market that is simply stuck, with twice as many sellers as buyers according to some reports.
The month of March has been a masterclass in narrative distraction. For 30 days, the financial world has been fixated on the Strait of Hormuz, where a naval blockade and surging geopolitical tensions have sent crude oil prices up 47% in a single month. This energy shock has acted like a massive gravity well, pulling every ounce of market attention away from the deteriorating fundamentals of the artificial intelligence industry.
While traders were busy hedging against $112 oil (CLK26), the AI compute story began to develop several structural cracks that are now poised to become the center of attention as we head into April earnings season.
The primary distraction in March was the belief that tech is a safe haven from energy shocks. Because companies like Nvidia (NVDA) are chip designers rather than manufacturers, many investors assumed they were immune to rising input costs. However, the reality is that the AI boom is the most energy intensive transition in history.
The World Trade Organization recently warned that a prolonged energy crisis could crimp the AI buildout by driving up the marginal cost of compute beyond the marginal value of the labor it is supposed to replace. In March, this was treated as background noise, but as hyperscalers like Google (GOOGL) and Meta (META) prepare to report April results, the massive jump in data center utility bills is expected to hit margins in a way that the market hasn't yet priced in.
April will likely be the month of the great AI reality check. For the last six months, Nvidia has moved mostly sideways,while the rest of the market chased the next hype cycle. The upcoming earnings calls will force management teams to move beyond exploratory AI talk and provide measurable proof points of return on investment. With capital expenditure from the top five hyperscalers projected to exceed $700 billion this year, investors are no longer satisfied with impressive adoption numbers; they want to see financial impact. If the energy crisis in the Strait continues to drain liquidity from the system, the patience for high-multiple AI stocks with unproven delivery models will evaporate quickly.
March was a story of the stock market going from concerns about compute (AI) to sudden concerns about the Strait of Hormuz. To me, this situation is still the same trade. It is a market desperately hoping for something good to happen. On a temporary basis, that nearly always does. But I’m looking beyond the bounce, to come next. And I don’t like the odds, in sync with the 20 ROAR Score for SPY.
This Inverse ETF Is Poised to Rally if SPY Falls Further
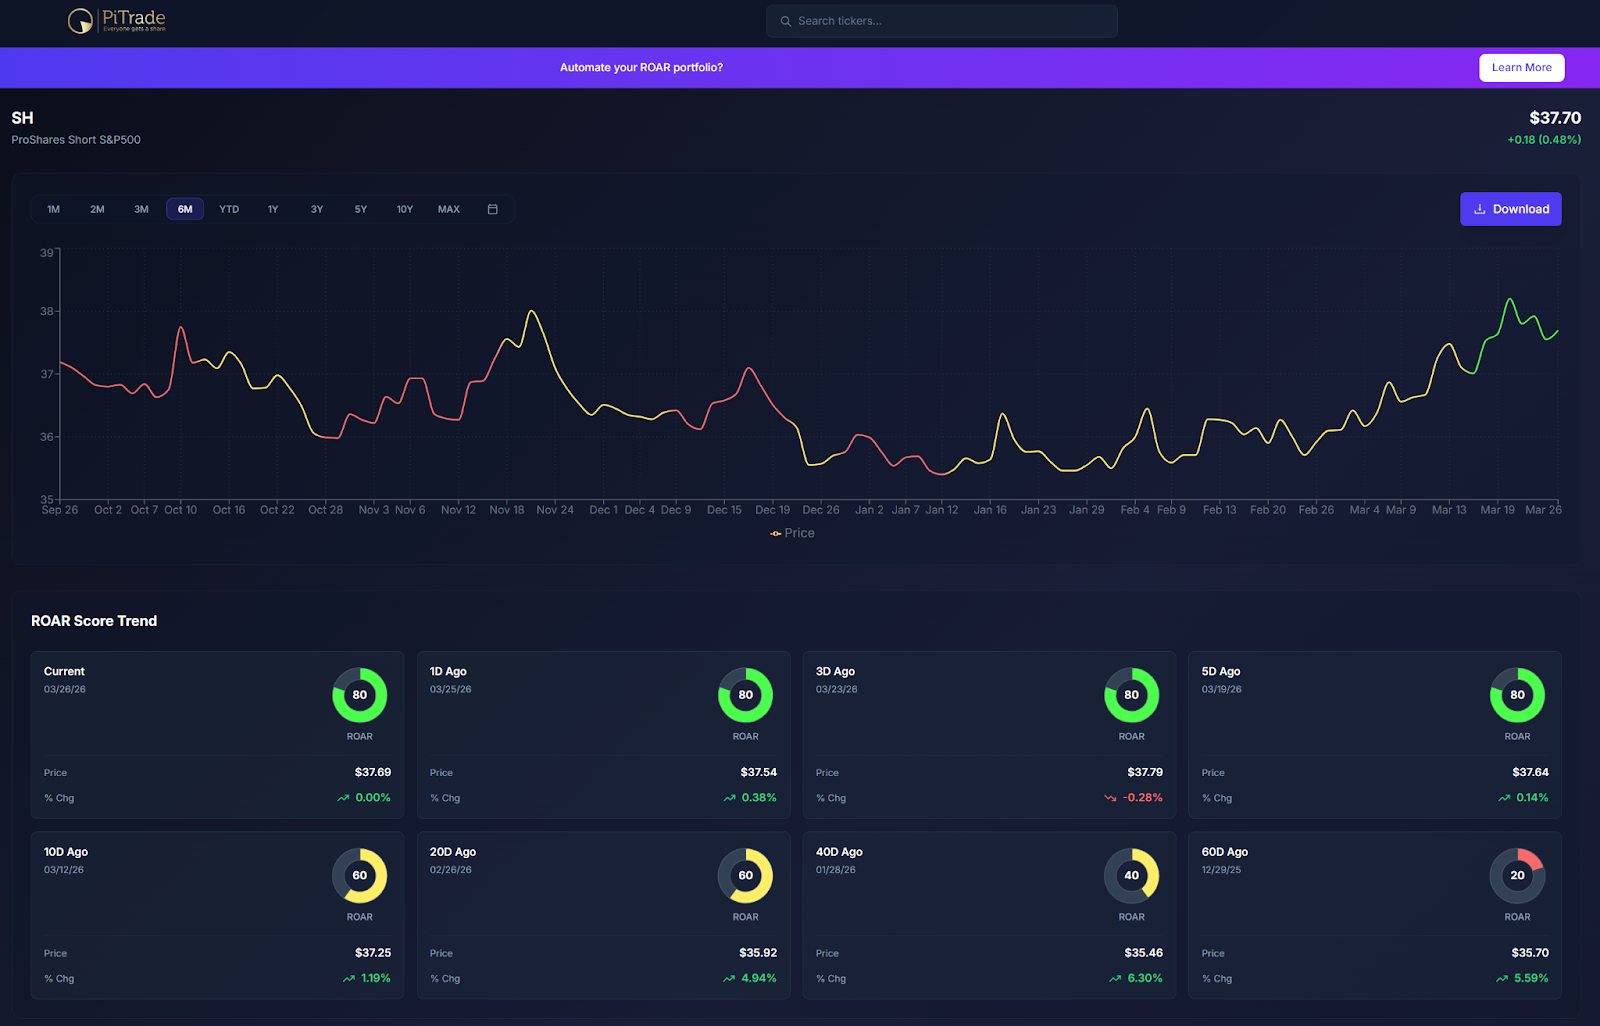
One of my first lines of defense to manage risk is using inverse ETFs, either 1x or leveraged. It requires a learning curve, but I think it is worth it for many investors and traders. As you can see above, when SPY looks weak (ROAR Score = 20) that usually translates to its inverse ETF (SH) looking pretty good. A current score of 80 tells me there’s a higher chance of making money on the downside the next few months than the usual way. No big bets here, just managing risk tightly, and playing the market we are dealt.
Rob Isbitts created the ROAR Score, based on his 40+ years of technical analysis experience. ROAR helps DIY investors manage risk and create their own portfolios. For Rob's written research, check out ETFYourself.com.
On the date of publication, Rob Isbitts did not have (either directly or indirectly) positions in any of the securities mentioned in this article. All information and data in this article is solely for informational purposes. For more information please view the Barchart Disclosure Policy here.

/Micron%20Technology%20Inc_billboard-by%20Poetra_RH%20via%20Shutterstock.jpg)
/Qualcomm%2C%20Inc_%20logo%20on%20phone-by%20viewimage%20via%20Shutterstock.jpg)

/Abbott%20Laboratories%20vials%20and%20Logo-by%20Melniov%20Dmitriy%20via%20Shutterstock.jpg)