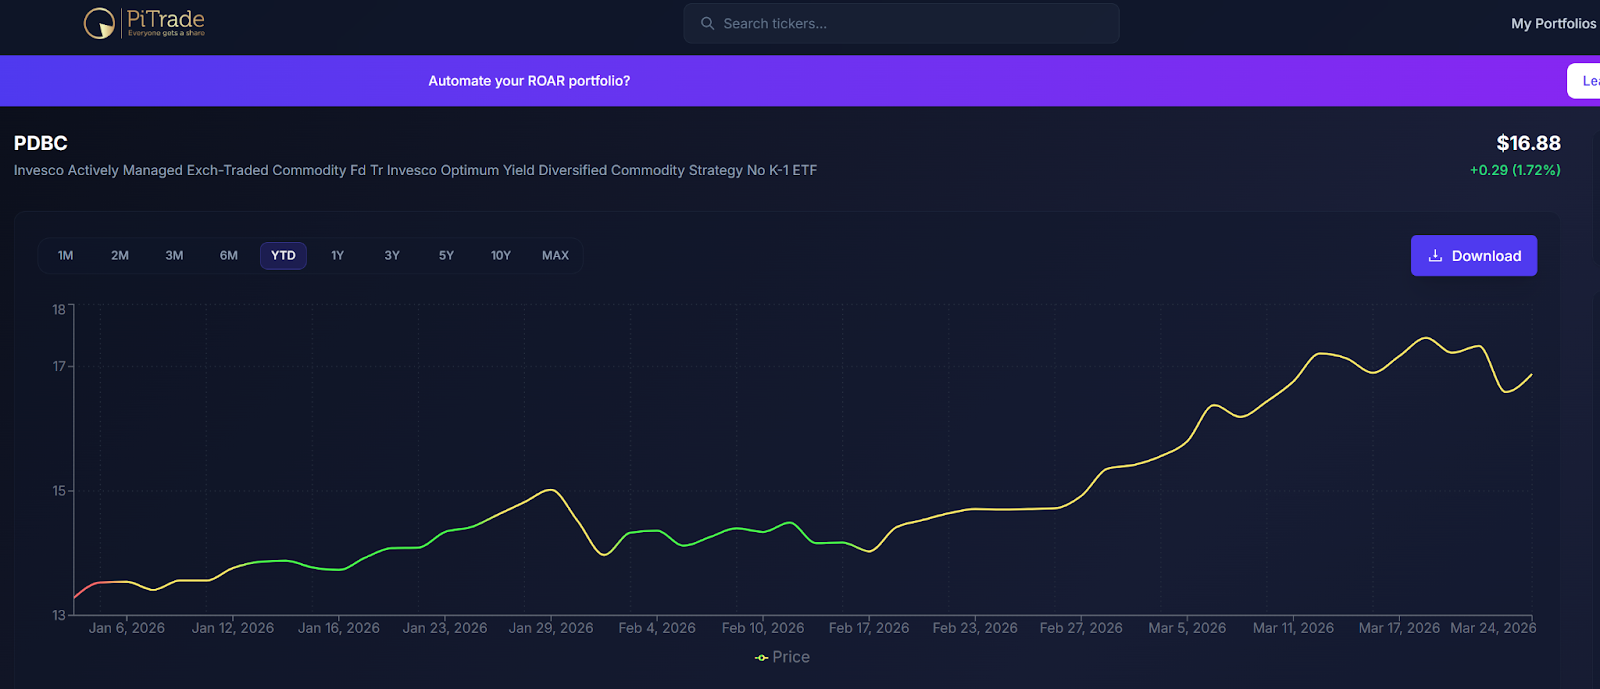
In the world of broad-basket commodity exchange-traded funds (ETFs) like the Invesco Optimum Yield Diversified Commodity Strategy (PDBC), my go-to in the peer group, in part due to its lack of a K-1, the past few weeks have delivered a "Strait Flush.” For those not familiar with poker, that’s a rare hand with a strong chance of winning. And for commodity investors, the effective closure of the Strait of Hormuz came at just the right time.
Just as gold (XAUUSD) and silver (XAGUSD) were polishing off their historic runs higher, the relay race continued, with the baton handed to oil (CBK26). That’s what happens every time war breaks out in the Middle East. But especially when Iran, a major producer and major combatant, is at the center of the action.
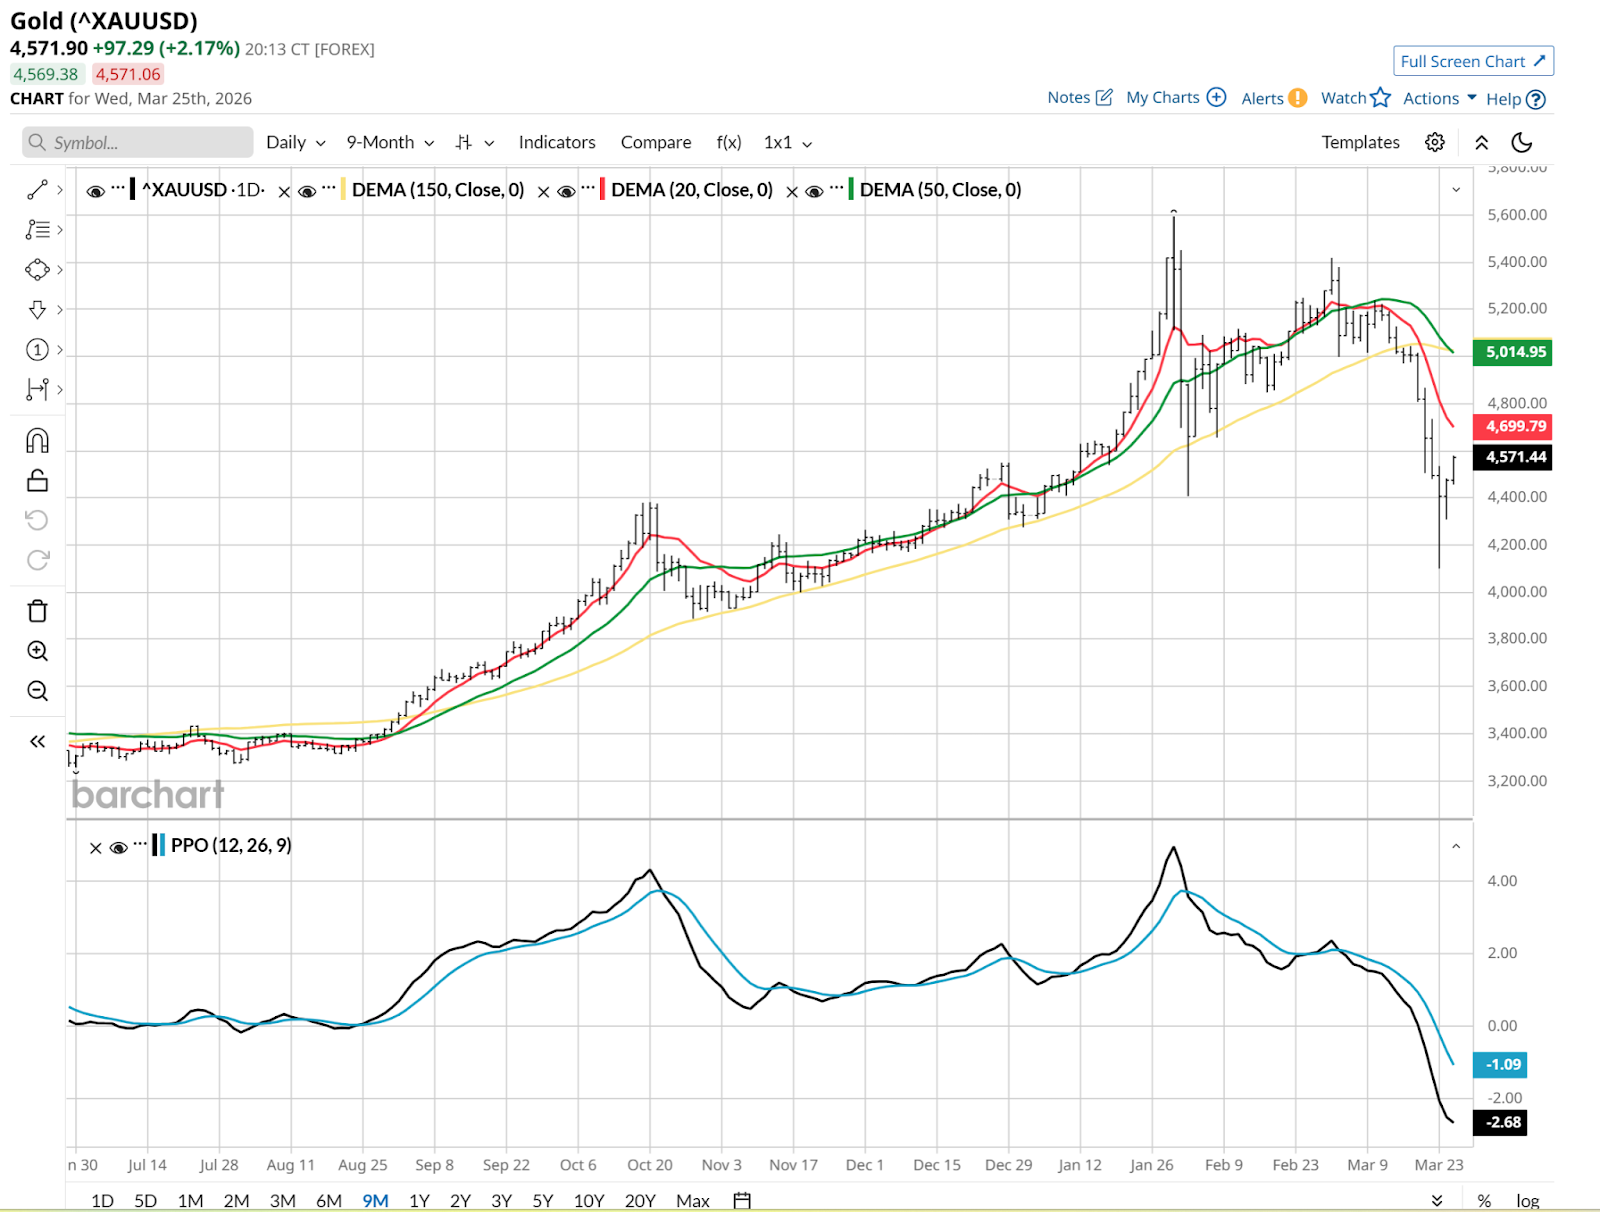
That is some run in gold, and even with the 20% pullback, it still is. $3,400 last June to Tuesday’s close shown above represents a more than 30% move in the yellow metal. Silver surged too.
But commodity ETFs like PDBC win twice, since gold is the largest single position. However, it is still only around 15% of the ETF’s asset base.
Energy in various forms is the largest holding by far. If you add up Brent crude, WTI crude (CLK26), gas, diesel fuel, natural gas, and gasoline, the total of those energy commodities is about 40% of PDBC. It was 50% a few years ago. So, that made the recent pop in oil and related commodities even more robust.
And, it is not just about fuel. Roughly one-third of the global urea (fertilizer) trade moves through the Strait. This is quietly pushing up the agriculture slice of the ETF, as rising energy costs translate directly into higher farming inputs. Those are the set of commodities shown toward the lower end of that allocation table.
Oil and Gold Mix, For Now
The "Strait Flush" in oil is currently masking the bust in gold. I’ve seen that in my daily ROAR score review, where ETFs like PDBC have remained in the yellow (neutral risk) zone longer than normal. That’s the gold/silver-to-energy handoff in vivid color. It allowed commodity ETFs to have a brisk second wind. And still, while the chart looks threatening now, the ROAR score is still hanging in at 50, a very neutral condition.
While a pure gold investor is down 20%, the diversified PDBC holder is seeing those losses offset by the 33% moonshot in energy. As a risk manager with smart diversification at the forefront of my work, this is a reminder that commodities can, at times like this, offer a different profile than stocks and bonds, as those two asset classes start to move more in sync — especially when both are dropping in price as they are in March.
This is because diversified ETFs hedge against different types of inflation. Gold protects against monetary debasement. Oil protects against the immediate supply-chain tax that is currently pushing PCE inflation forecasts toward 2.7%.
The Bottom Line
That said, it is not all in the chips for the commodity ETF trade. Commodities pay no dividends. In a high-rate environment where T-bills (BIL) are yielding nearly 4%, holding a stagnant or correcting basket carries a significant opportunity cost.
And perhaps most dangerous is the new risk that has befallen the commodity complex: as with silver recently, some of these markets are not liquid enough to handle their temporary surge in popularity. That can cause them to act like meme stocks. Pop… and drop. Like if Gamestop (GME) was covered in precious metals.
Until gold finds its floor and the Strait of Hormuz begins to see commercially credible traffic, the diversified commodity trade remains a treadmill. You are getting the protection you paid for, but the "Strait Flush" is only one hand. Seemingly moments later, you are back with a new hand. And it might cost you a chunk of what you made.
Rob Isbitts created the ROAR Score, based on his 40+ years of technical analysis experience. ROAR helps DIY investors manage risk and create their own portfolios. For Rob's written research, check out ETFYourself.com.
On the date of publication, Rob Isbitts did not have (either directly or indirectly) positions in any of the securities mentioned in this article. All information and data in this article is solely for informational purposes. For more information please view the Barchart Disclosure Policy here.
/Western%20Digital%20Corp_%20logo%20on%20sign-by%20360b%20via%20Shutterstock.jpg)
/PayPal%20Holdings%20Inc%20sign%20on%20building-%20by%20Sundry%20Photography%20via%20Shutterstock.jpg)
/Microsoft%20Corporation%20logo%20on%20sign-by%20Jean-Luc%20Ichard%20via%20iStock.jpg)

/Amazon%20-%20Image%20by%20bluestork%20via%20Shutterstock.jpg)