/Abbott%20Laboratories%20vials%20and%20Logo-by%20Melniov%20Dmitriy%20via%20Shutterstock.jpg)
It’s hard to look at Abbott Laboratories (ABT) without a sense of utter dread. That’s largely the consequence of ABT stock suffering a nearly 30% drop in value since the start of the year. Not surprisingly, the medical equipment specialist has “earned” an 88% Strong Sell rating from the Barchart Technical Opinion indicator. On the surface, it’s reasonable guidance based on the falling knives theory.
Further, the financial bullet points that got ABT stock into this mess are framed as problematic for investors. Primarily, the main concern centers on Abbott’s $23 billion acquisition of Exact Sciences. While management argues that the deal strengthens its long-term cancer diagnostics franchise, it also had to lower 2026 guidance because the acquisition would dilute earnings.
From a forward-looking perspective, ABT stock looks to solidify its footing on a key medical market. Unfortunately, investors generally prefer to avoid earnings dilution, especially when forking over a large acquisition premium.
Another headwind focuses on FreeStyle Libre growth concerns, which represents one of Abbott’s most important growth drivers. Recent results have demonstrated lighter-than-expected performance metrics, raising concerns that growth may be moderating from the explosive levels shareholders had become accustomed to.
Still, it’s worth pointing out that Abbott’s core business isn’t collapsing. After all, medical devices remain a key growth area and Abbott is still benefiting from structural trends in diabetes care and cardiovascular health. Essentially, the concern about ABT stock is aimed at the magnitude of expected growth rather than the underlying fundamentals.
Volatility Skew Offers a Nuanced Narrative
While the situation surrounding ABT stock looks dire, the smart money appears to be operating under a different framework. The key evidence comes from the volatility skew screener (specifically for the July 17 expiration date).
By definition, the volatility skew identifies implied volatility (IV) across the strike price spectrum of a given options chain. Since IV reflects the potential range of motion for a security, elevated volatility readings can be interpreted as an attempt to cover off the implied move.
Essentially, the skew is an insurance market, with sophisticated participants using both call and put options to either lever up on a potential upside swing or buy protection against a downward correction. Subsequently, these transactions at scale distort the skew from a perfectly level baseline to one that features magnitude increases or decreases.
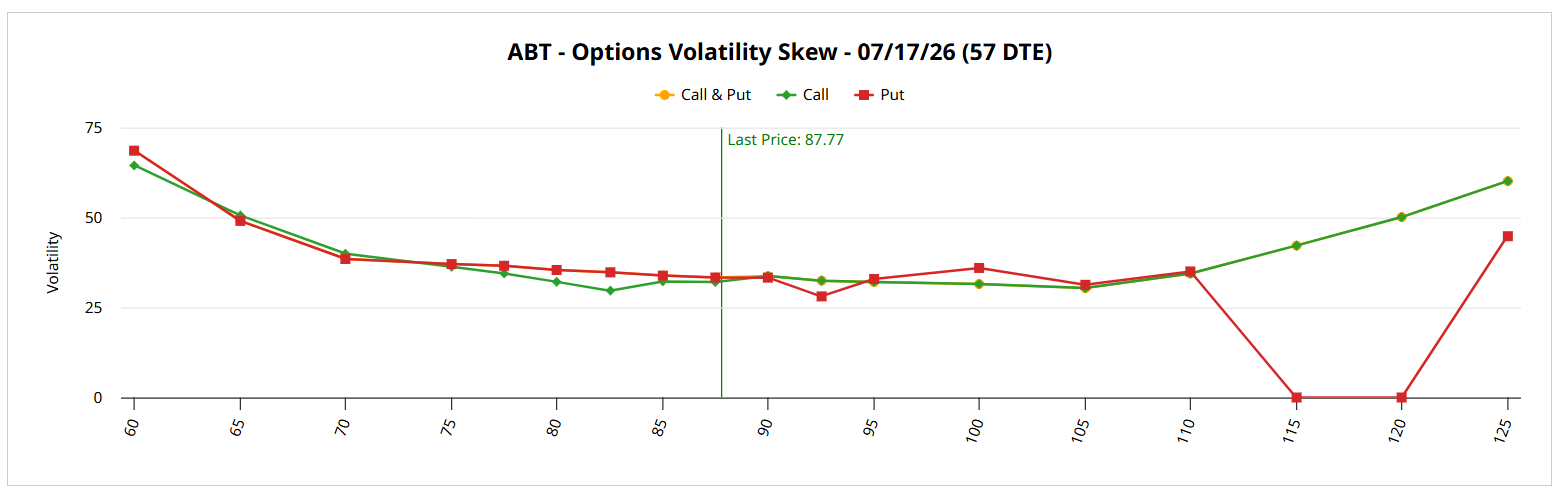
What’s most significant about the skew for ABT stock is that while there is a protective formation indicative of some downside fears, smart money traders are also pricing for upside convexity. A key feature is the call wing (on the right side), which features call dominance relative to puts and is thus not indicative of an overtly fear-based skew.
To use simple terms, sophisticated players recognize that there is risk involved in ABT stock. At the same time, they also recognize that there is a possibility of a significant rebound — and they don’t want to not have exposure in case it rips.
A High Probability Move?
Now, it’s also important to realize that the smart money isn’t always prescient. The label ‘smart’ comes from the underlying transactional sophistication. It then raises the question, just how probable is a recovery trade in ABT stock?
We can attempt to answer this question through triangulation. One of the unique technical characteristics of ABT stock is that in the past 10 weeks, it has printed only two up weeks, thus leading to a downward slope across the period. This unique quantitative sequence has only materialized six times (on a rolling basis) since January 2019.
Granted, a sample size of six is not something that you want to hang your hat on in any scientific environment. However, in a non-deterministic system like the equities market, there’s a chance that the observed tendencies following this quant sequence will align with what may happen over these next 10 weeks.
In that case, the median clustering under the aforementioned quant signal may place ABT stock around the $97 mark by the July 17 expiration date. Assuming the correlation — and that’s a big flipping assumption — I would look at the 92.50/95 bull call spread expiring July 17 as tempting.
You would need ABT stock to rise through the $95 strike at expiration for the trade to be fully profitable. The good news here is that the net debit per spread is only $105, which makes it intriguing from an overall risk management perspective.
On the date of publication, Josh Enomoto did not have (either directly or indirectly) positions in any of the securities mentioned in this article. All information and data in this article is solely for informational purposes. For more information please view the Barchart Disclosure Policy here.
/A%20concept%20image%20showing%20a%20lightbulb%20with%20planet%20earth%20in%20a%20mossy%20green%20background%20by%20Capt_Pic%20via%20Shutterstock.jpg)

/The%20CrowdStrike%20logo%20on%20an%20office%20building%20by%20bluestork%20via%20Shutterstock.jpg)

/An%20image%20of%20a%20Tesla%20humanoid%20robot%20in%20front%20of%20the%20company%20logo%20Around%20the%20World%20Photos%20via%20Shutterstock.jpg)