
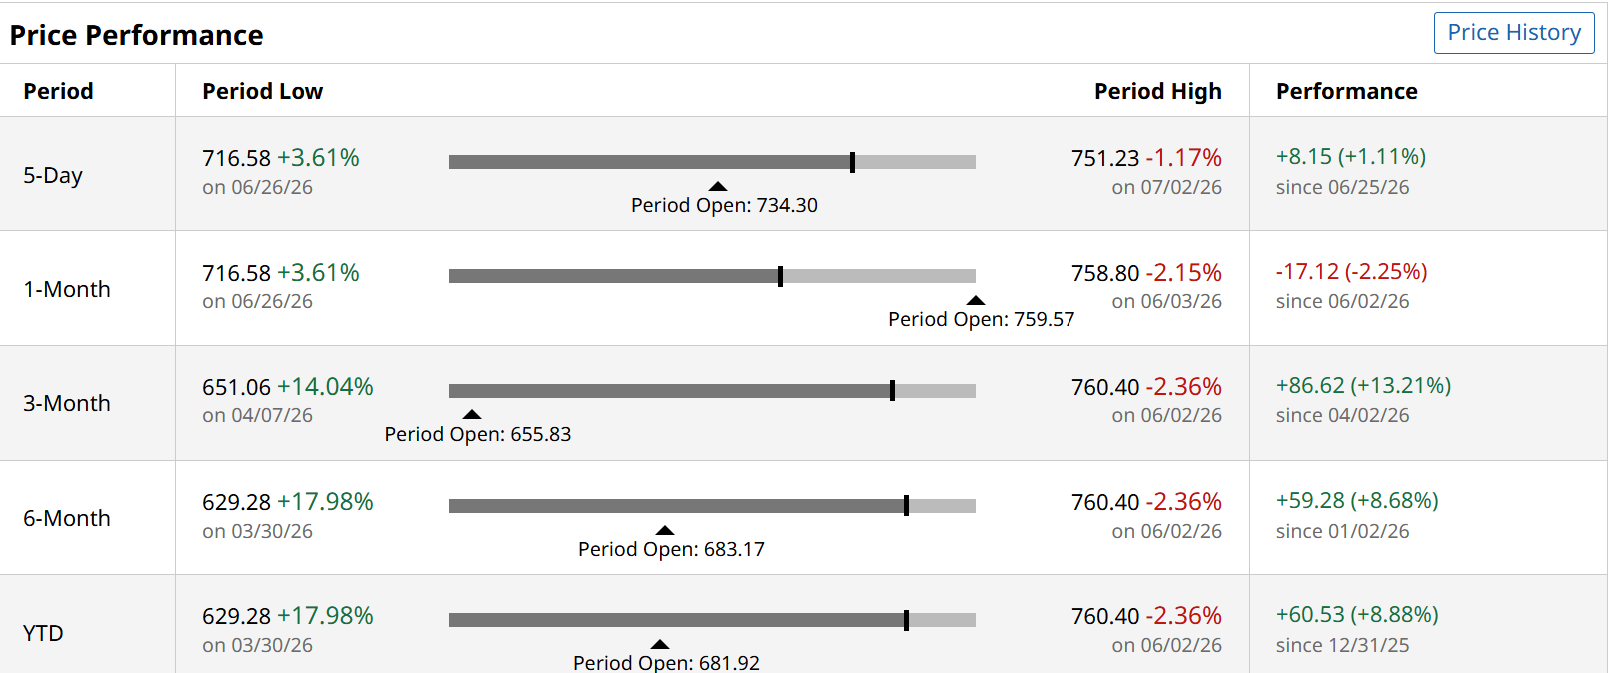
Here’s how the S&P 500 ETF (SPY) looks a couple of trading days into the second half of 2026.
After a second quarter that saw the index rally around 15%, following a first quarter in which it lost more than 4%, the playing field has been left with a scattered group of winners and losers.
It was the S&P 500’s best quarter since 2020, when it lifted off once the Covid-19 pandemic’s impact was judged to be something less than the end of the world.
Since we know that a trend can be our friend, and also that dips are bought and contrarian investors (including me) still prowl around the stock market, let’s check out the biggest winners and losers in the just-completed second quarter. Perhaps there are some gems to identify for this July-September period.
As an active market navigator, I refuse to let a top-heavy, cap-weighted average obscure reality. While the headline index is “riding the wave,” a look at the actual data shows a house divided in S&P 500 ($SPAA) land. Because this historic rally wasn’t driven by a healthy, broad-based economic expansion; it was powered almost entirely by an intense, localized hoarding of capital into a single theme.
Where Do S&P 500 Winners and Losers Come From?
To understand what actually happened in the second quarter, you have to look at the massive disparity between the companies that surged and the companies that got left behind.
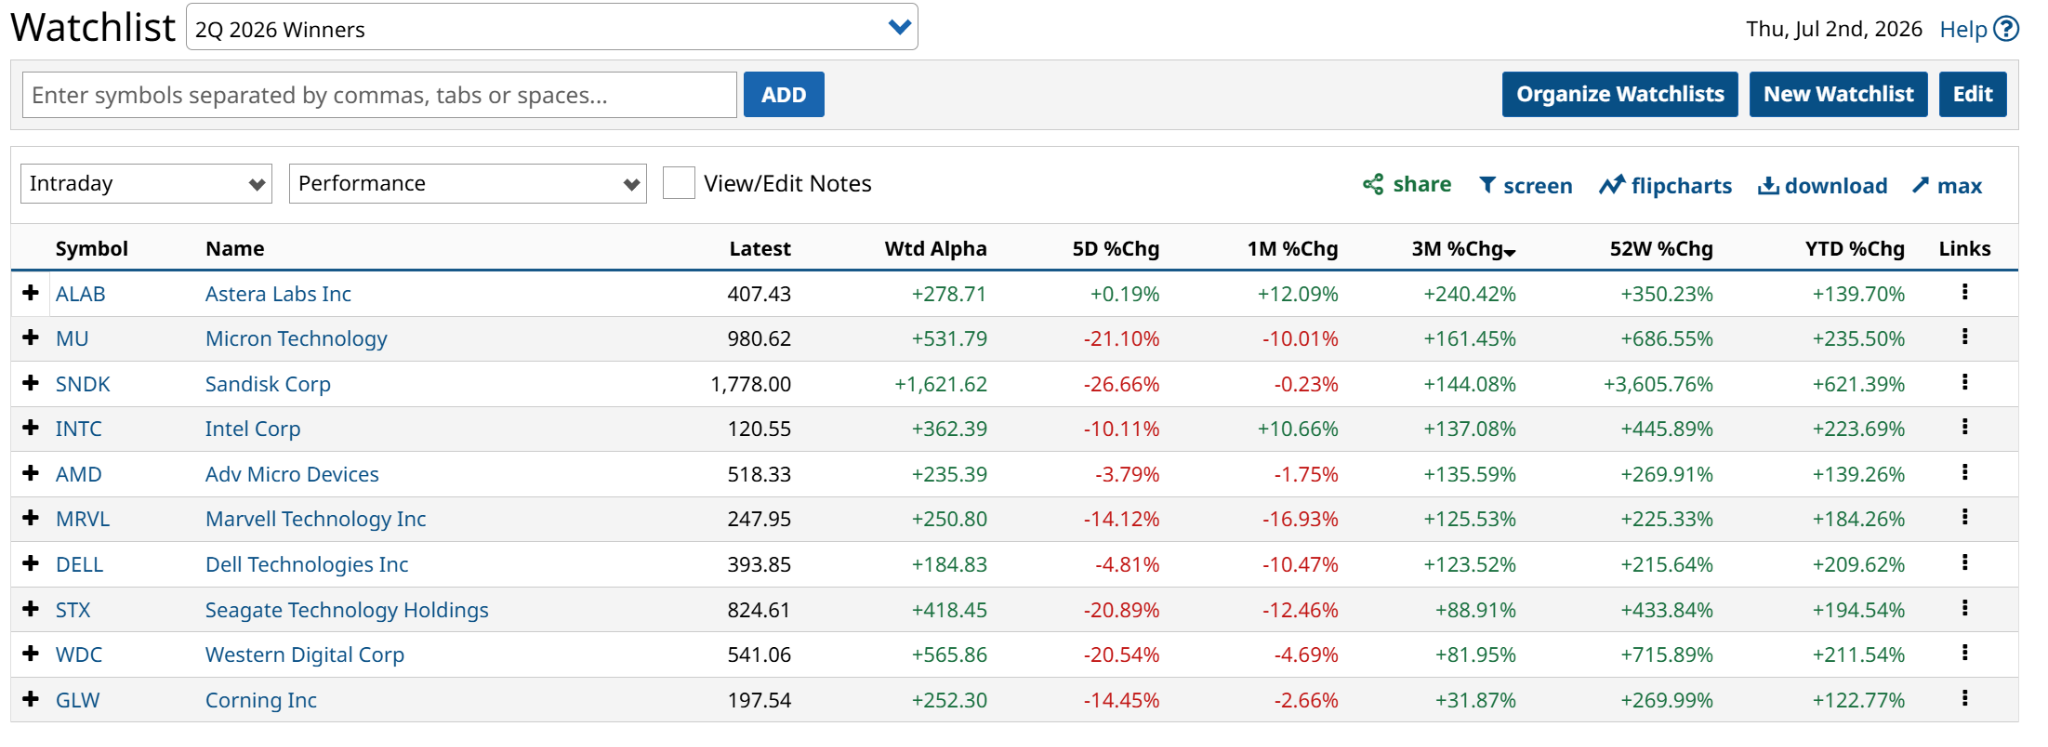
The absolute champions of the quarter were the businesses tied directly to the raw, physical infrastructure powering artificial intelligence. Memory manufacturers, chip designers, and server builders captured the overwhelming majority of market gains. The market aggressively rewarded hardware makers with immediate tangible factory demand. Here are the top 10 performers from the quarter.
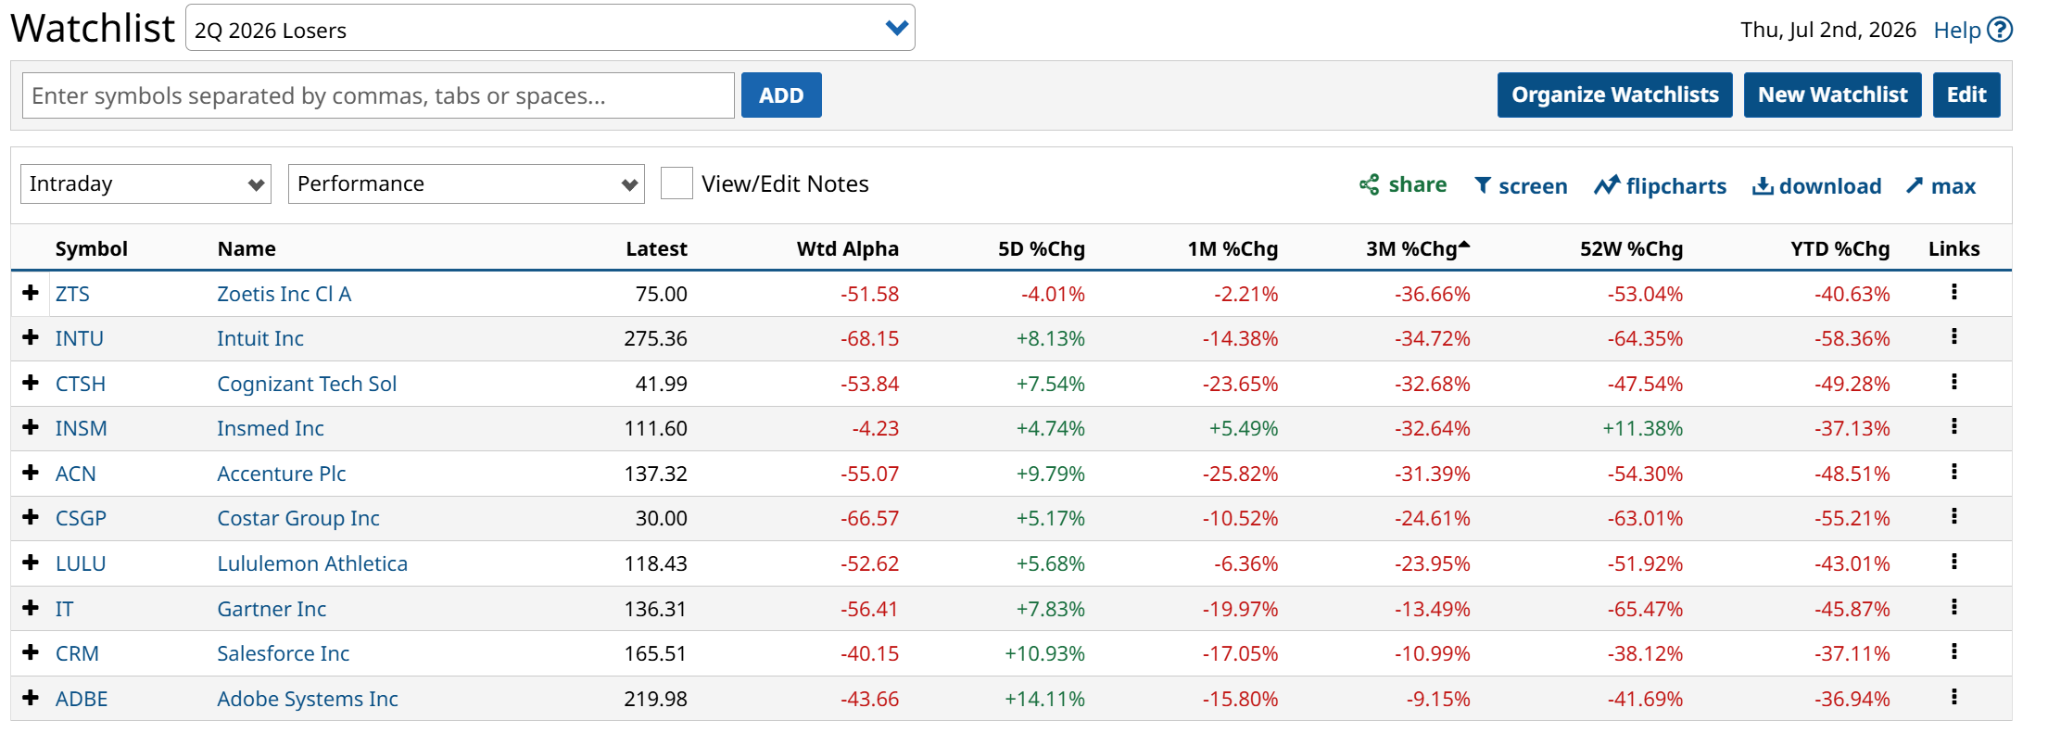
The Losers Bracket
Conversely, the companies that suffered severe distribution waves were largely tied to legacy application software, corporate IT services, and traditional consulting. Giants like Intuit (INTU) (-39.64%) and Accenture (ACN) (-37.24%) were ruthlessly sold off. The market penalized these firms as corporate enterprise budgets were cannibalized to pay for expensive data center hardware, leaving traditional software and integration services starved of growth capital.
This tells us that the tide is no longer lifting all boats. The market has quickly transitioned during the first half of 2026. It is more selective, but mainly when it comes to answering one question: will you benefit from AI or be harmed by it? The problem for traders is that the volatility associated with these market-driven choices is far more volatile in terms of portfolio impact than I can recall seeing in some time.
We can’t change that predicament. And as an ardent believer in portfolio hedging, the focus here is to see which of these 20 stocks that landed on the winners or losers list strikes me as particularly attractive for Q3. I charted them all, and here’s what I found.
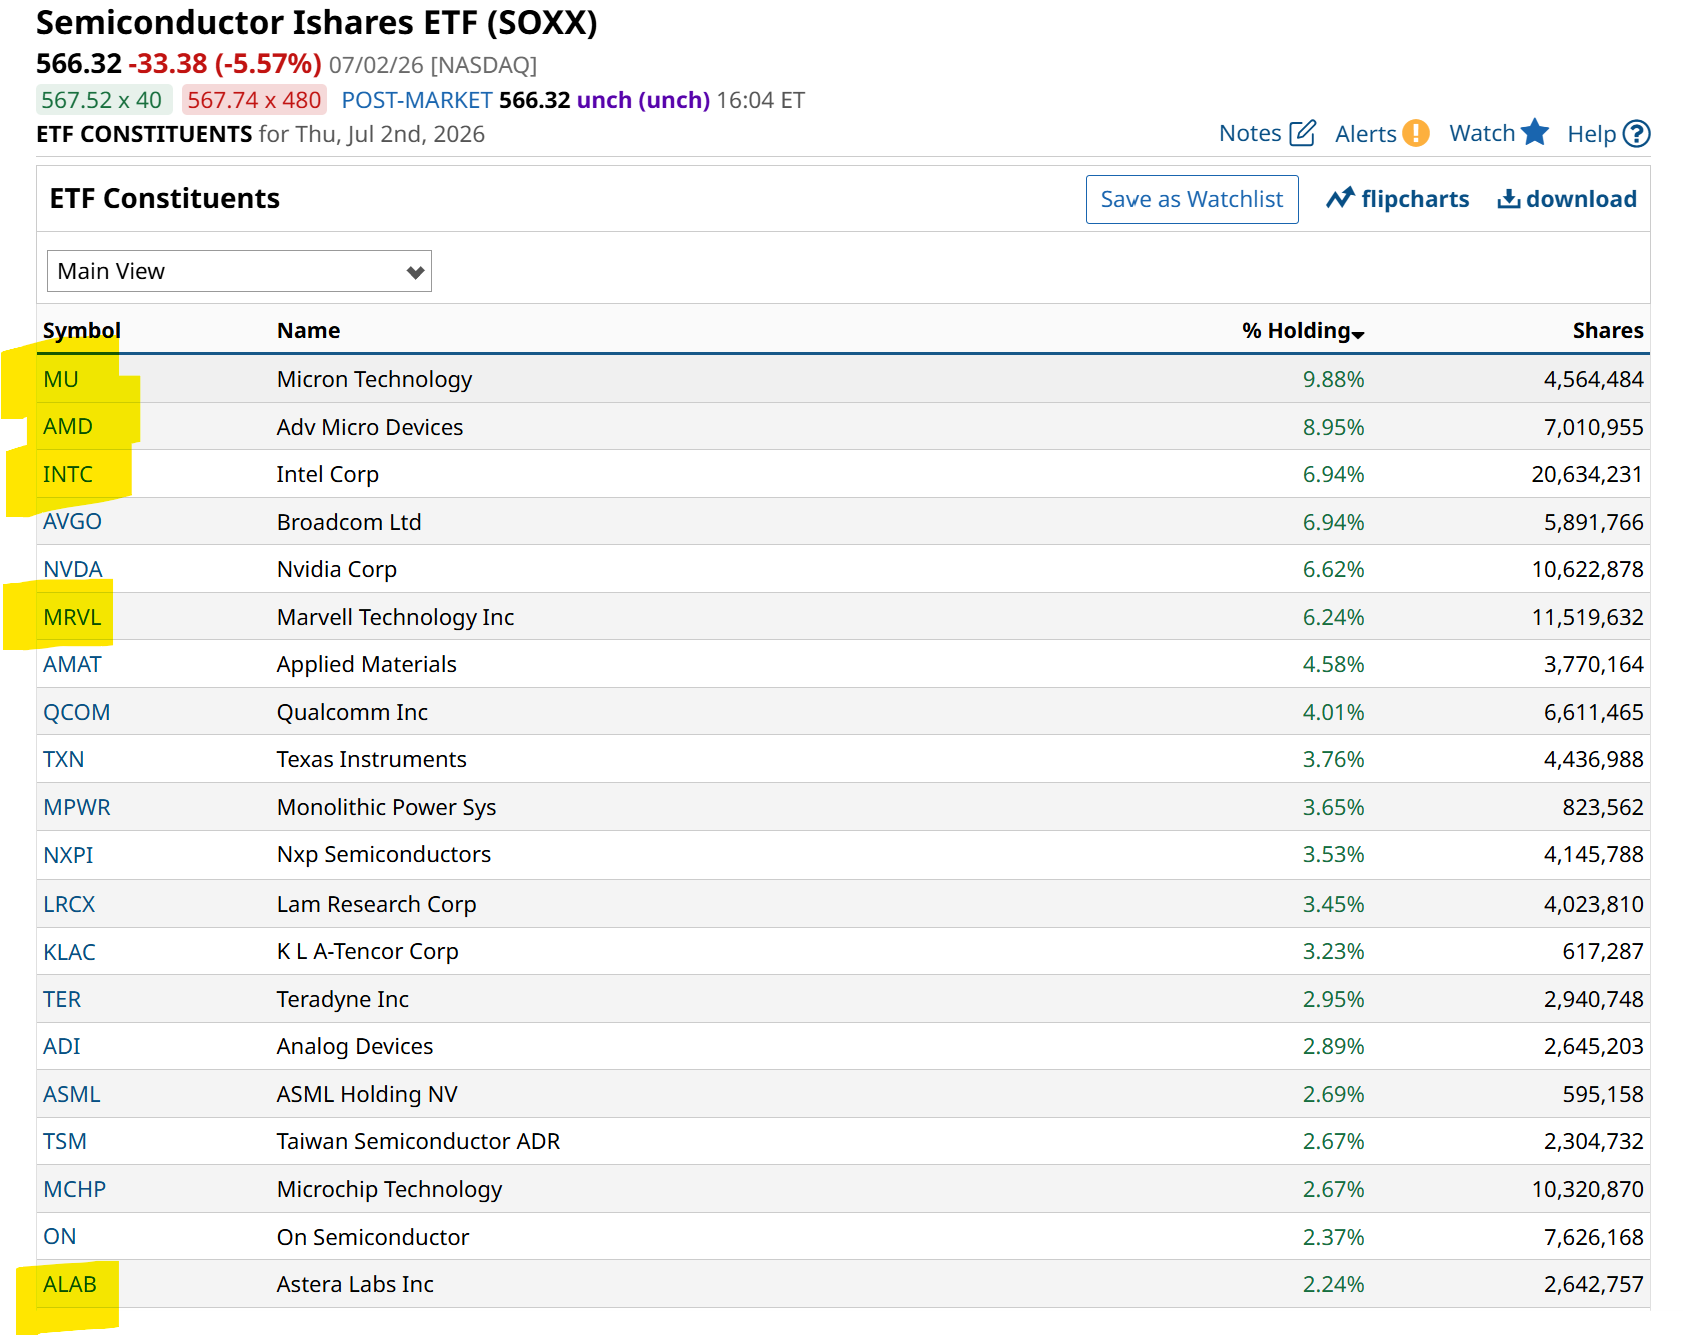
First, from the winner’s list, I can say that while a big bounce is always possible, I see a more likely period of “lower lows and lower highs” in nearly all of those AI- and chip-related names. And as you might have guessed, if we want a shortcut, an ETF-centric way to isolate that group, the iShares Semiconductor ETF (SOXX) is a good one to do so.
As is the VanEck Semiconductor ETF (SMH), the other big, cap-weighted semiconductor fund, although that one has a combined 27% stake in Nvidia (NVDA) and Taiwan Semiconductor Manufacturing (TSM), which were further down on the list of Q2 winners. Here’s SOXX, with holdings from the top 10 list highlighted in yellow.
I always aim to find shortcuts for readers, so here’s one. I can tell you that the chart of SOXX looks a lot like most of the 10 winner charts. Here it is.
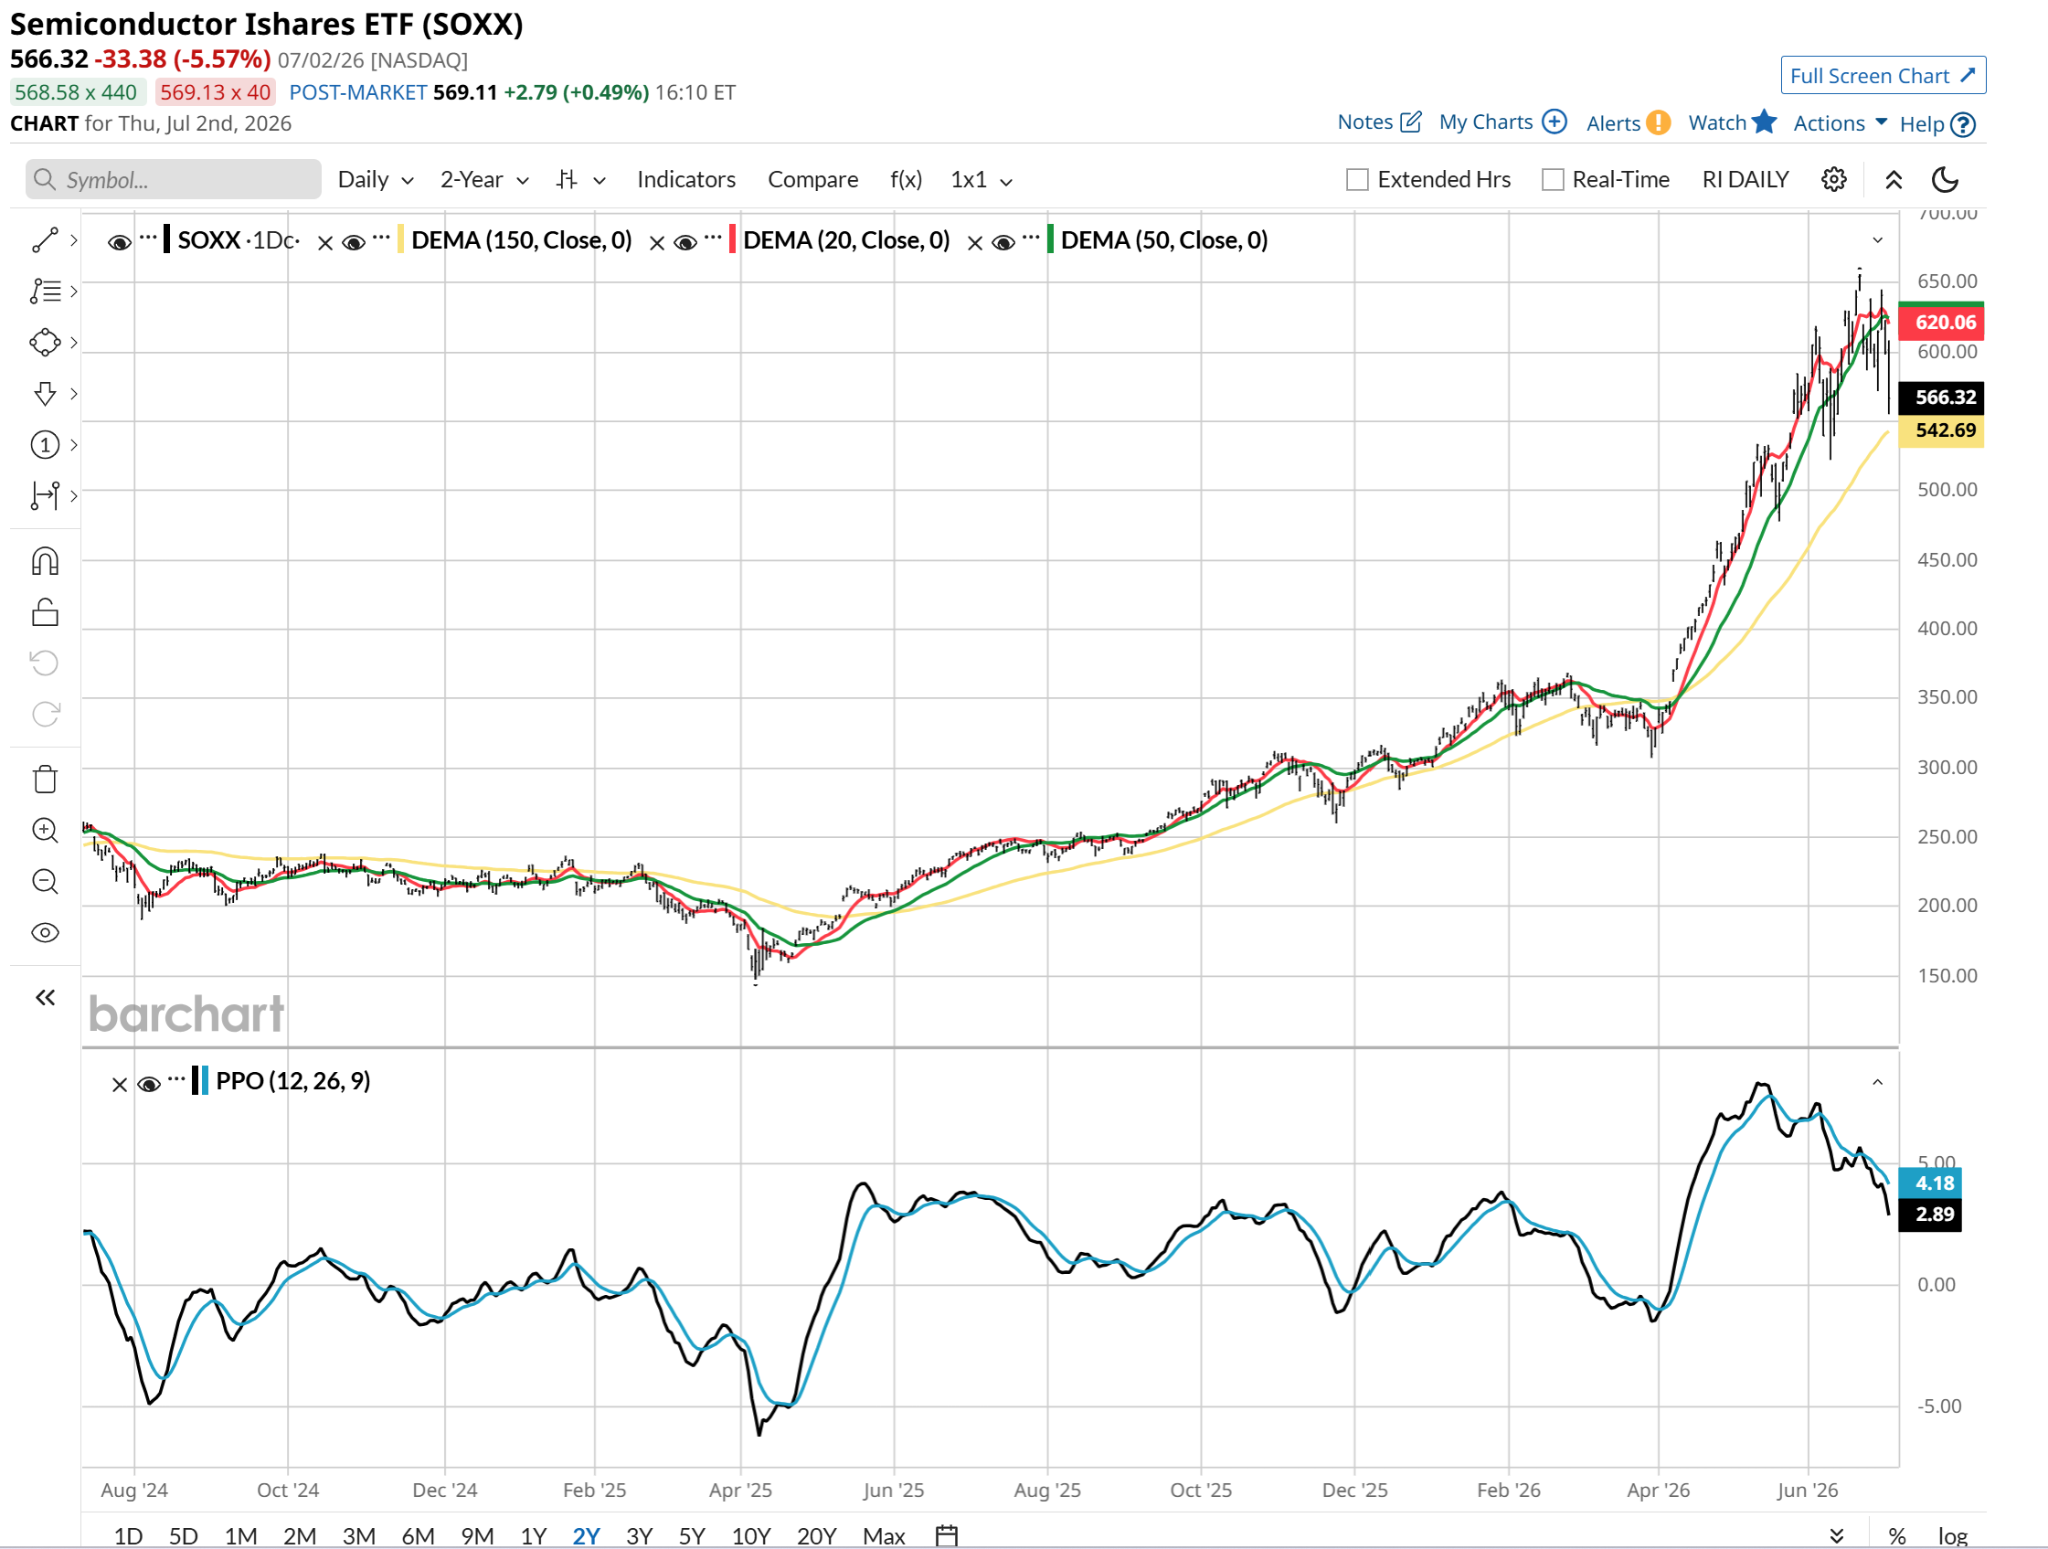
However, if we look at both the fading “down the stairs” pattern in the percentage price oscillator (PPO) indicator at the bottom of the chart, and the pending breakdown of the 20-day moving average, SOXX, and thus most of Q2’s big winners, look like they are about to provide a mirror image soon. Be very careful here. There could be more days like Thursday’s more-than-5% spill coming.
The losers list is more diffuse, although it does include several software names from the iShares Expanded Tech-Software Sector ETF (IGV). However, beyond that ETF as a bounceback consideration, I’ve spent so much time here talking about what looks dour in the charts, I have two choices: take a hot shower to get the market dirt off of me, or provide a couple of sharp-looking stock charts that have a fighting chance to rebound. I’ll do the latter.
As with many of these recently diminished stock prices, the charts are more of a high-risk, high-return proposition. Adobe (ADBE), like many on the losers list, shows a PPO upside crossover, and the stock has gained more than 15% from its recent low.
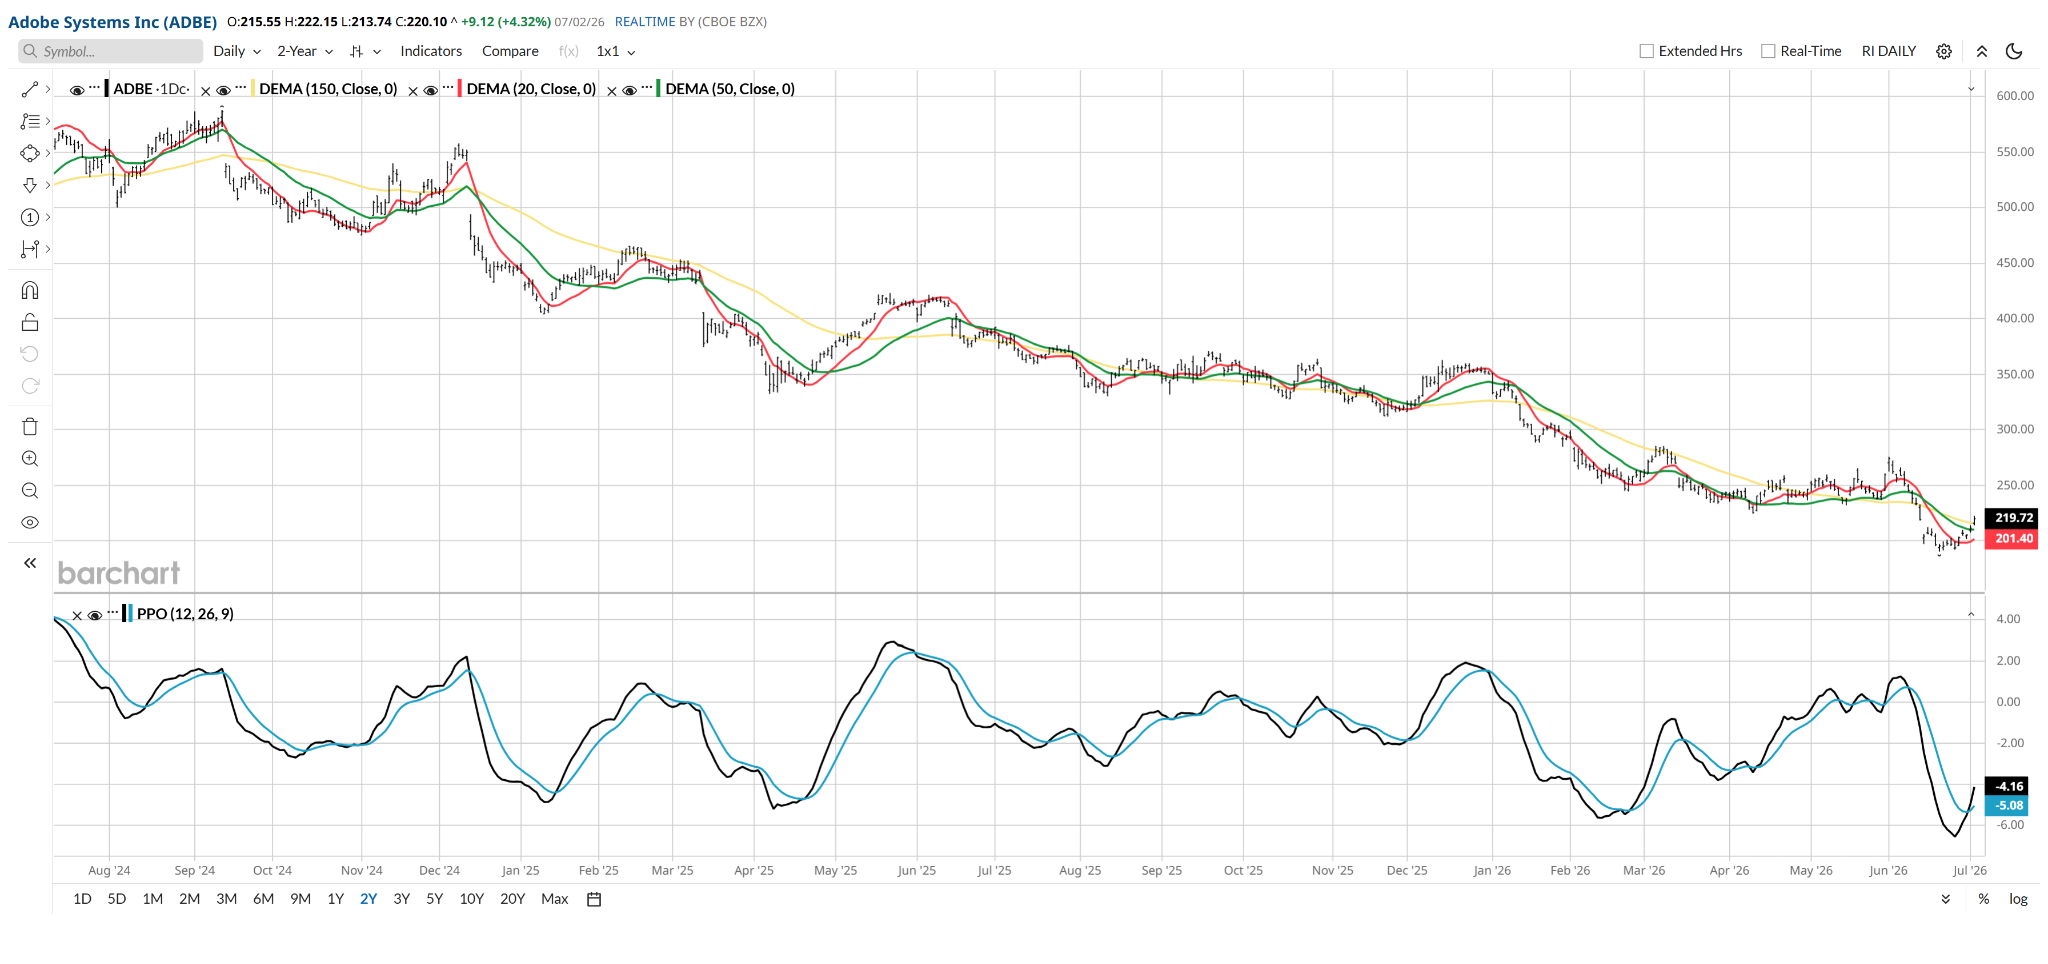
You can’t easily tell that because it fell below $200 from nearly $600 less than two years ago! That type of move makes a bounce hard to view. That’s why the indicators I show here help to see through the drubbing. Salesforce (CRM), a peer stock from that software group, looks very similar.
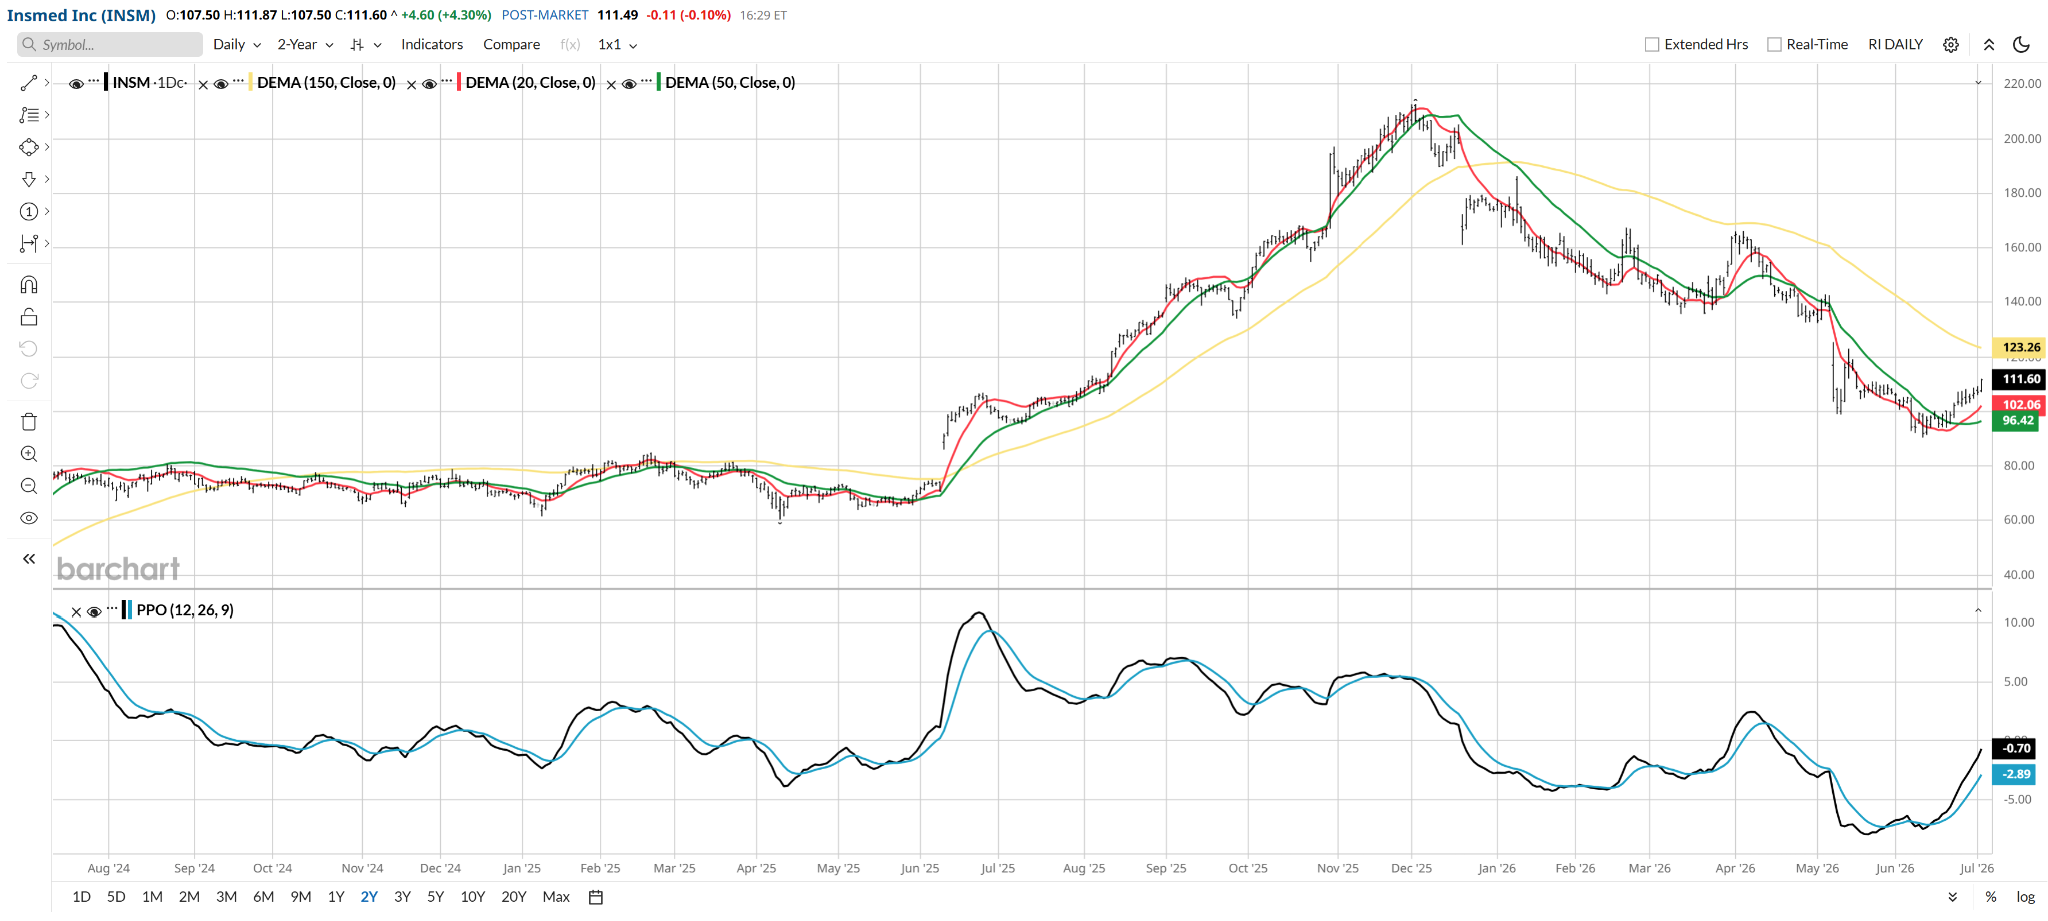
What Insmed (INSM) has going for it is that its chart indicates some sustained effort for traders to nudge it higher. That’s a much “cleaner” picture to me, of a stock trying to break a severe downtrend that cut it
Finally, there’s Lululemon (LULU). It is not an AI stock. But it sure has traded like a software name.
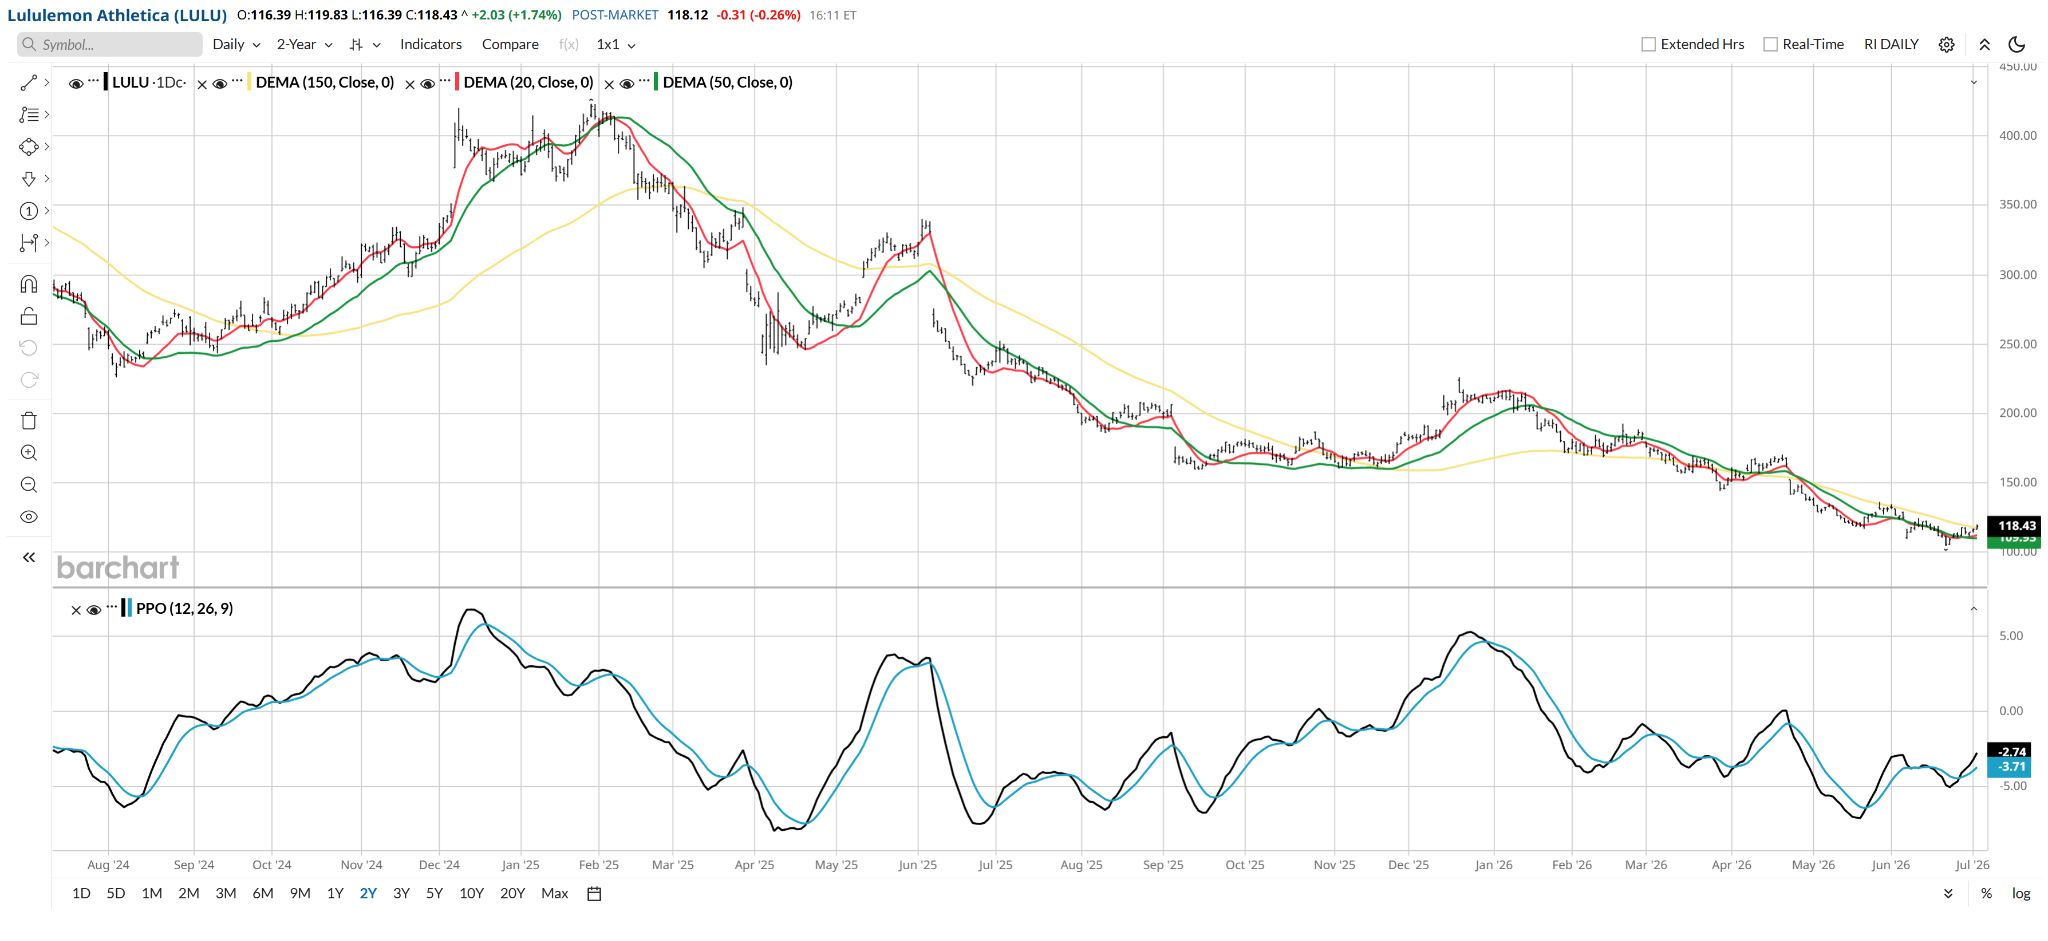
It shows a faint but real sign of a bullish trend, based on that PPO having successfully executed a higher high. I know, it is not much. But beggars can’t be choosy in this market. LULU also sells at only 10x forward earnings.
After the flip-flop in the S&P 500’s return through the first two quarters of 2026, traders should be focused more on reversals of fortune than simply counting on the trend being their friend. These are very strange times, and history tells us that while the punch bowl is out and the party is raging, the market cops can bust it up at a moment’s notice.
Rob Isbitts created the ROAR Score, based on his 40+ years of technical analysis experience. ROAR helps DIY investors manage risk and create their own portfolios. For Rob’s written research, check out ETFYourself.com.
On the date of publication, Rob Isbitts did not have (either directly or indirectly) positions in any of the securities mentioned in this article. All information and data in this article is solely for informational purposes. For more information please view the Barchart Disclosure Policy here.
/Microsoft%20headquarters%20By%20Peter.jpeg)
/Micron%20Technology%20Inc_%20logo%20on%20building-by%20vzphotos%20vis%20iStock.jpg)
/NVIDIA%20Corp%20logo%20outside%20building-by%20BING-JHEN_HONG%20via%20iStock.jpg)
/Amazon%20-%20Image%20by%20bluestork%20via%20Shutterstock.jpg)