My late father, who was my very first investing mentor, taught me a couple of golden rules that apply perfectly to the current semiconductor mania:
- You never know how high a stock will go.
- You never know how low a stock will go.
Over the past few years, the market has treated us to a heavy dose of upside, pushing semiconductor and artificial intelligence heavyweights to historic valuations.
But markets are entirely capable of going parabolic in either direction. While the financial media remains focused on the spectacular gains of the recent past, my technical chart work is flashing a much darker message. The semiconductor industry has become so wildly overextended and concentrated that it is perfectly positioned to undergo a massive mean-reversion event that could easily wipe out 50% of its value from here.
I’ll zero in on the iShares Semiconductor ETF (SOXX), which at nearly $40 billion in assets is the behemoth of the space. It owns 35 stocks, but 10 of them make up more than 60% of assets.
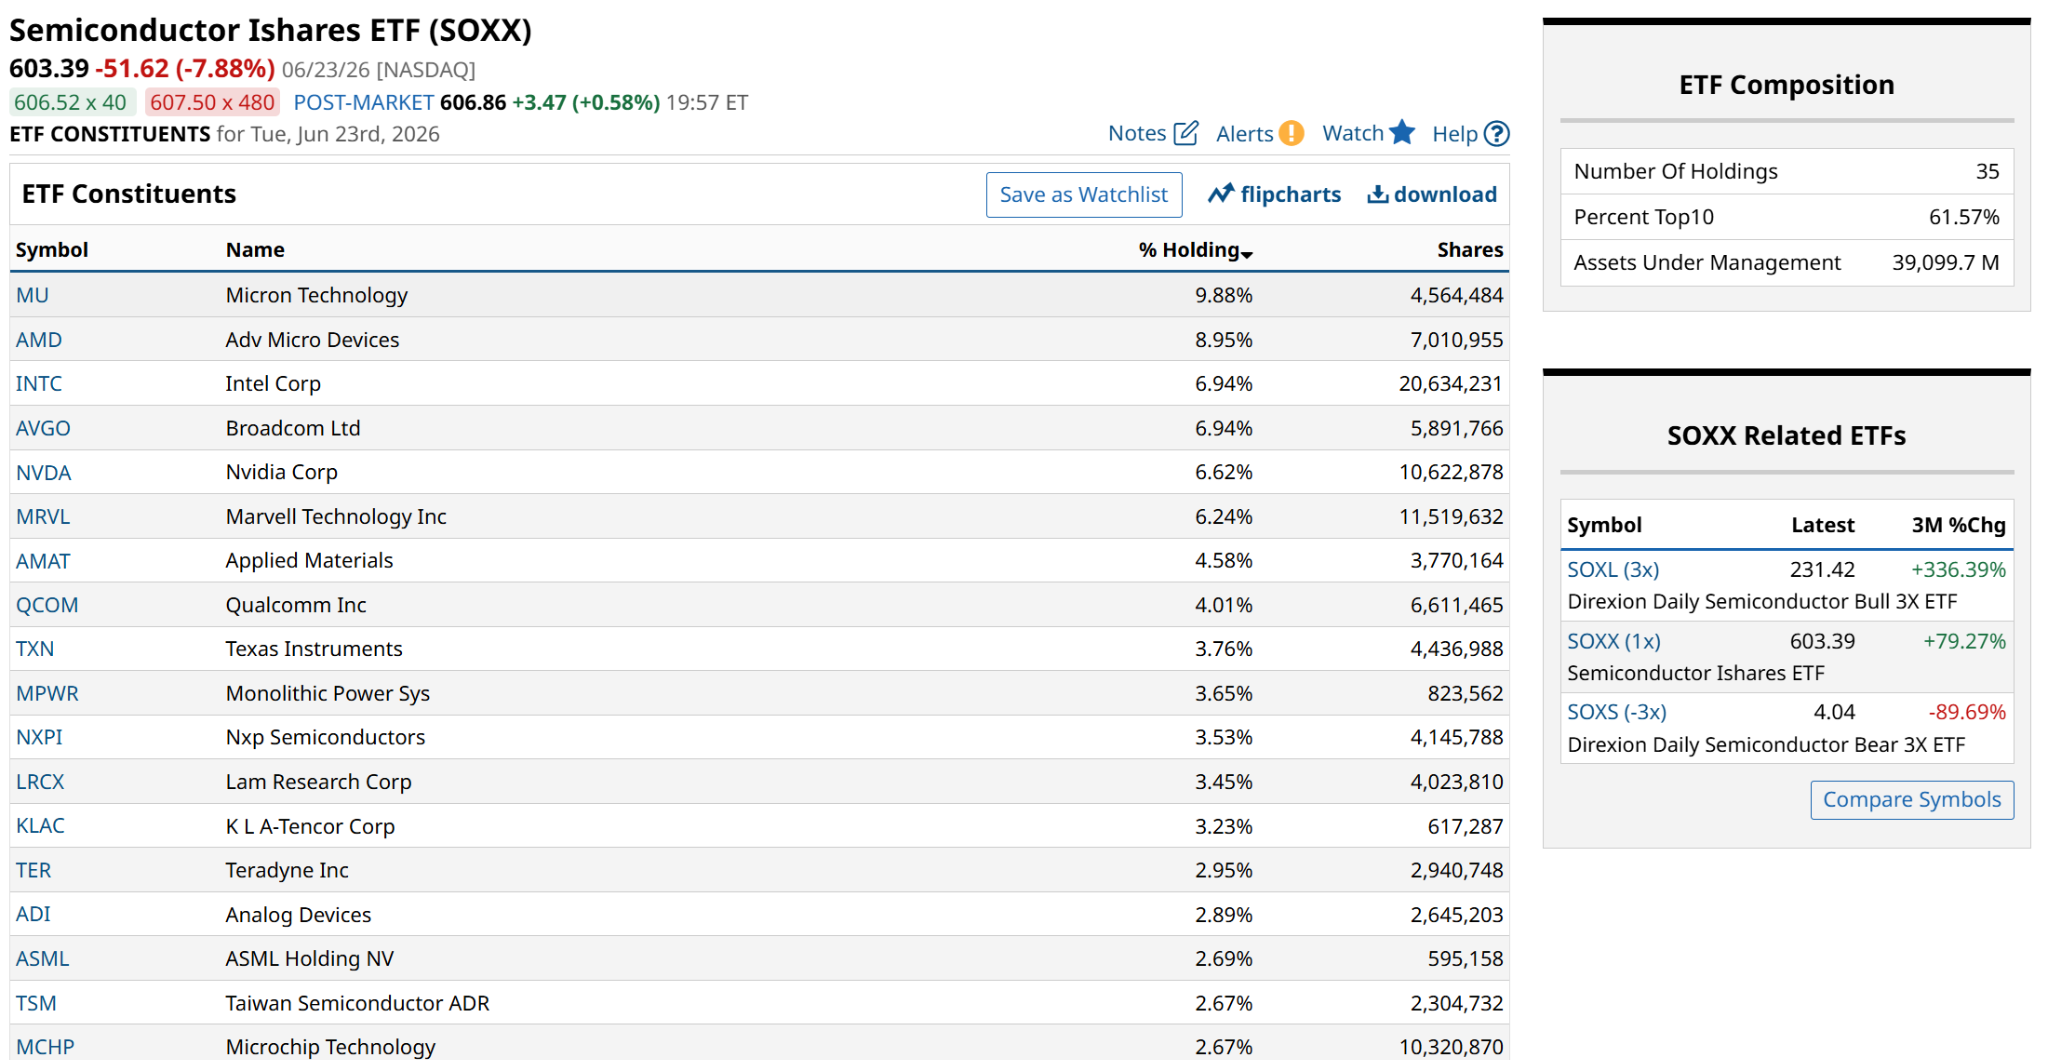
That has a cost, and the cost is very high valuation. Here are SOXX’s current holdings, sorted by lowest to highest trailing price-earnings ratio. Just three of them are below 30x and only six are below a 40 multiple. I listed 17 here, about half of the portfolio, so as to generate a visual “median P/E ratio” for SOXX. It is 70x!
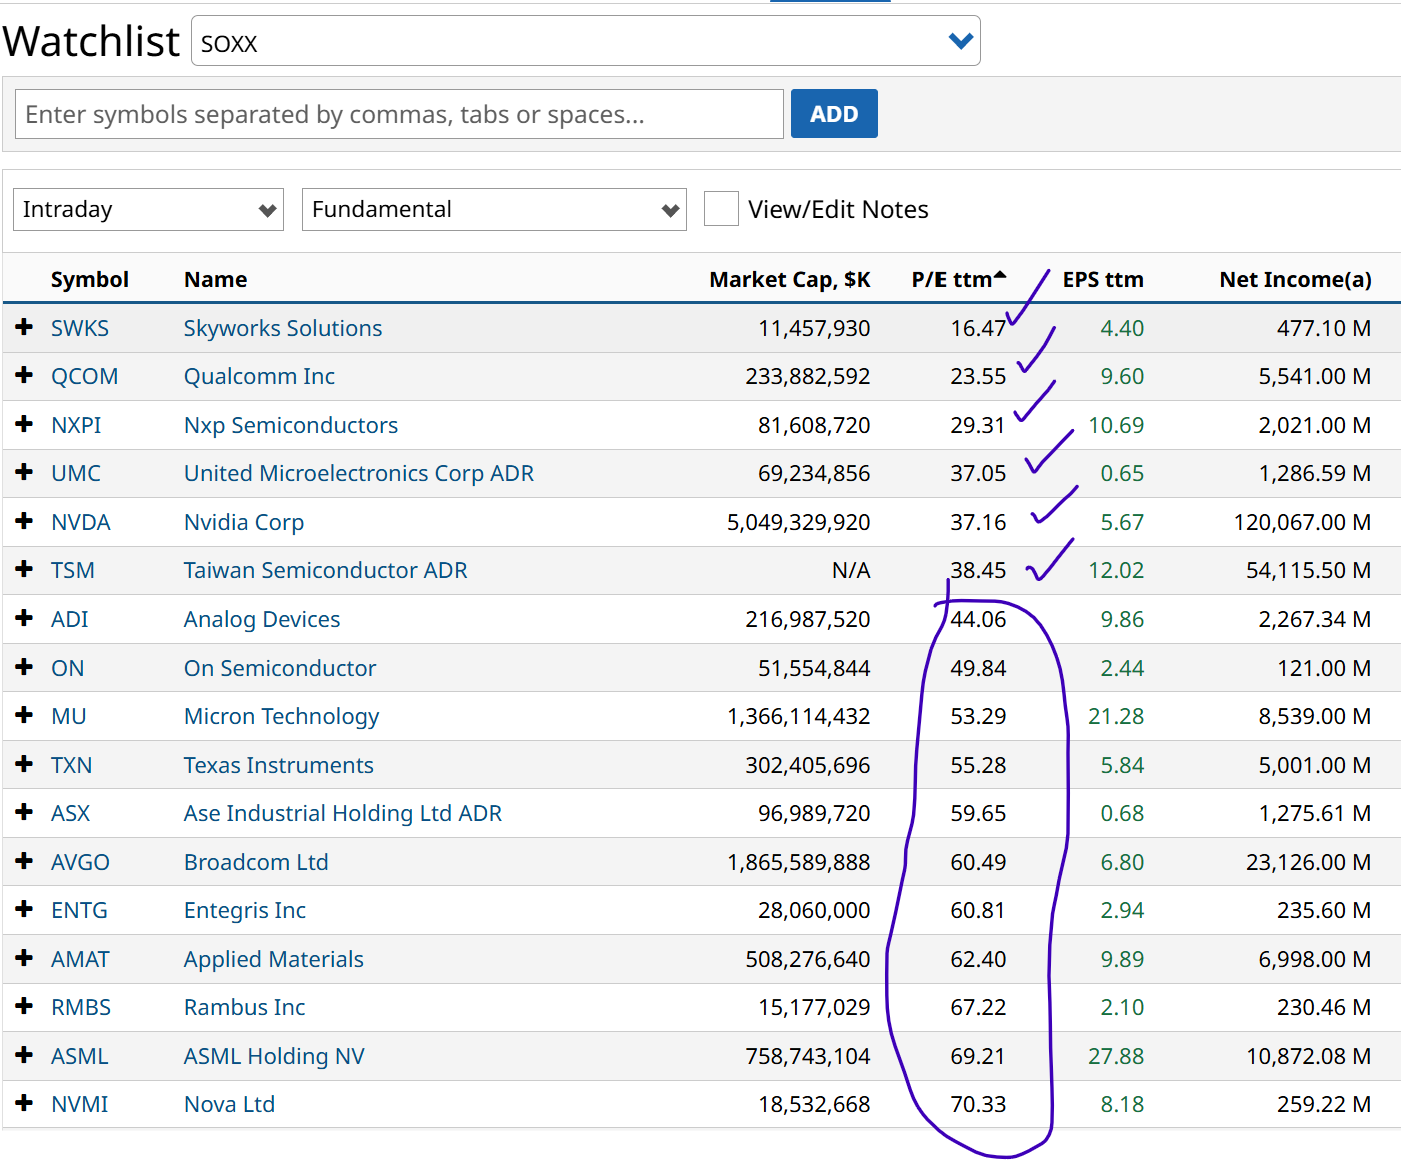
I know that earnings growth should be huge here. However, this shows us just how high the expectations, and therefore the stakes, are.
SOXX’s chart is not nearly as bad as many I see. However, that could be an optical illusion, and the price action in this ETF since early April (about a double) can alter the usefulness of even the sharpest technical tools.
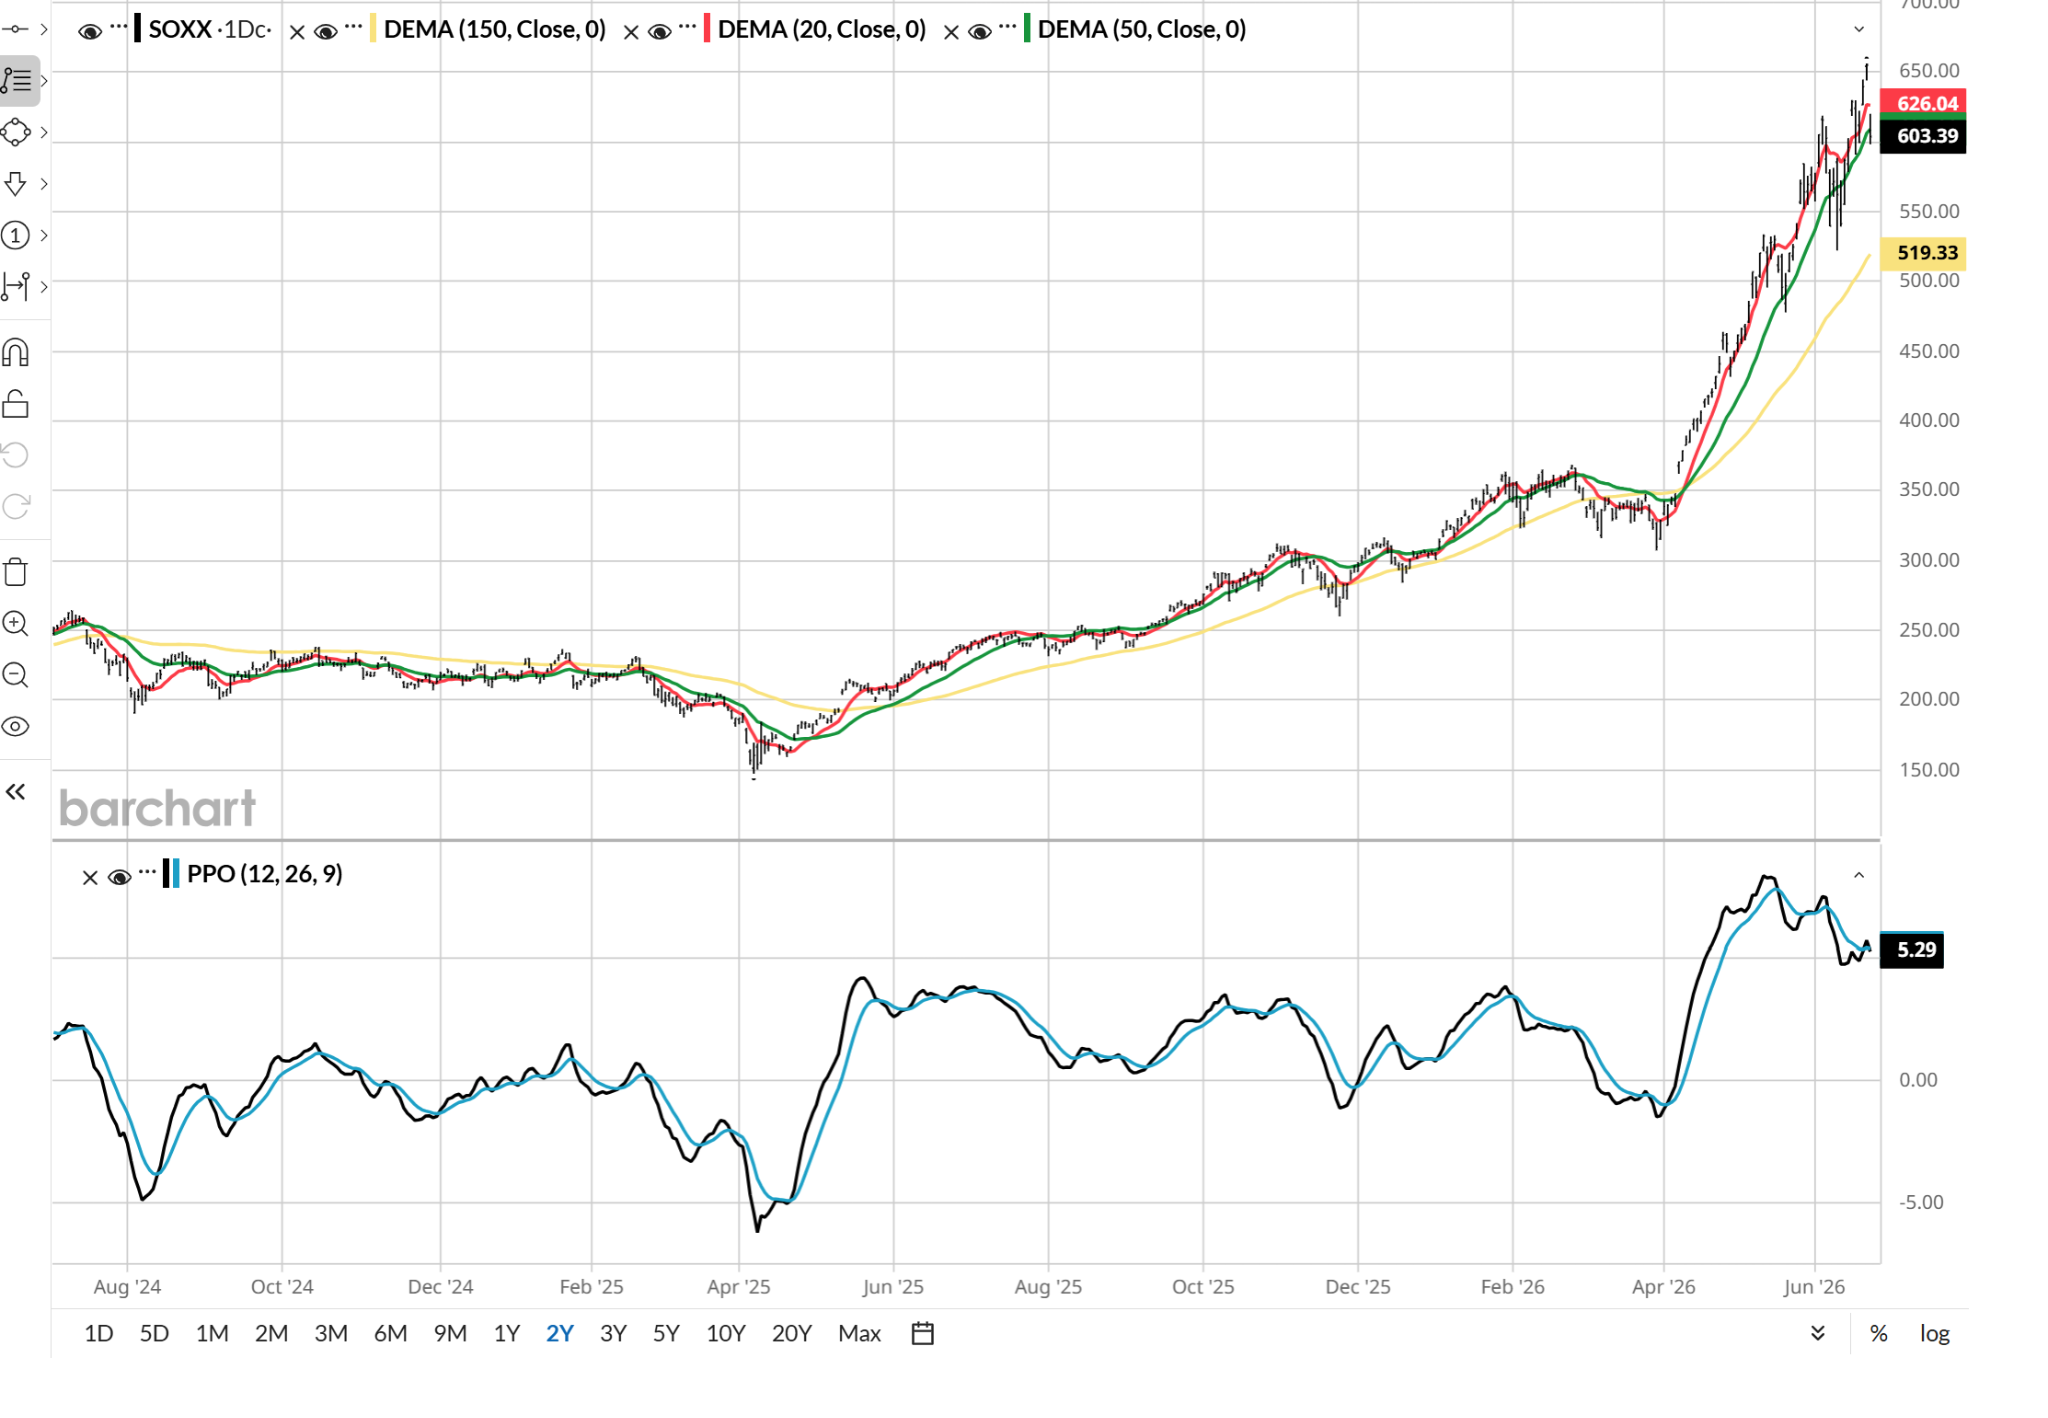
This industry is truly in uncharted territory. Just look at how Tuesday’s nearly 8% selloff is not even visible on this daily chart. That’s remarkable, visually speaking, from a guy who’s looked at millions of charts on Barchart.com over the decades. These are truly unusual times for traders and investors.
Could SOXX Drop 50% from Here?
The short answer is yes. In round numbers, SOXX closed around $600 on Tuesday. A 50% decline would produce a “target” price of $300. The ETF closed at $310 a share on March 30.
To be realistic about the range of possible outcomes, we have to look past the corporate press releases and study the setup of the charts.
For years, trillions of dollars in passive index inflows and momentum-chasing capital have been forced into a tiny, elite circle of chipmakers. This has created a feedback loop that I’ve referred to here before as the “passive flow trade,” a phrase I borrowed from Simplify Asset’s Michael Green, who has studied the indexation of the S&P 500 ($SPX) for a long time.
As these stocks’ prices rise, their market cap weight inside major index products expands, forcing the next wave of automatic 401(k) money to buy even more shares. But this has pushed momentum indicators to levels that historically precede cyclical bear markets.
This is the biggest test I think we’ve seen for the “buy the dip” mantra. We are in an environment that has transitioned from a market where dips are reflexively bought to one where rallies are being aggressively sold. I see it in daily trading activity. I just do not know yet if it is a sustained shift or yet another false alarm. I think we’ll know soon.
How to Play It
The euphoric run in semiconductor stocks has spawned an unprecedented number of ETFs. While most of them aim to goose the already high returns we’ve seen, the one I’m focused on is essentially my “plan B” for an options market that, for this industry, is past tense. Volatility is too high, so put option buying is not an option. Literally.
But this ETF is. The Direxion Daily Semiconductor Bear 3X Shares (SOXS) aims to be SOXX in reverse, with 3x leverage. That means I treat it more like placing capital in an option expiring 3-6 months from now. I use a fraction of the size of my position if I were using SOXX instead, in a bull market cycle.
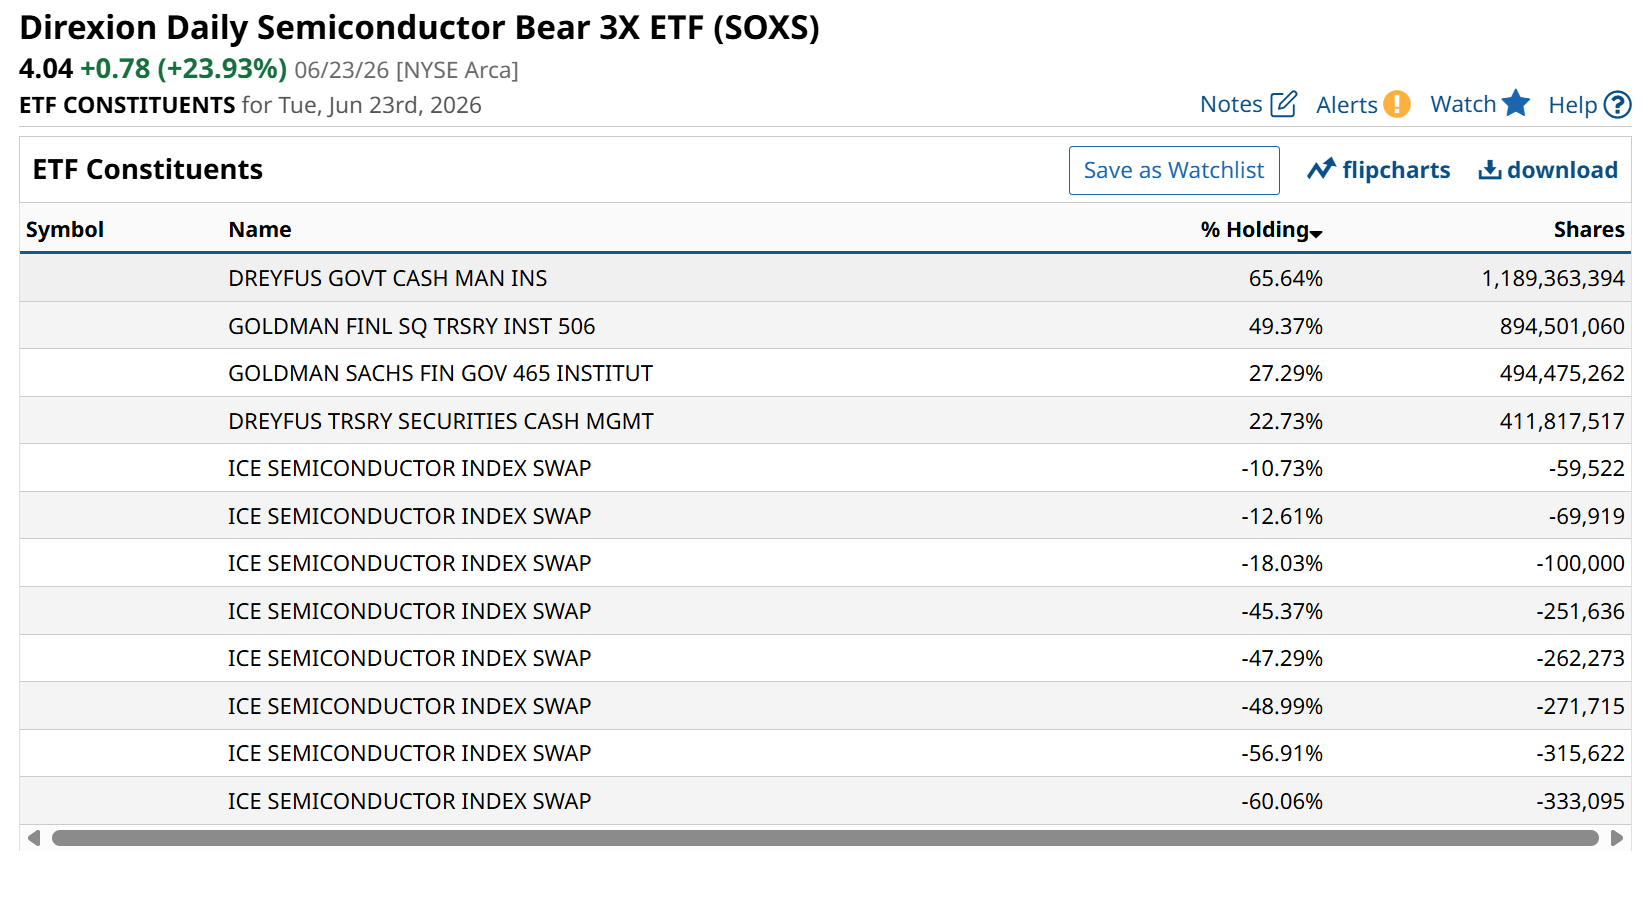
ETFs like this are built with swap contracts, and the math of loss works against us in a big way, so SOXS is best considered as a day-to-day evaluation. Especially with the volatility in semiconductor stocks. But again, the smaller the position size I take the more time I can give myself for this to work. Not months, but perhaps up to a few weeks if the tide is not strongly against me.
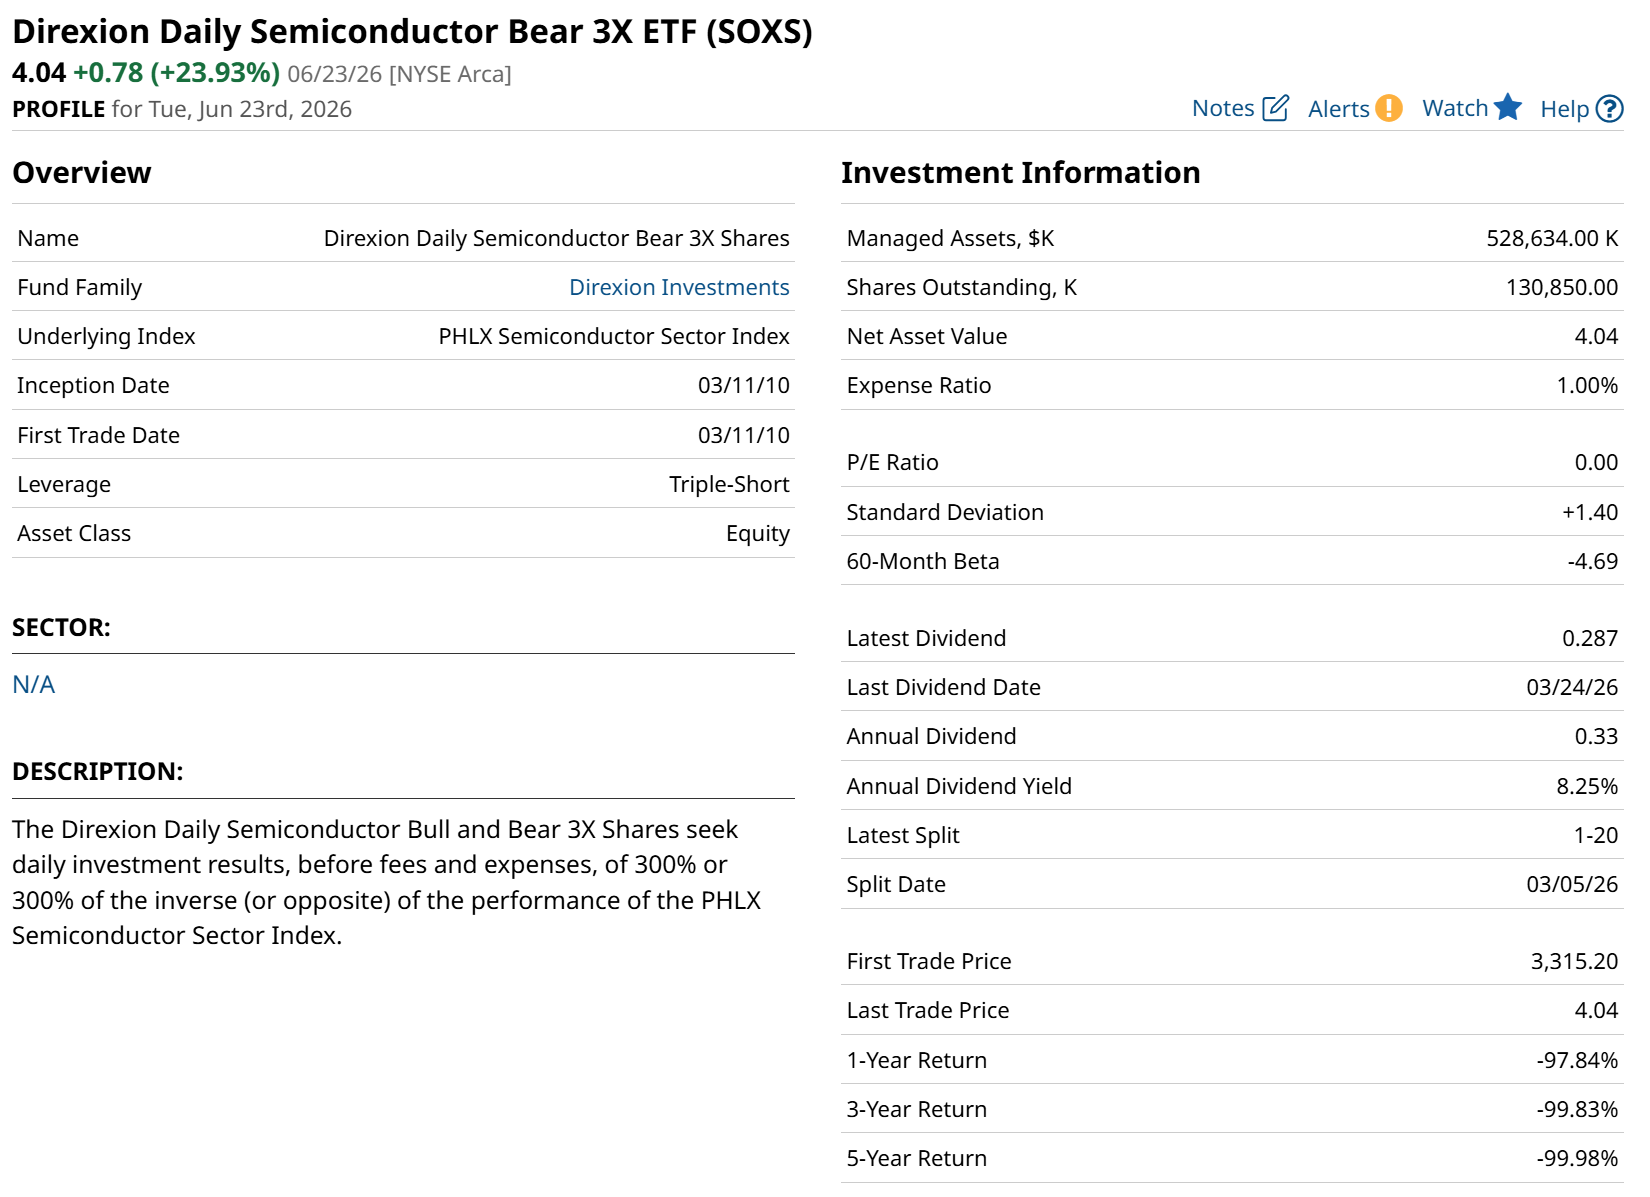
But beyond that, this or any 3x ETF, long or inverse, is an accident waiting to happen if you are not careful. It can be like leaving the stove on and going away for a weekend. See those one-, three-, and five-year returns above? This can go to zero. Still, SOXS has more than $500 million in assets and trades about $1.4 million in volume on an average day.
As I see it, with a per-share price of around $4, SOXS is like owning a put option on SOXX but without an expiration date. I’ve paid more than $4 per share for options many times. If you learn how to stay within yourself and research these carefully, there could be potential to profit, particularly if semis do fall 50%.
Rob Isbitts created the ROAR Score, based on his 40+ years of technical analysis experience. ROAR helps DIY investors manage risk and create their own portfolios. For Rob’s written research, check out ETFYourself.com.
On the date of publication, Rob Isbitts did not have (either directly or indirectly) positions in any of the securities mentioned in this article. All information and data in this article is solely for informational purposes. For more information please view the Barchart Disclosure Policy here.
/Micron%20Technology%20Inc_%20logo%20on%20building-by%20vzphotos%20vis%20iStock.jpg)


/Lululemon%20Athletica%20inc_%20storefront%20by-%20Robert%20Way%20via%20iStock.jpg)
/Semiconductor%20chip%20by%20Mykola%20Pokhodzhay%20via%20iStock.jpg)