
It’s the official beginning of the Year of the Fire Horse. And if you think it's been a while since we had a market correction that really stuck around for more than a few months, consider this: The last Year of the Fire Horse was back in 1966. And prior to that, 1906.
This event is more like an asteroid than a regular thing. It happens exactly every 60 years. So I’ll write about it now, since I don’t expect to have another opportunity.
This Calls for a Celebration! A Very Wonky One, In Fact.
When I hear 1966, my market historian's mind immediately rings the alarm bell. A real fire alarm in this case. Why? Because 1966 was the start of a very long bear market for U.S. stocks.
The S&P 500 Index ($SPX) started 1966 around $92. It’s hard to believe, as the index sits near $7,000 today. But after a more than 20% decline in 1966, investors could be forgiven for thinking the Fire Horse had spiked their drink. By the end of 1974, nine years later, the S&P 500 stood at $69, well off where it had been.
However, the 1970s brought little reprieve. High inflation and a sluggish market made it so that the net inflation return from 1966 to 1981 was less than 2% a year. This is so far in the past, today’s investors would hardly believe it. And I don’t believe many would consider it a possibility today. But here we are, in the year of the Fire Horse, and the U.S. stock market is as hot as it was at the start of 1966.
We can try to predict the future, but I prefer to think of investing as a constant exercise in “handicapping” various scenarios. I’m a fan of the sport of horse racing, and this is the year of the horse. And while the Kentucky Derby is not until the first Saturday in May, when I look at the 11 S&P 500 sectors, I think, “That looks like a real horse race.”
So, amid the Chinese Year of the Fire Horse, the S&P 500 sector race, and the inclination these days to turn everything possible into a “prediction,” let’s take a racing-industry-style view of the 11 sectors.
Each sector has an exchange-traded fund (ETF). I’ll chart a few first, then summarize with an odds table and some quick notes I have based on what I see in the charts.
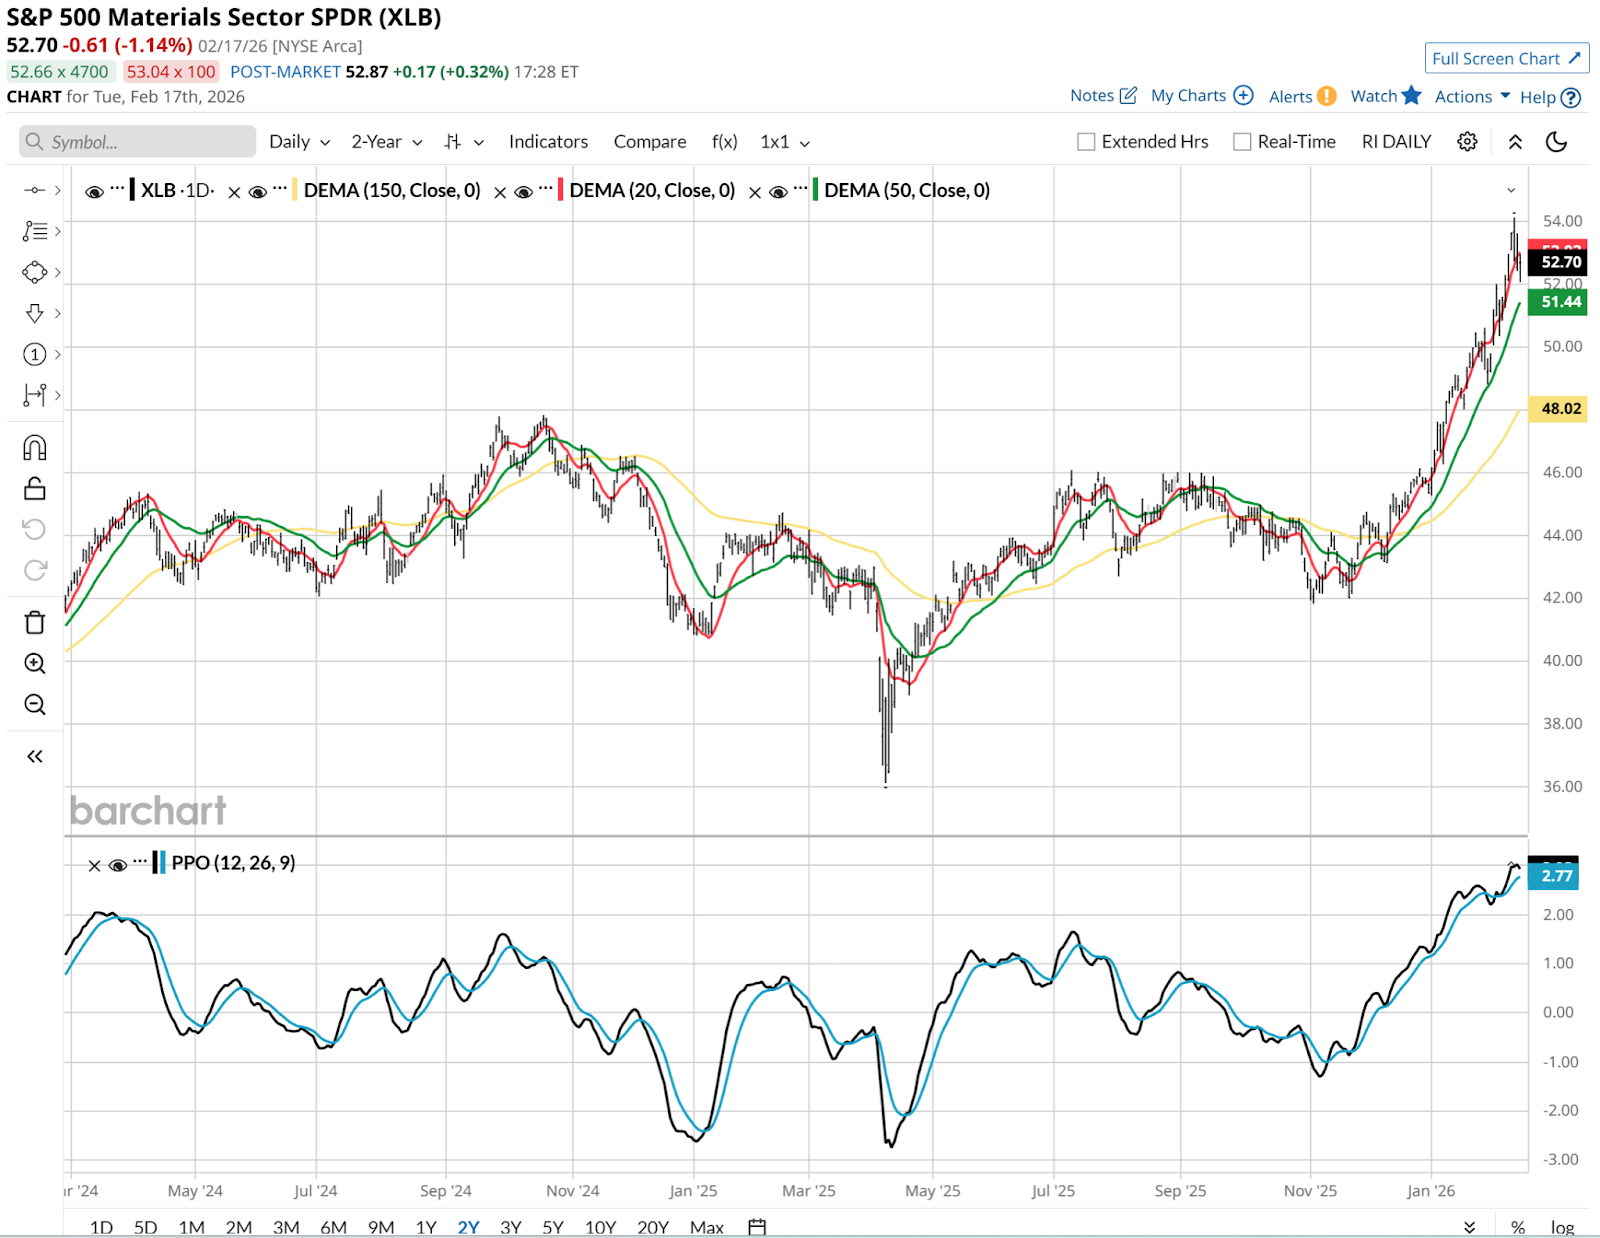
S&P 500 Materials Sector ETF (XLB): The Early Speed
I do not see a path for the S&P 500 Materials Sector SPDR (XLB) to win this 10-week race. It is highly unlikely to be the top performer among the 11 sectors. It has burned a lot of fuel, up 20% since November, in part thanks to mining stocks that ripped higher with their associated precious metals. If this horse had a name, it would be “No Way Jose.” It’s a longshot at best.
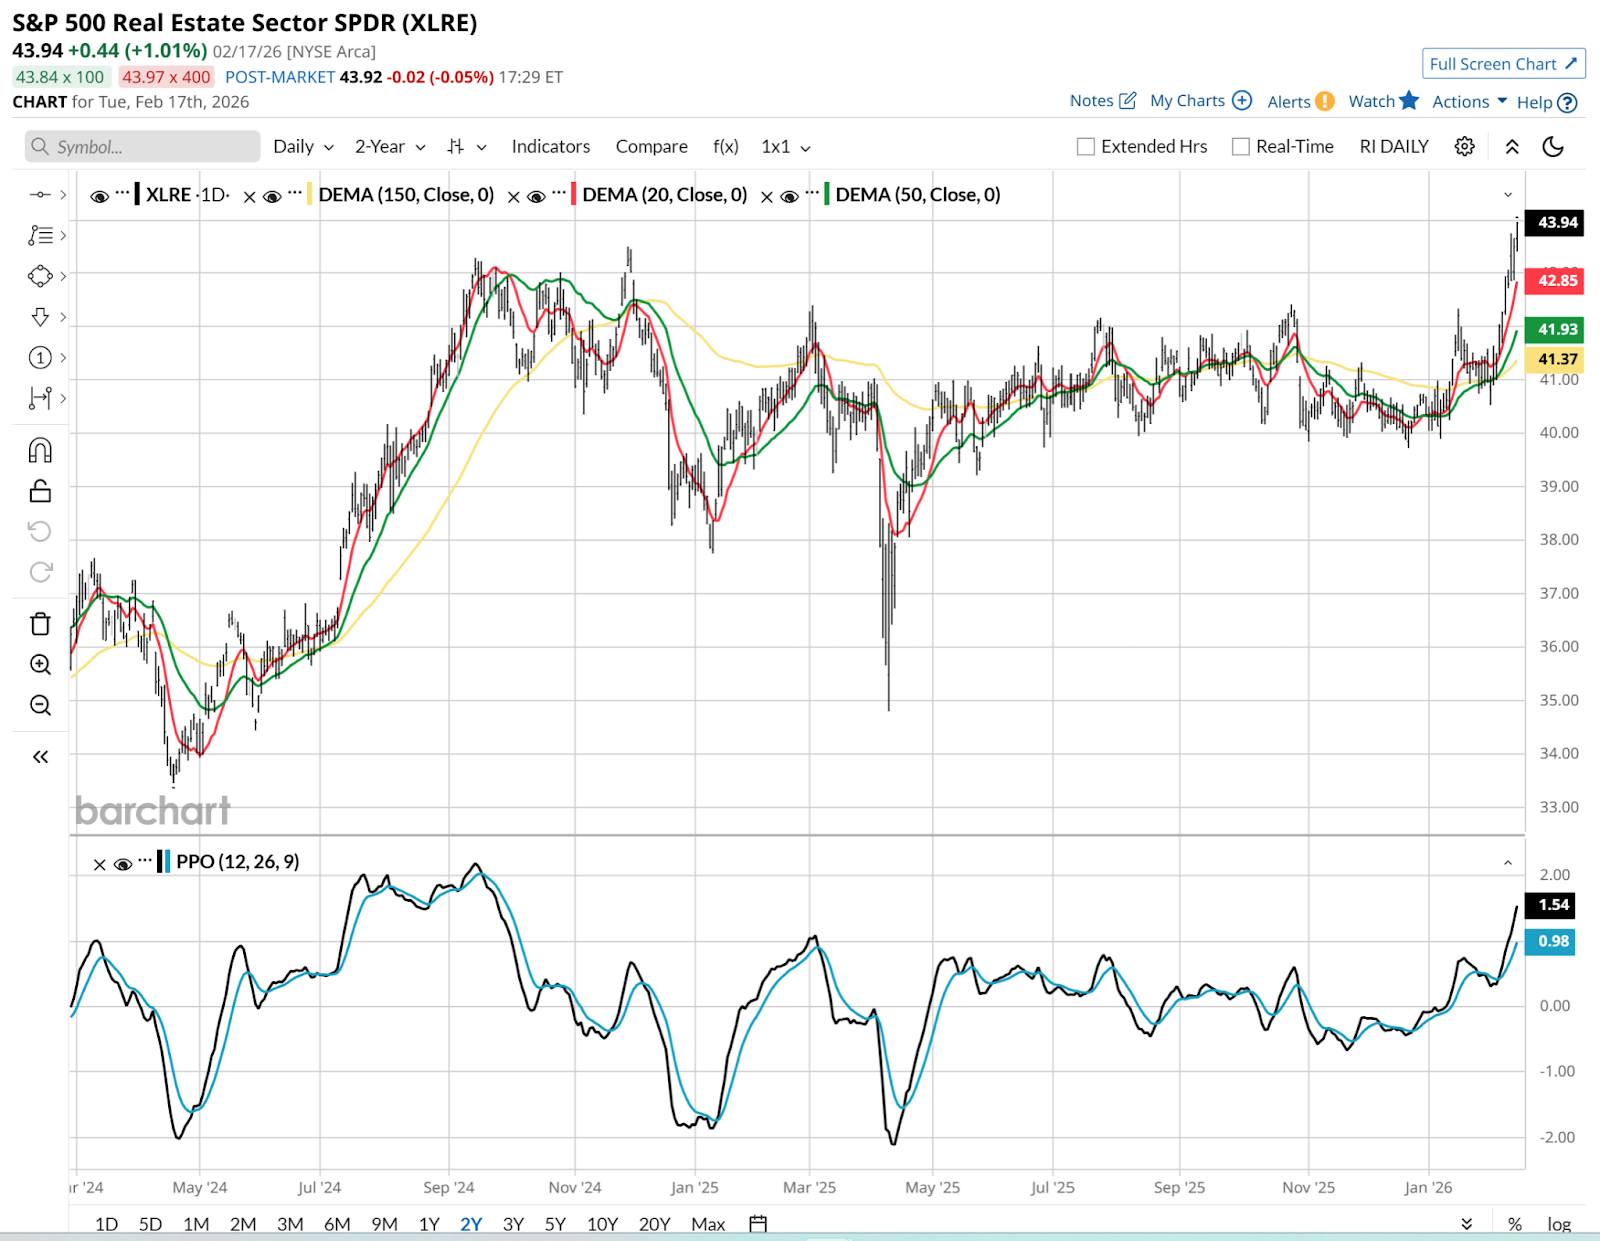
S&P 500 Real Estate Sector ETF (XLRE): Wind at Its Back
I wrote recently about how I saw breakouts in progress for the S&P 500 Real Estate Sector SPDR (XLRE) and the S&P 500 Utilities Sector SPDR (XLU). But not because of those stocks, as much as how they are likely to benefit from falling long-term interest rates.
A few days later, and those moves are getting louder, like hoofbeats down the stretch. XLRE, in particular, just broke above a multi-year top. In 10 weeks, it would not surprise me to see it in the winner’s circle, as the top sector performer.
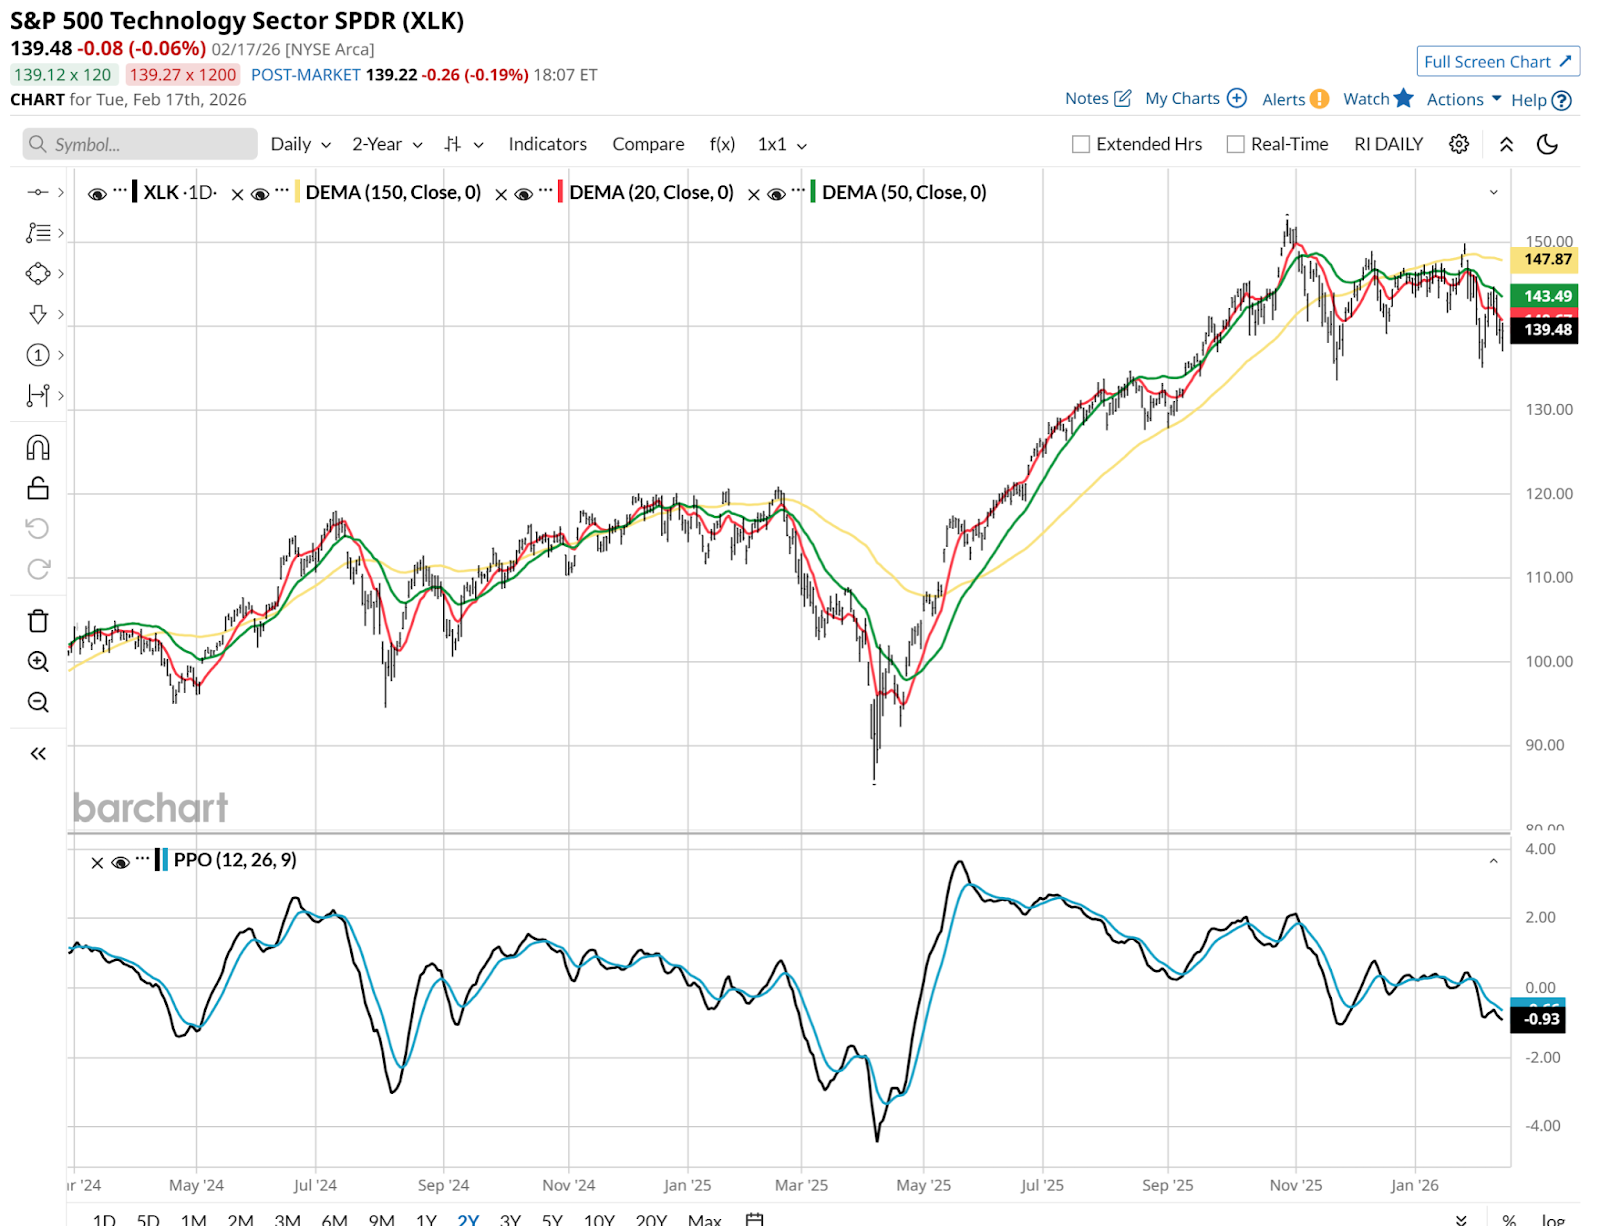
S&P 500 Technology Sector SPDR (XLK): Great Pedigree, Unlikely Winner
What do I mean by “great pedigree?” In the same way that a racehorse’s bloodlines often influence the potential of their offspring, so too is it for sectors. Not in terms of bloodlines, but the reputation they build.
Technology stocks are likely the most well-known and have the best reputation. They have come a long way since the last Year of the Horse in 1966, when IBM (IBM) was the hot young stud of the sector.
I’d suspect that new investors learn about tech, tech, and tech, in that order. Then the other 10 sectors. So the S&P 500 Technology Sector SPDR (XLK) is a “favorite” in one sense. But its chart is very toppy to me, and the PPO indicator at bottom is really in serious trouble. I don’t think this will be the winner of this race, despite easily having the best long-term track record in the sector race.
This table fills in some quick notes for the rest of them. I played “Morning Line Oddsmaker” to represent what I see across the 11 charts. Namely, a few with strong chances, several true longshots, but a race where, as always, any horse — er, sector — has a chance to win.
The 2026 Sector Derby: A Look at the Odds
- Real estate (XLRE) (5-2): If bond rates continue lower, has a real shot.
- Utilities (XLU) (3-1): Powering data centers gives it unexpected energy.
- Health care (XLV) (4-1): High innovation tailwinds in biotech.
- Industrials (XLI) (9-2): Lagging behind due to the current manufacturing slowdown.
- Financials (XLF) (8-1): Benefiting from a stabilizing interest rate environment.
- Communication Services (XLC) (10-1): Leading the AI buildout with high momentum.
- Consumer Discretionary (XLY) (10-1): Tariff and consumer spending risks.
- Materials (XLB) (15-1): Needs a global growth catalyst to break out of the pack.
- Technology (XLK) (15-1): High class but carrying a heavy weight of high valuations.
- Energy (XLE) (20-1): Struggling with headwinds but has the stamina to surprise.
- Consumer Staples (XLP) (25-1): A defensive favorite if the track gets messy.
Rob Isbitts created the ROAR Score, based on his 40+ years of technical analysis experience. ROAR helps DIY investors manage risk and create their own portfolios. For Rob's written research, check out ETFYourself.com.
On the date of publication, Rob Isbitts did not have (either directly or indirectly) positions in any of the securities mentioned in this article. All information and data in this article is solely for informational purposes. For more information please view the Barchart Disclosure Policy here.
/Microsoft%20headquarters%20By%20Peter.jpeg)
/Micron%20Technology%20Inc_%20logo%20on%20building-by%20vzphotos%20vis%20iStock.jpg)
/NVIDIA%20Corp%20logo%20outside%20building-by%20BING-JHEN_HONG%20via%20iStock.jpg)
/Amazon%20-%20Image%20by%20bluestork%20via%20Shutterstock.jpg)