Soybeans are showing 2 to 3 ½ cent losses across most contracts on Monday morning. Futures faced more weakness to close out the week, as contracts were down 2 to 8 cents on Friday. The weekly move for July was down 65 1/4 cents, with November down 52 ½ cents. Open interest on Friday was down 7,442 contracts, mainly as July was down 21,202 contracts. The cmdtyView national average Cash Bean price was down 7 cents at $10.63 1/4. Soymeal futures were down 20 cents to $5.20 in the front months, with July falling $21.30/ton this week. Soy Oil futures were 110 to 217 points lower, with July falling 360 points. Crude oil losses of $2.79 added some modest pressure.
Commitment of Traders data showed spec funds at a net long of 156,050 contracts of soybean futures and options, a 33,502 contract reduction on the week.
Export Sales data from Thursday showed old crop sale commitment at 39.948 MMT, an 18% decline from a year ago. That is 96% of the USDA estimate and lags the 99% average sale pace. Shipments are 35.58 MMT, 85% of the USDA number and behind the 90% average.
The NOAA 7-day forecast showed shows precip expected to total 1 to up to 4 inches across much of the Central and Eastern Corn Belt, as well as parts of KS and MO. The heaviest totals are seen in a band from eastern KS through central MO, eastern IA and WI, as well as much of IL and IN.
Jul 26 Soybeans closed at $11.21 1/2, down 8 cents, currently down 3 1/4 cents
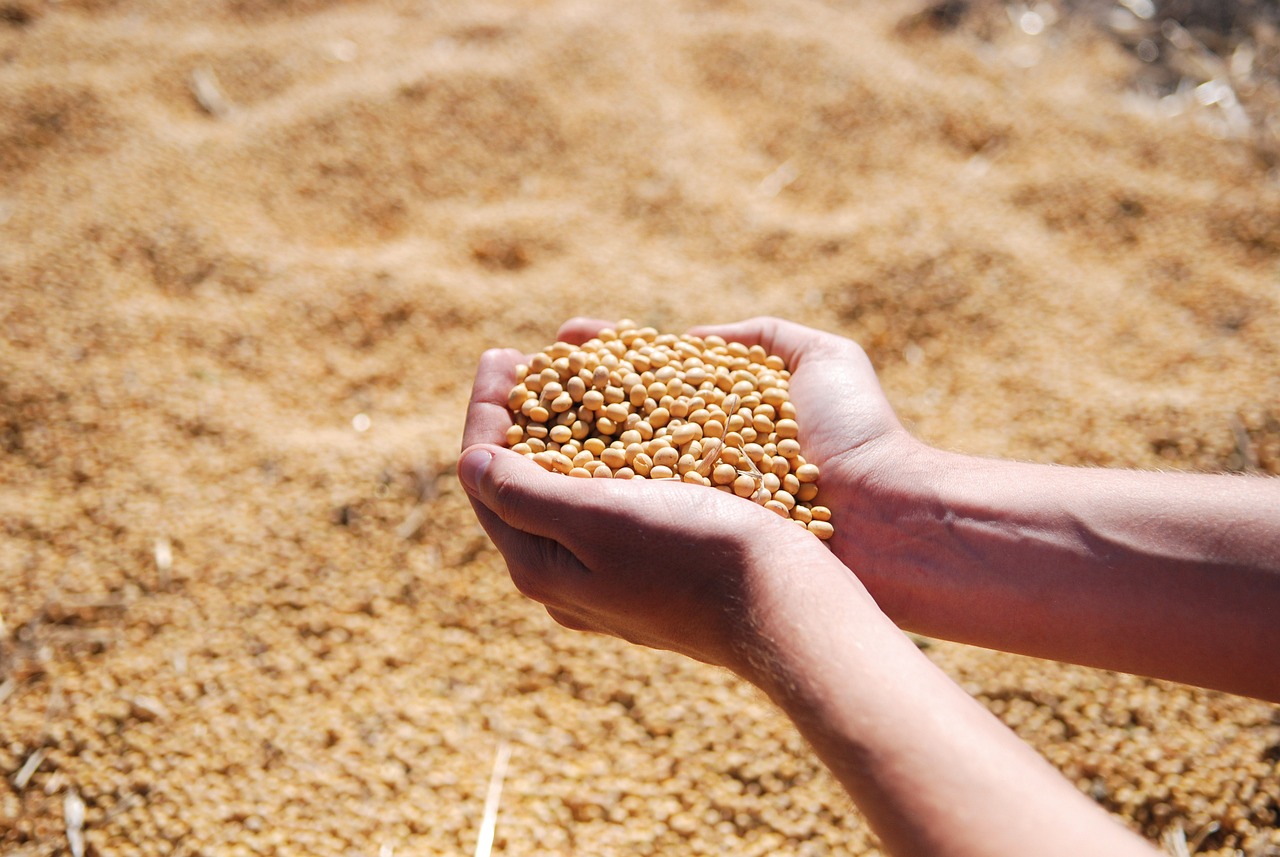
Nearby Cash was $10.63 1/4, down 7 cents,
Aug 26 Soybeans closed at $11.26, down 6 1/2 cents, currently down 3 1/2 cents
Nov 26 Soybeans closed at $11.37 1/2, down 4 cents, currently down 2 3/4 cents
New Crop Cash was $10.72 3/4, down 4 1/4 cents,
On the date of publication, Austin Schroeder did not have (either directly or indirectly) positions in any of the securities mentioned in this article. All information and data in this article is solely for informational purposes. For more information please view the Barchart Disclosure Policy here.
/Nvidia%20logo%20by%20Konstantin%20Savusia%20via%20Shutterstock.jpg)
/A%20game%20controller%20in%20front%20of%20a%20Roblox%20computer%20screen%20by%20Miguel%20Lagoa%20via%20Shutterstock.jpg)
/A%20photo%20of%20a%20Sandisk%20Solid%20State%20Drive%20by%20Top%20Popular%20Vector%20by%20Shutterstock.jpg)
/Nvidia%20logo%20and%20sign%20on%20headquarters%20by%20Michael%20Vi%20via%20Shutterstock.jpg)