Swiss Power Base Jan '24 (MHF24)
Price Performance
See More| Period | Period Low | Period High | Performance | |
|---|---|---|---|---|
| 1-Month | 82.78 +1.40% on 01/22/24 |
Period Open: 100.02
| 101.11 -16.98% on 01/04/24 | -16.08 (-16.08%) since 12/29/23 |
| 3-Month | 82.78 +1.40% on 01/22/24 |
Period Open: 150.34
| 139.52 -39.84% on 10/31/23 | -66.40 (-44.17%) since 10/30/23 |
Most Recent Stories
More News
WTI Crude Oil futures rallied yesterday on a continuation trade from short-covering, a strong EIA report, and heightened pressure from the Trump administration on Russian crude oil buyers. White House...

Pinnacle West Capital has underperformed the broader market over the past year, but analysts are moderately optimistic about the stock’s prospects.

Trade the most popular US futures of 2025: Agricultural Commodities, Indices, Crypto, Metals, Forex, and more! Join over 30 million people worldwide who trust Plus500. Start trading today with a deposit as low as $100!

Corporations adopting Bitcoin reserves risk systemic instability, as debt, leverage, and crashes could trigger cascading defaults, resembling speculative bubble collapses.

October WTI crude oil (CLV25 ) on Thursday closed up +0.81 (+1.29%), and October RBOB gasoline (RBV25 ) closed up +0.0281 (+1.43%). Crude oil and gasoline prices rallied on Thursday, with crude posting...
September Nymex natural gas (NGU25 ) on Thursday closed up +0.074 (+2.69%). Sep nat-gas prices moved sharply higher on Thursday due to a lower-than-expected build in weekly nat-gas inventories. The EIA...
October WTI crude oil (CLV25 ) today is up +0.34 (+0.54%), and October RBOB gasoline (RBV25 ) is up +0.0224 (+1.14%). Crude oil and gasoline prices today are climbing, with crude posting a 1.5-week high...

WTI Crude Oil futures rallied yesterday as the reality of how far off peace with Russia really is starts to set in. Hamas signaled openness to accepting a peace agreement identical to the one US envoy...

September WTI crude oil (CLU25 ) on Wednesday closed up +0.86 (+1.38%), and September RBOB gasoline (RBU25 ) closed up +0.0393 (+1.88%). Crude oil and gasoline prices rallied on Wednesday, with gasoline...
September Nymex natural gas (NGU25 ) on Wednesday closed down -0.014 (-0.51%). Sep nat-gas prices on Wednesday settled lower and matched Tuesday's 9.25-month nearest-futures low. Nat-gas prices have retreated...

September WTI crude oil (CLU25 ) on Tuesday closed down -1.07 (-1.69%), and September RBOB gasoline (RBU25 ) closed down -0.0097 (-0.46%). Crude oil prices retreated on Tuesday on signs of progress in...

September Nymex natural gas (NGU25 ) on Tuesday closed down -0.124 (-4.29%). Sep nat-gas prices on Tuesday plunged to a 9.25-month nearest-futures low and settled sharply lower on forecasts for cooler...

While the Tulsa, Oklahoma-based natural gas specialist has struggled in the market, OKE stock may be gifting contrarians a potential sentiment reversal.
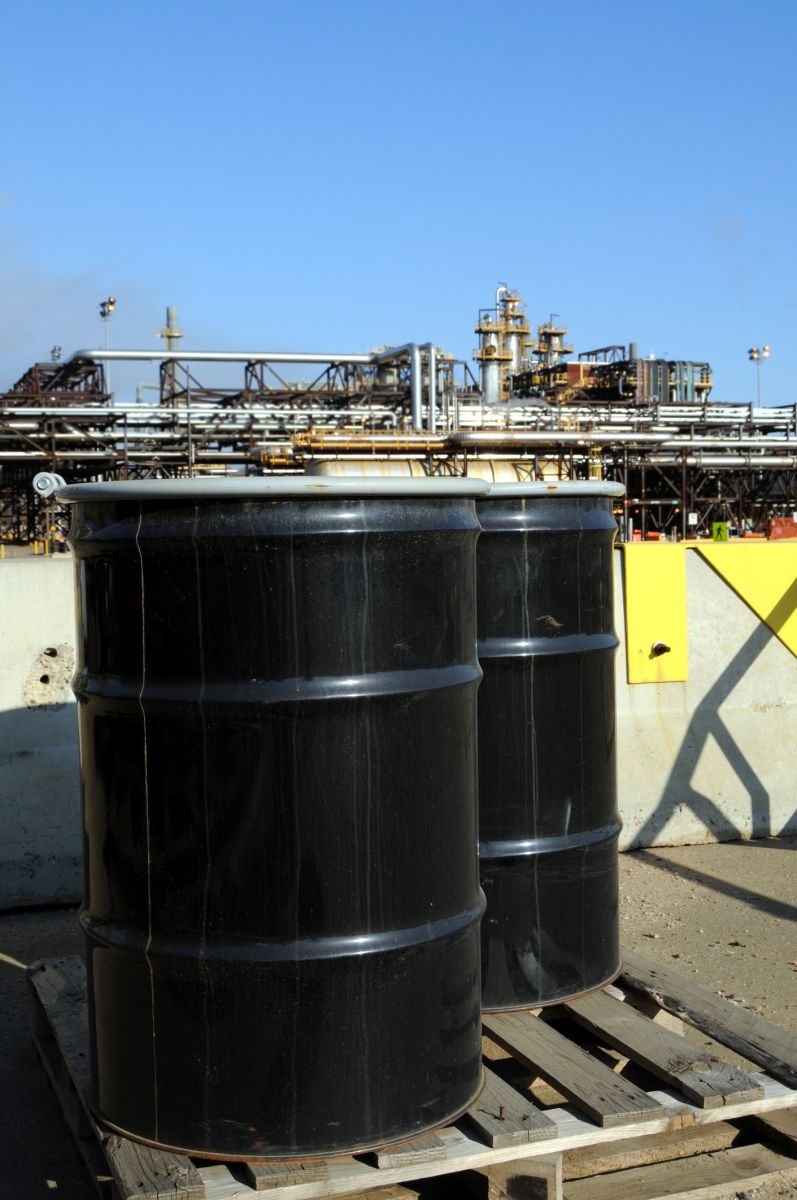
September WTI crude oil (CLU25 ) today is down -0.62 (-0.98%), and September RBOB gasoline (RBU25 ) is down -0.0011 (-0.05%). Crude oil prices are under pressure today on signs of progress in Ukraine peace...

September WTI crude oil (CLU25 ) on Monday closed up +0.62 (+0.99%), and September RBOB gasoline (RBU25 ) closed up +0.0262 (+1.26%). Crude oil prices on Monday settled higher on speculation that there...

September Nymex natural gas (NGU25 ) on Monday closed down -0.026 (-0.89%). Sep nat-gas prices on Monday settled lower on forecasts for cooler-than-normal US temperatures for mid to late August, which...

September WTI crude oil (CLU25 ) today is down -0.02 (-0.03%), and September RBOB gasoline (RBU25 ) is down -0.0003 (-0.01%). Crude oil prices are little changed today. Dollar strength today is bearish...

Marathon Petroleum has underperformed the broader market over the past year, but analysts are moderately optimistic about the stock’s prospects.

Diamondback Energy has considerably underperformed the broader market over the past year, but analysts are highly optimistic about the stock’s prospects.
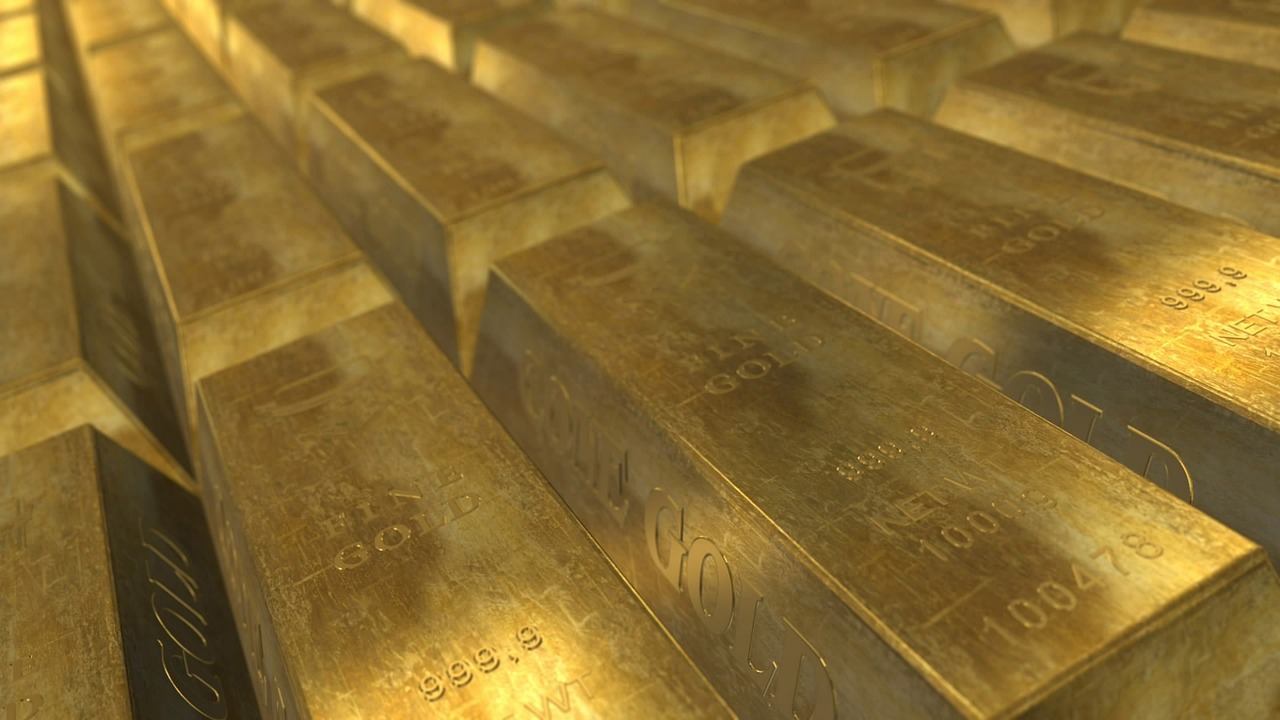
Phil Streible breaks down the key drivers that could shape next week’s price action in gold, crude oil, and Bitcoin on the Schwab Network.


