
When I speak to live audiences, I always remind them that to some of us in the investing business, the headlines are not on our “to-do” list for making decisions, week in and week out. There was a time when markets responded to whatever was in Saturday’s Barron’s or the daily Wall Street Journal. Big media clearly still has tremendous value and influence. But the market is now run by a different set of bosses.
Namely, algorithmic trading and index funds. The latter makes it so that stocks move with others of similar size, since the index buys and sells them all together. It doesn’t matter what the company does.
Index funds, particularly the behemoth S&P 500 Index ($SPX) trackers like the SPDR S&P 500 ETF Trust (SPY), the Vanguard S&P 500 ETF (VOO), and the iShares Core S&P 500 ETF (IVV), now dominate the market for large-cap investing. For that reason, I’m starting to take an interest in much smaller stocks, for the first time in my career.
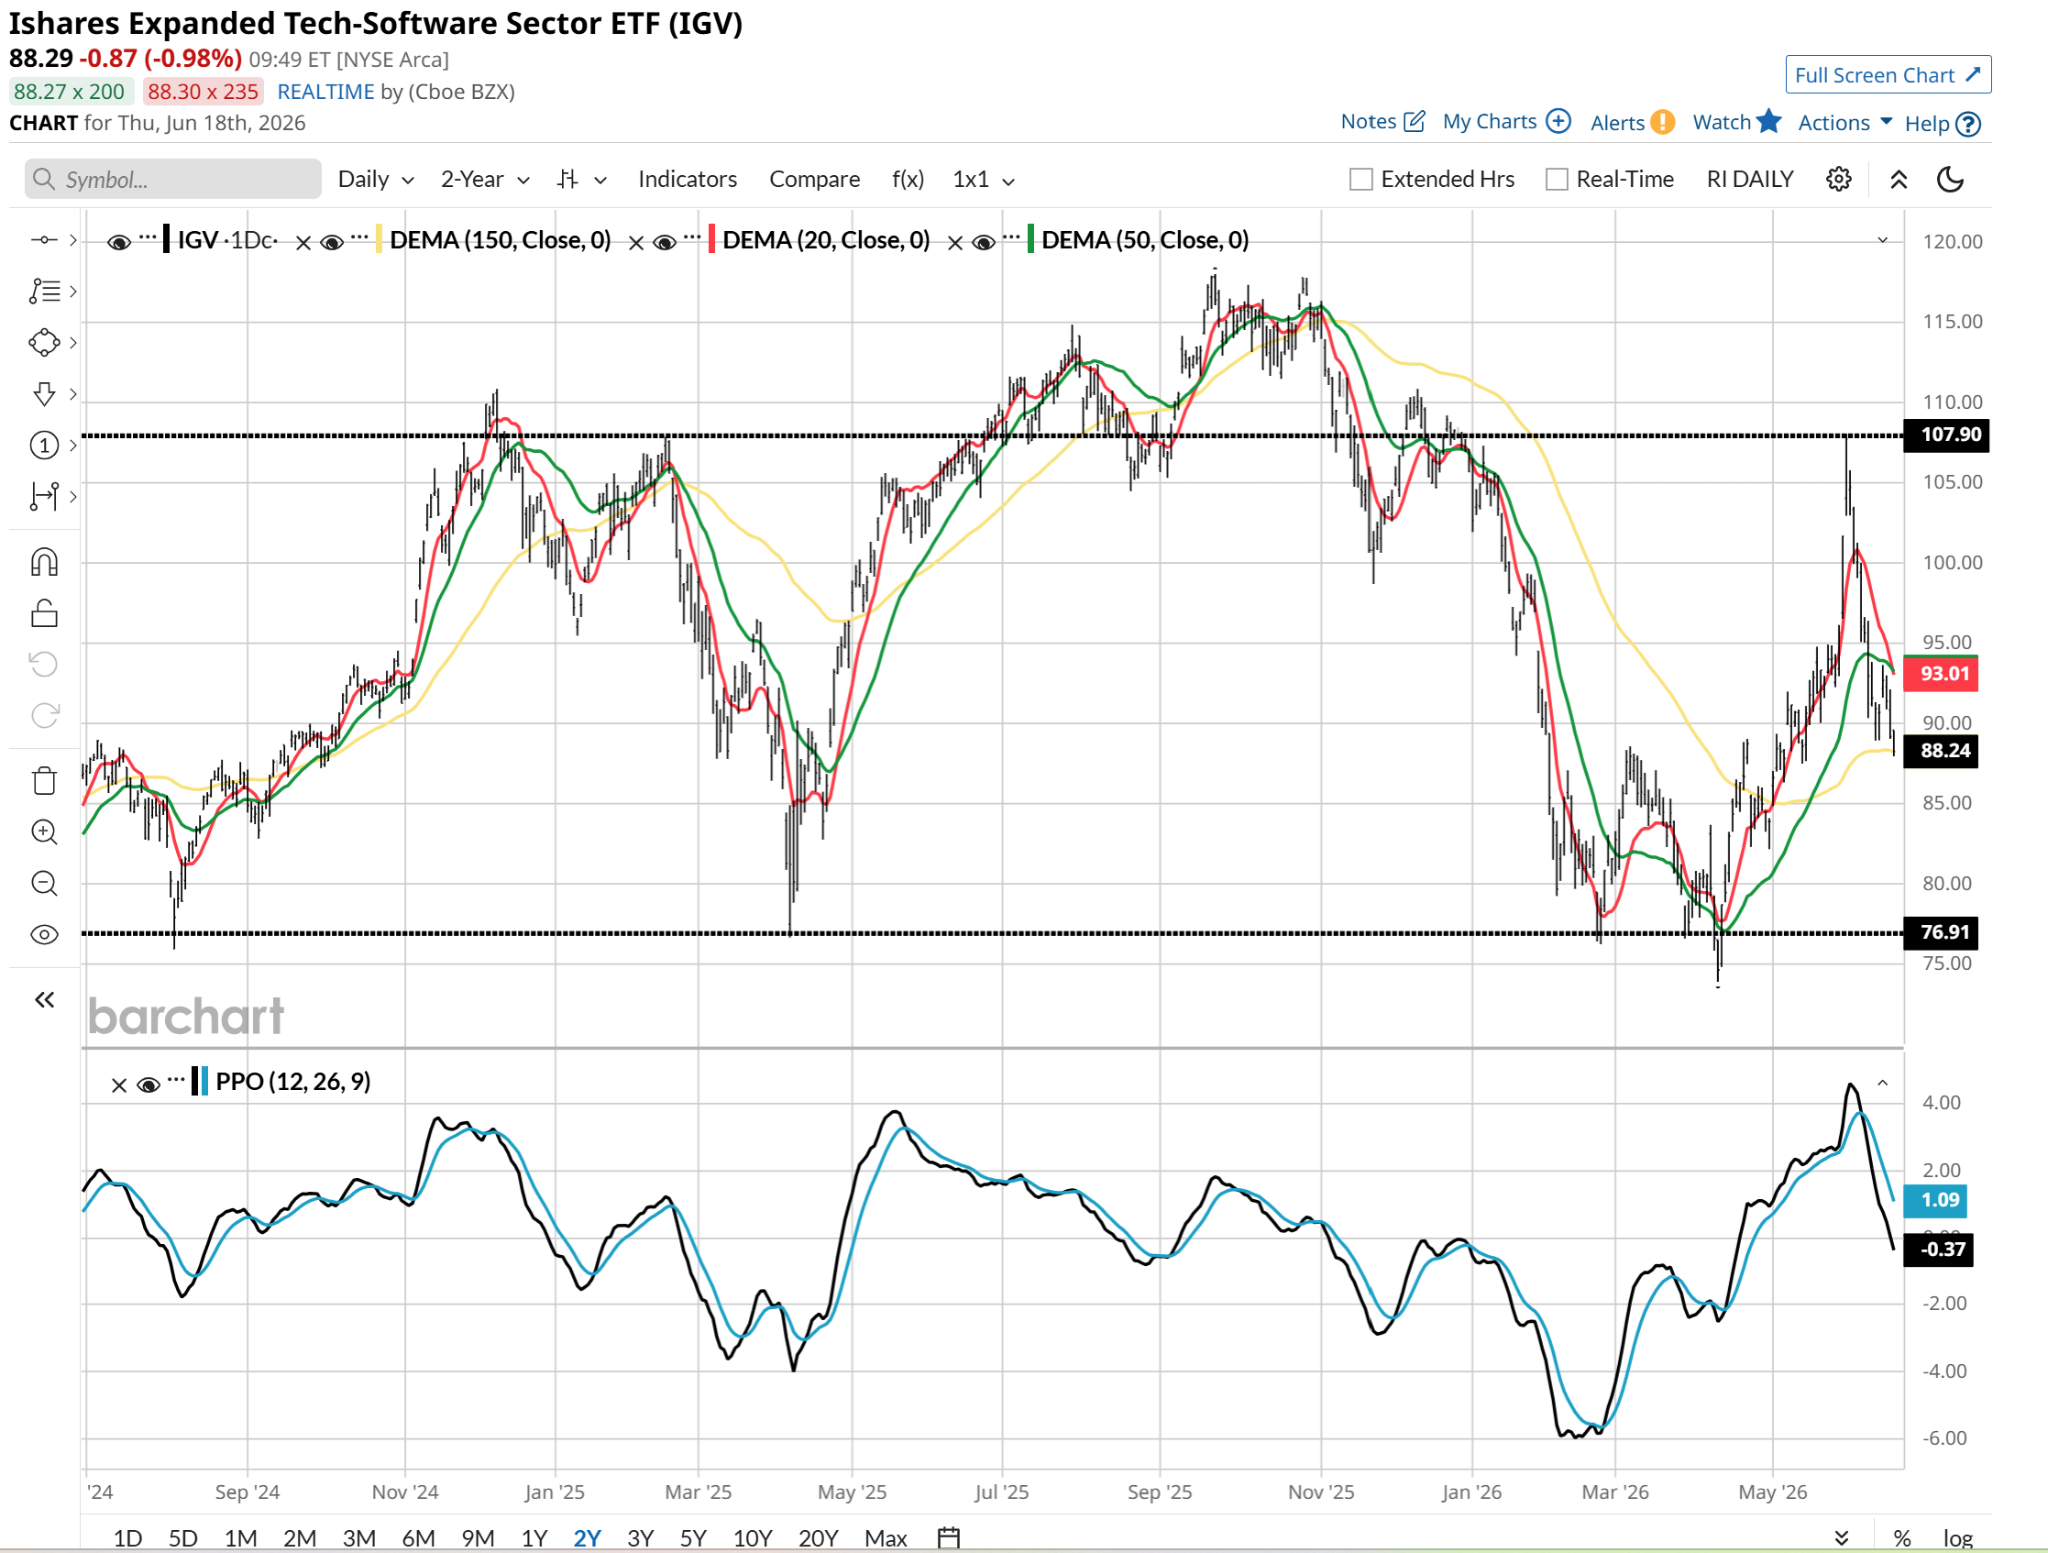
But when I see an exchange-traded fund (ETF) chart that looks like the iShares Expanded Tech-Software Sector ETF (IGV) does below, another feature of today’s markets comes through loud and clear. Once the selling starts, you do not know where the bottom is.
Essentially, the same force of market nature that is driving semiconductor stocks to the moon and beyond is in play on the downside. Specifically with industries like software, which have been cast out as the losers of the artificial intelligence (AI) war. Maybe that’s the case, maybe not. As with everything else, I just look at the charts, and that story is what I place my chips on.
For IGV, that case is a bearish one. And it is fading more each week.
A Closer Look at IGV
Here’s the daily chart. I see an ETF that is down but has more to go. $77 is a logical testing price level. But before that, it would take something out of left field to stop it. That’s my take. So if you missed being on the bear side of this trade from $108 to here, the good news is that crow is still being served at the IGV cafe.
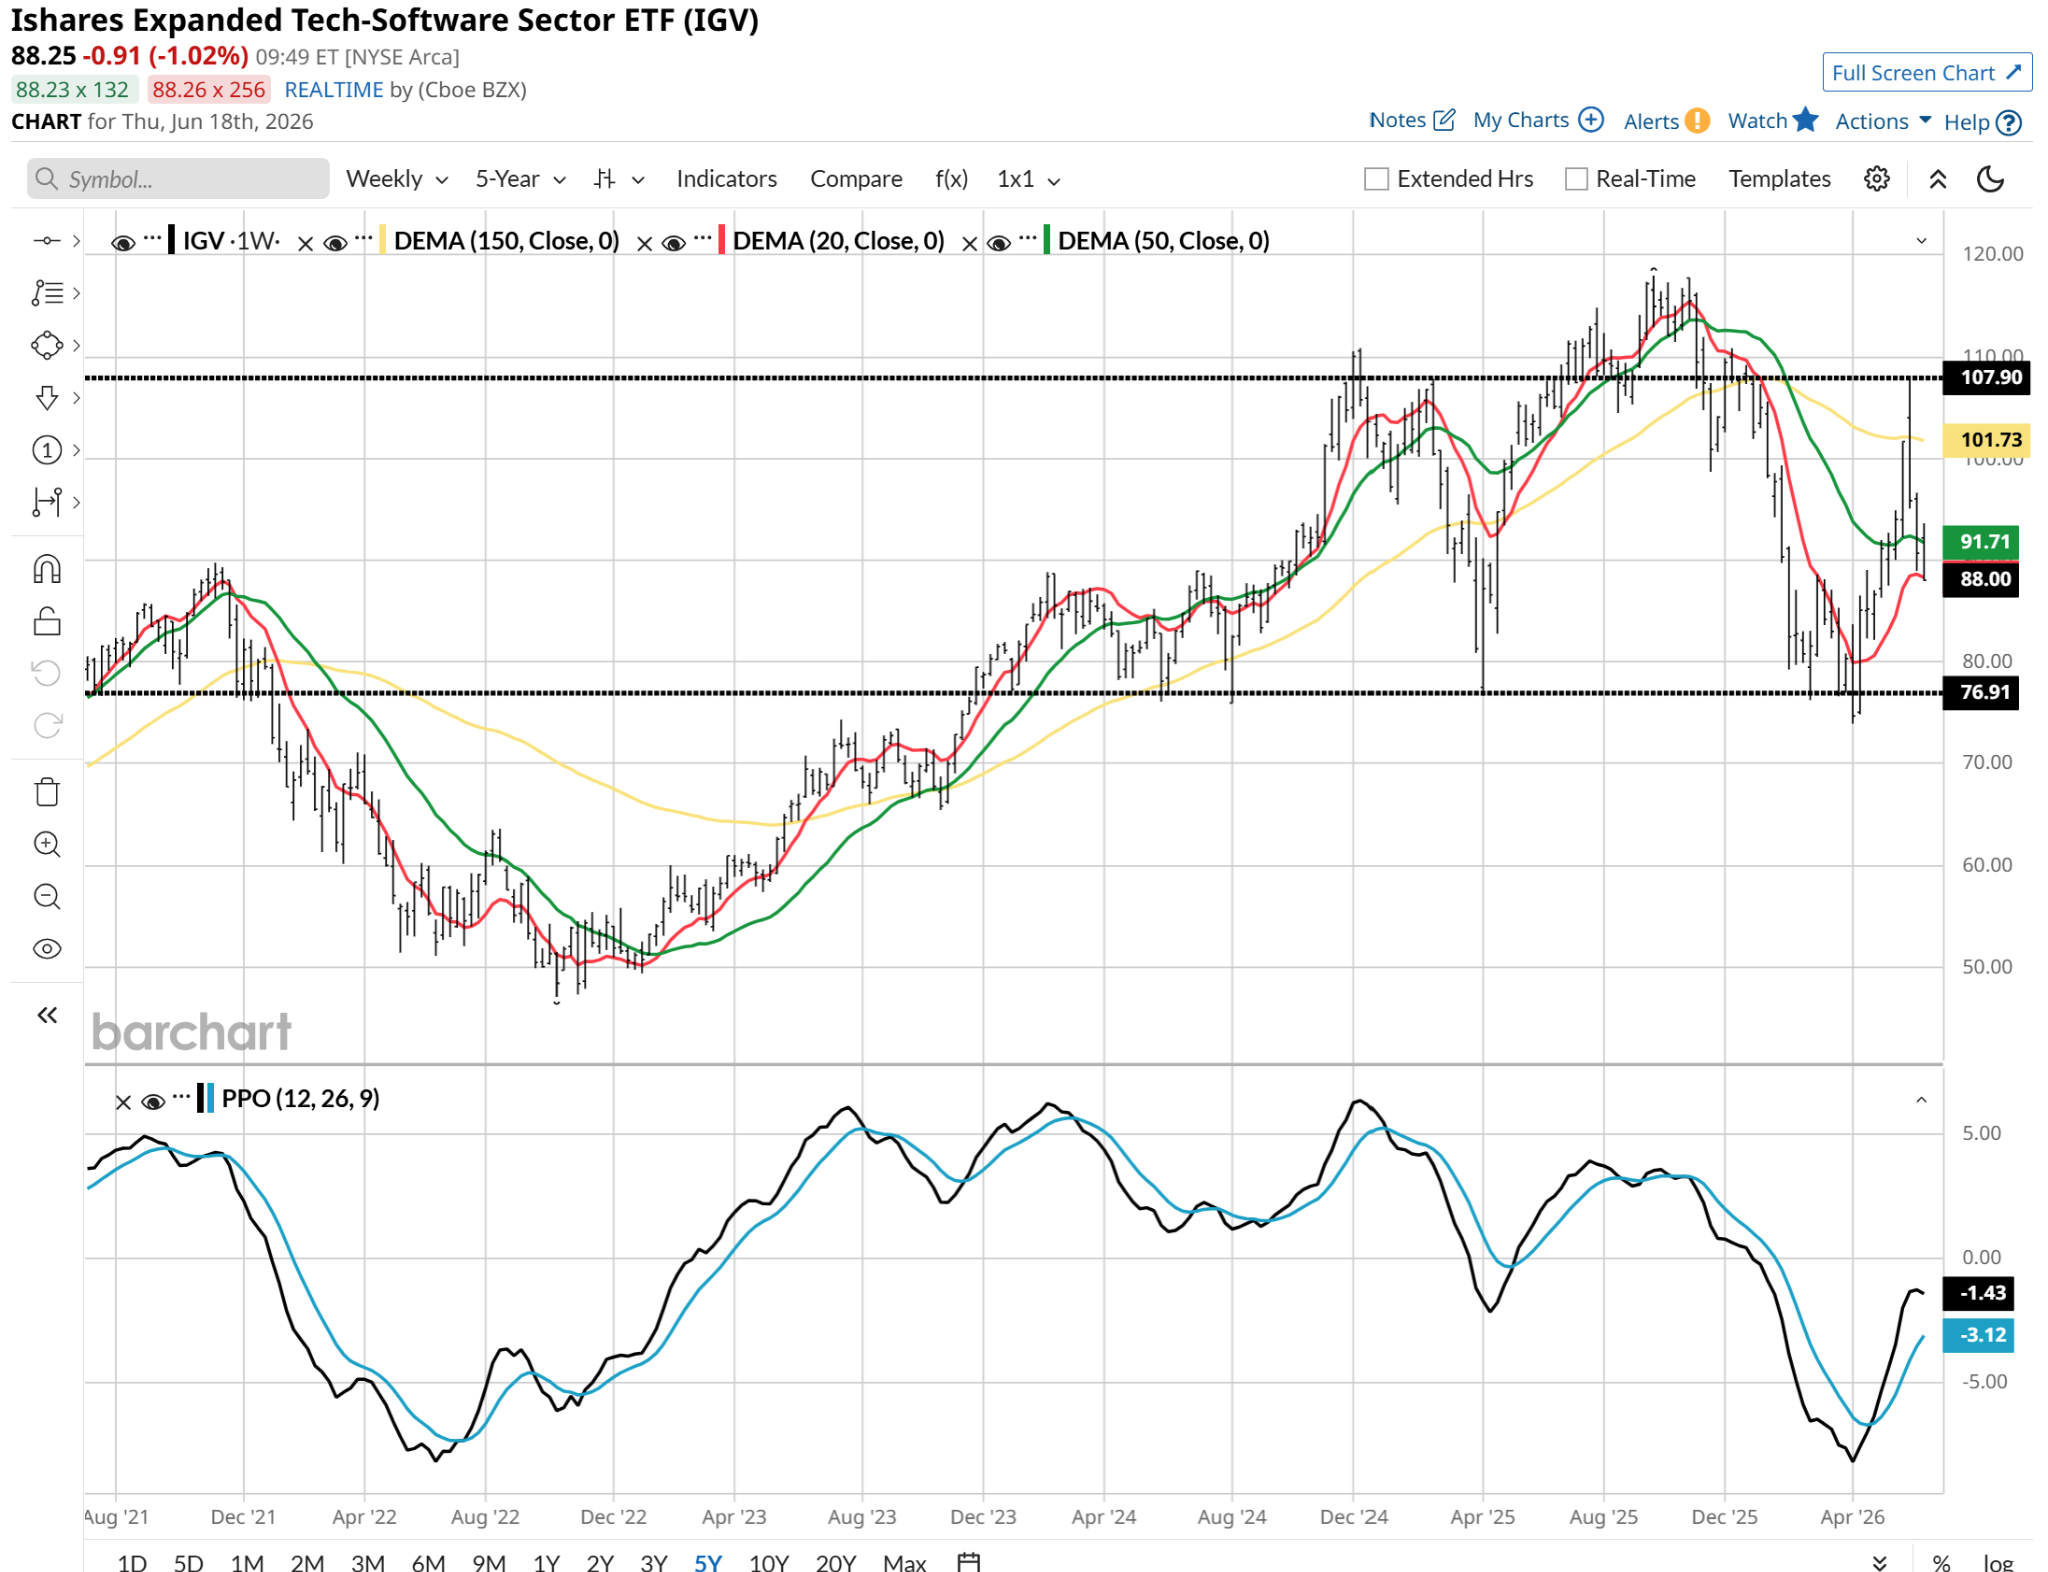
However, whenever I see an “obvious” chart in one direction, I look to other time frames. So here’s the weekly. To me, it is the same picture, just naturally slower to develop, given the time frame. If that PPO rolls over, it is toast. The only question is whether it happens so quickly that the plunge ends the descent. It is too early to tell.
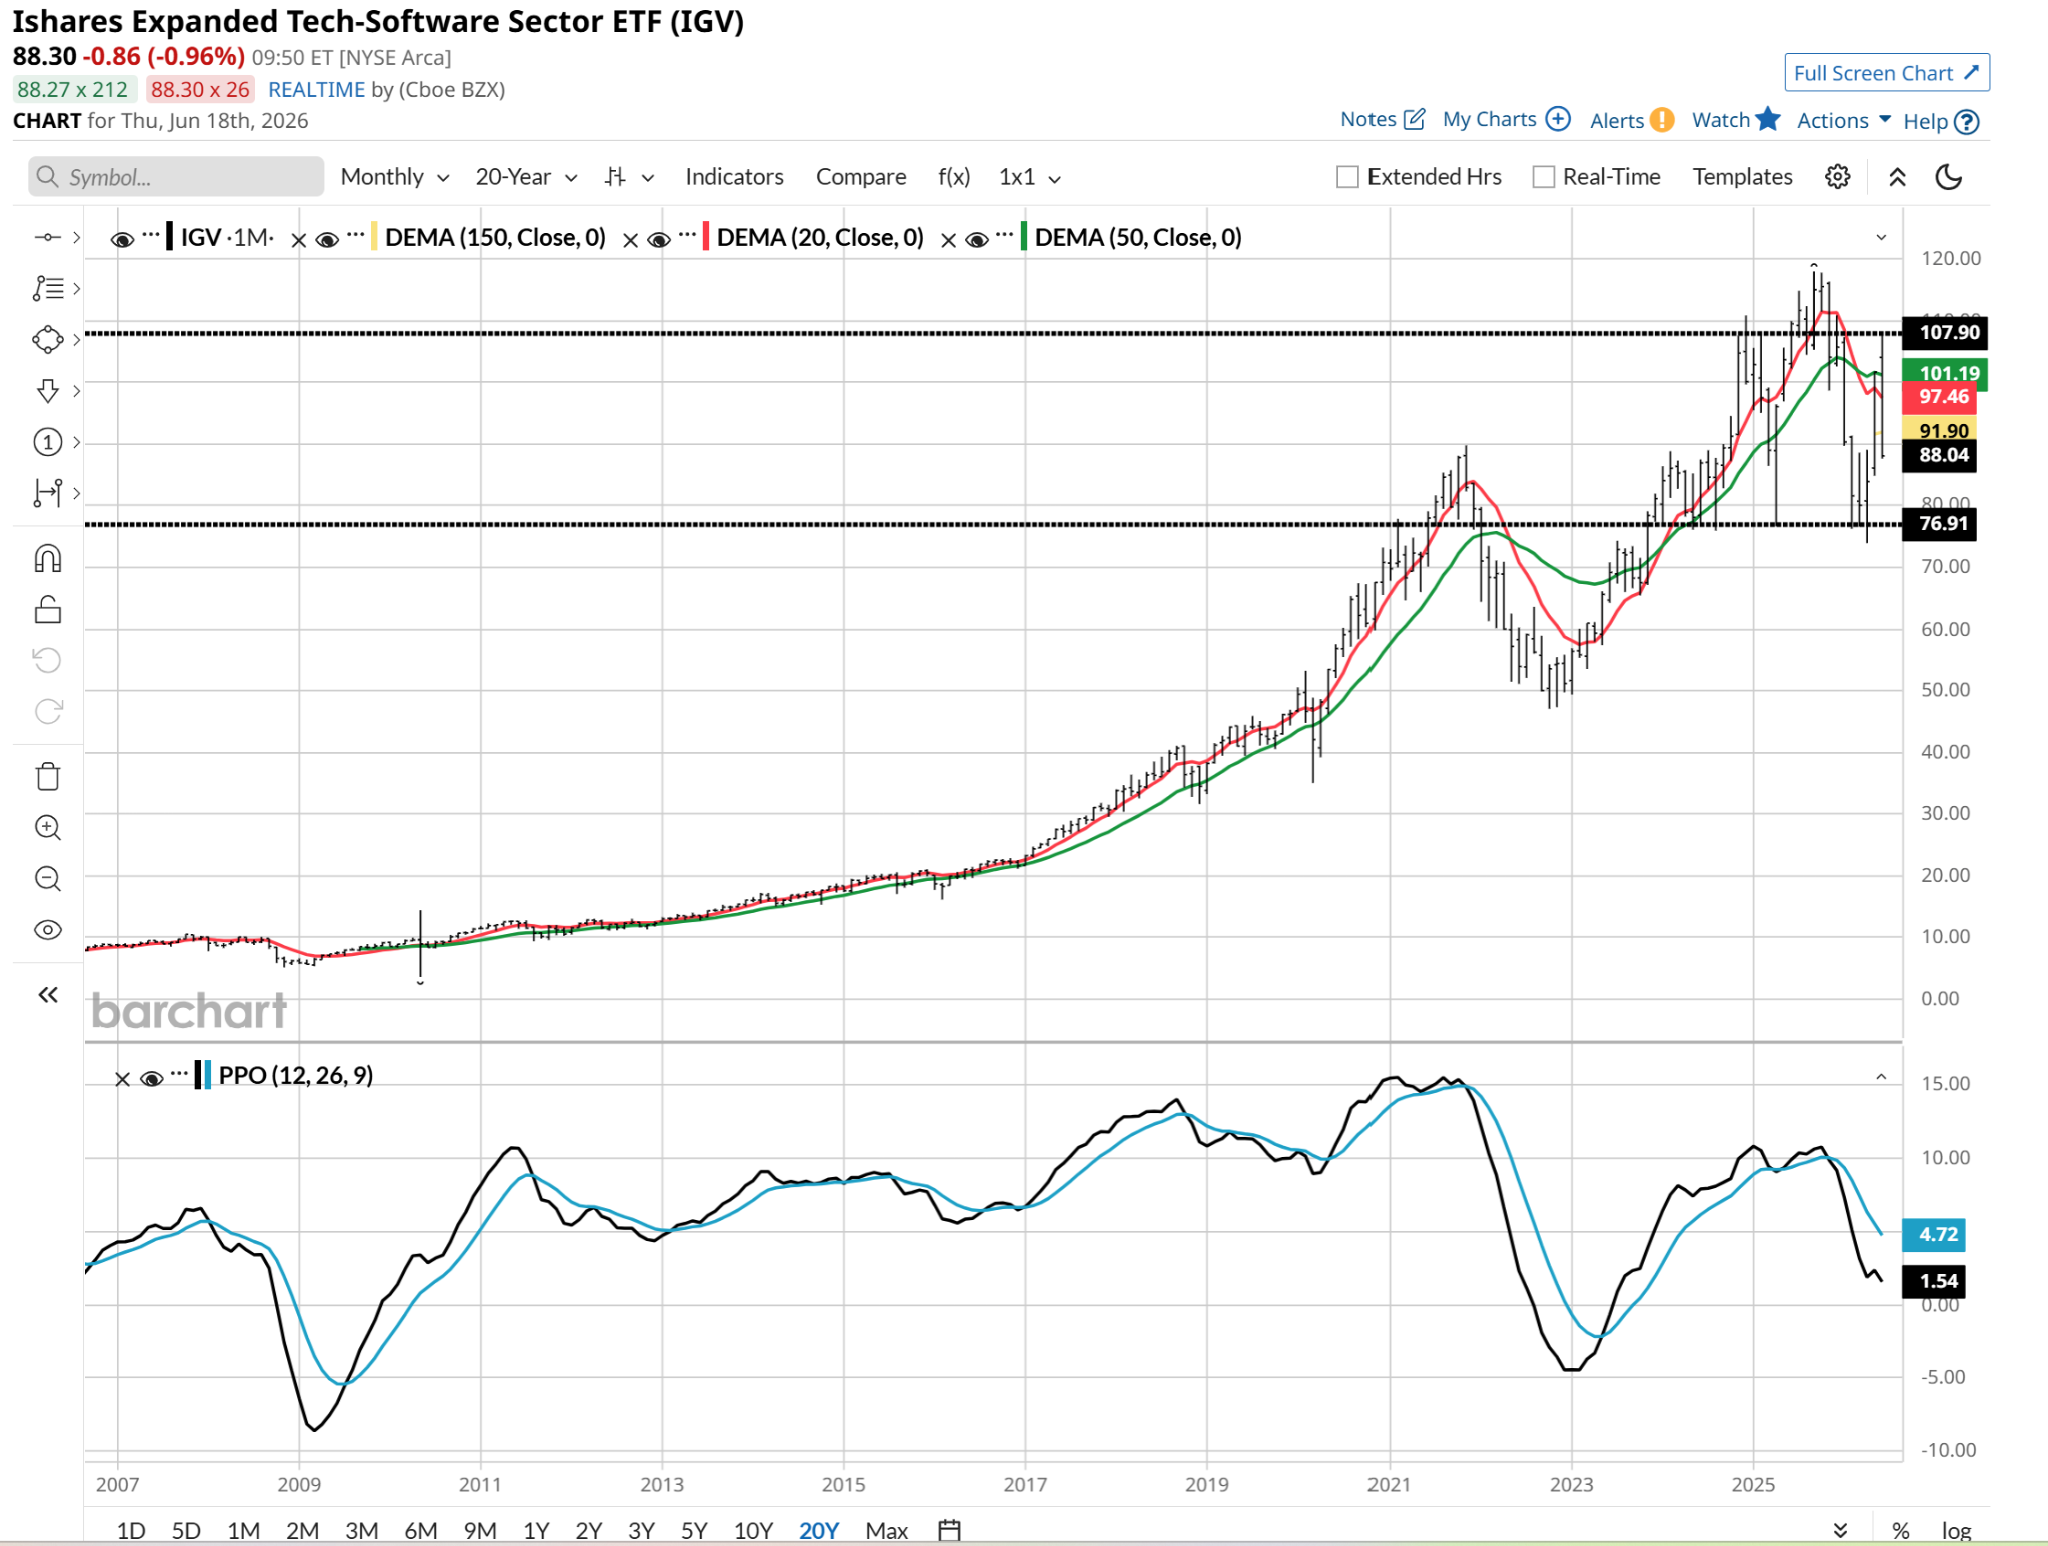
Monthly price charts are not always useful to me. But this one is. Specifically due to one feature. The PPO in the lower half of the picture just whiffed on a chance to bottom. This is a monthly bar chart, so that could be the next signal that these stocks are still on the outs with investors.
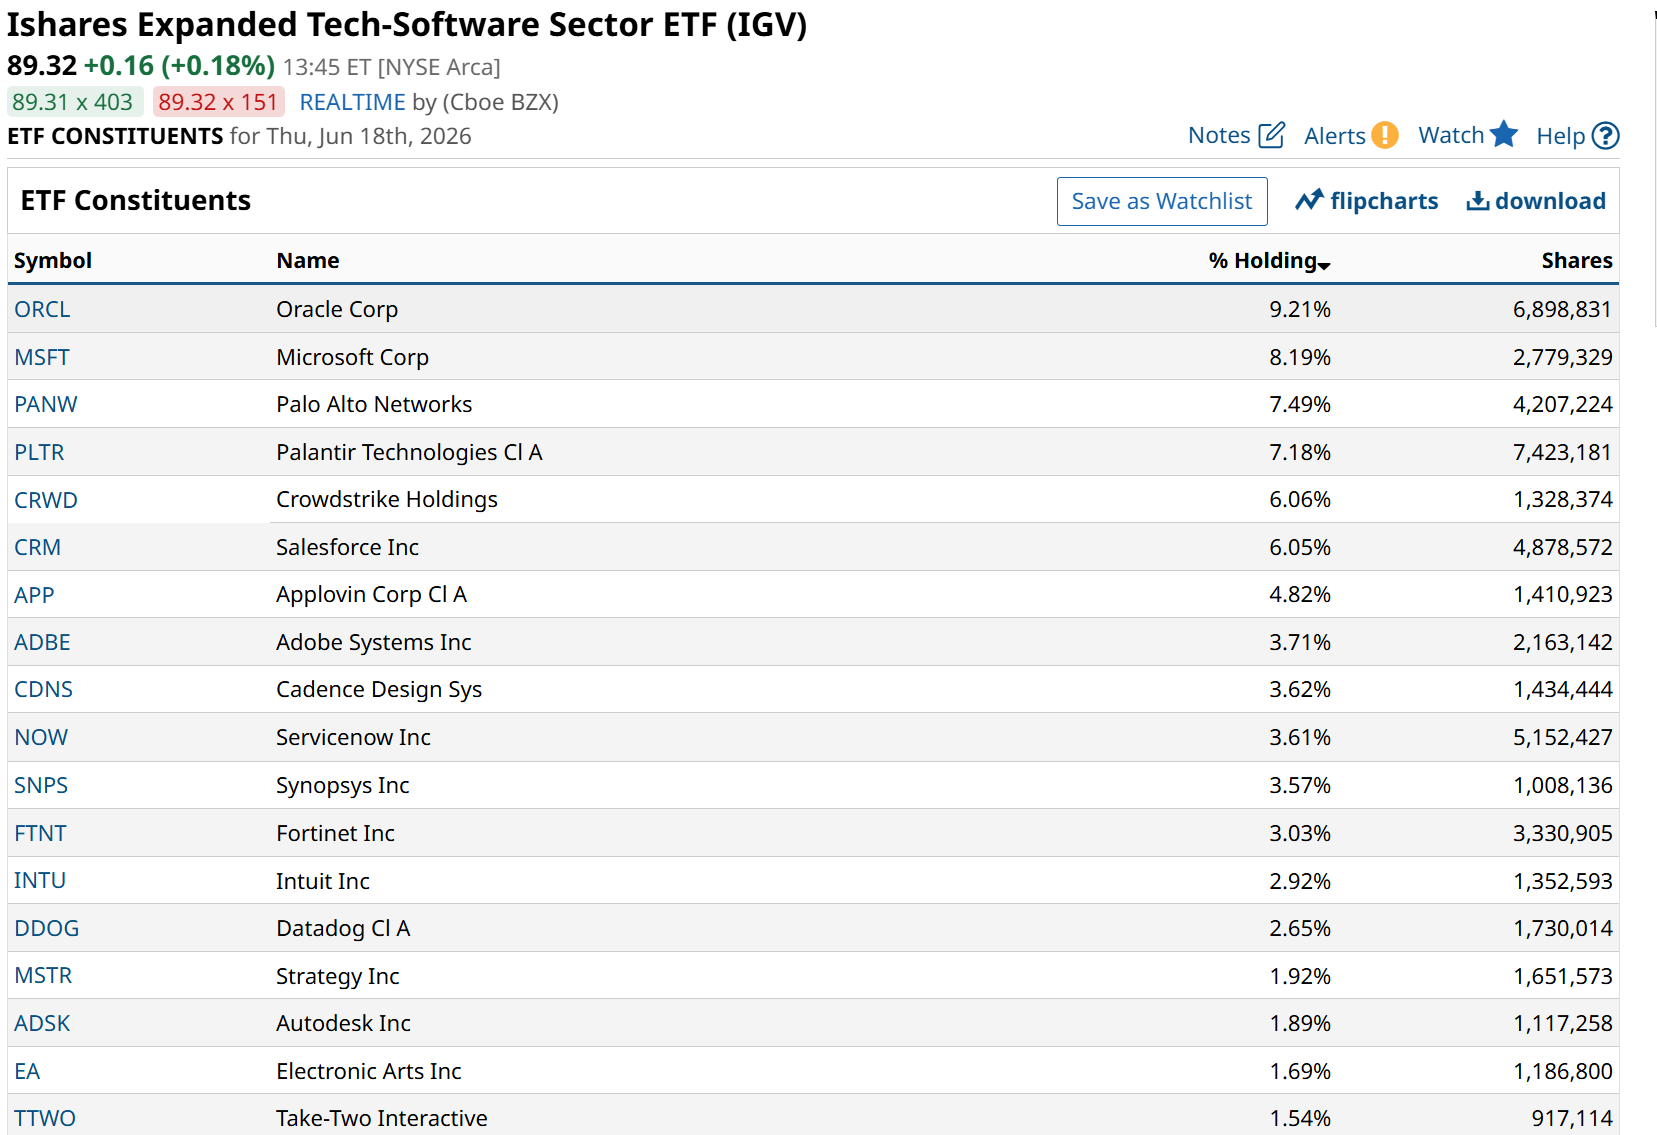
Here’s a swath of IGV’s biggest holdings. The ETF holds more than 110 stocks, but the 10 largest account for 60% of assets. So if you are looking for how to pick and choose your “meat,” look at the top of the list below.
This also explains why I like ETFs with reasonably liquid options. Because I see a chart setup like this and think, “What do I buy put options on?” It takes a lot of time, work, and thought to go through those top five or six names, price out put options on them, and let it fly. IGV was not always the most liquid option play. But as we see here, even going out to a monthly (not calendar quarter) expiration, there’s plenty of activity (Open Interest and Volume). In particular, someone or many traders placed a big bet on IGV moving below $90, as we see on the line for that strike price.
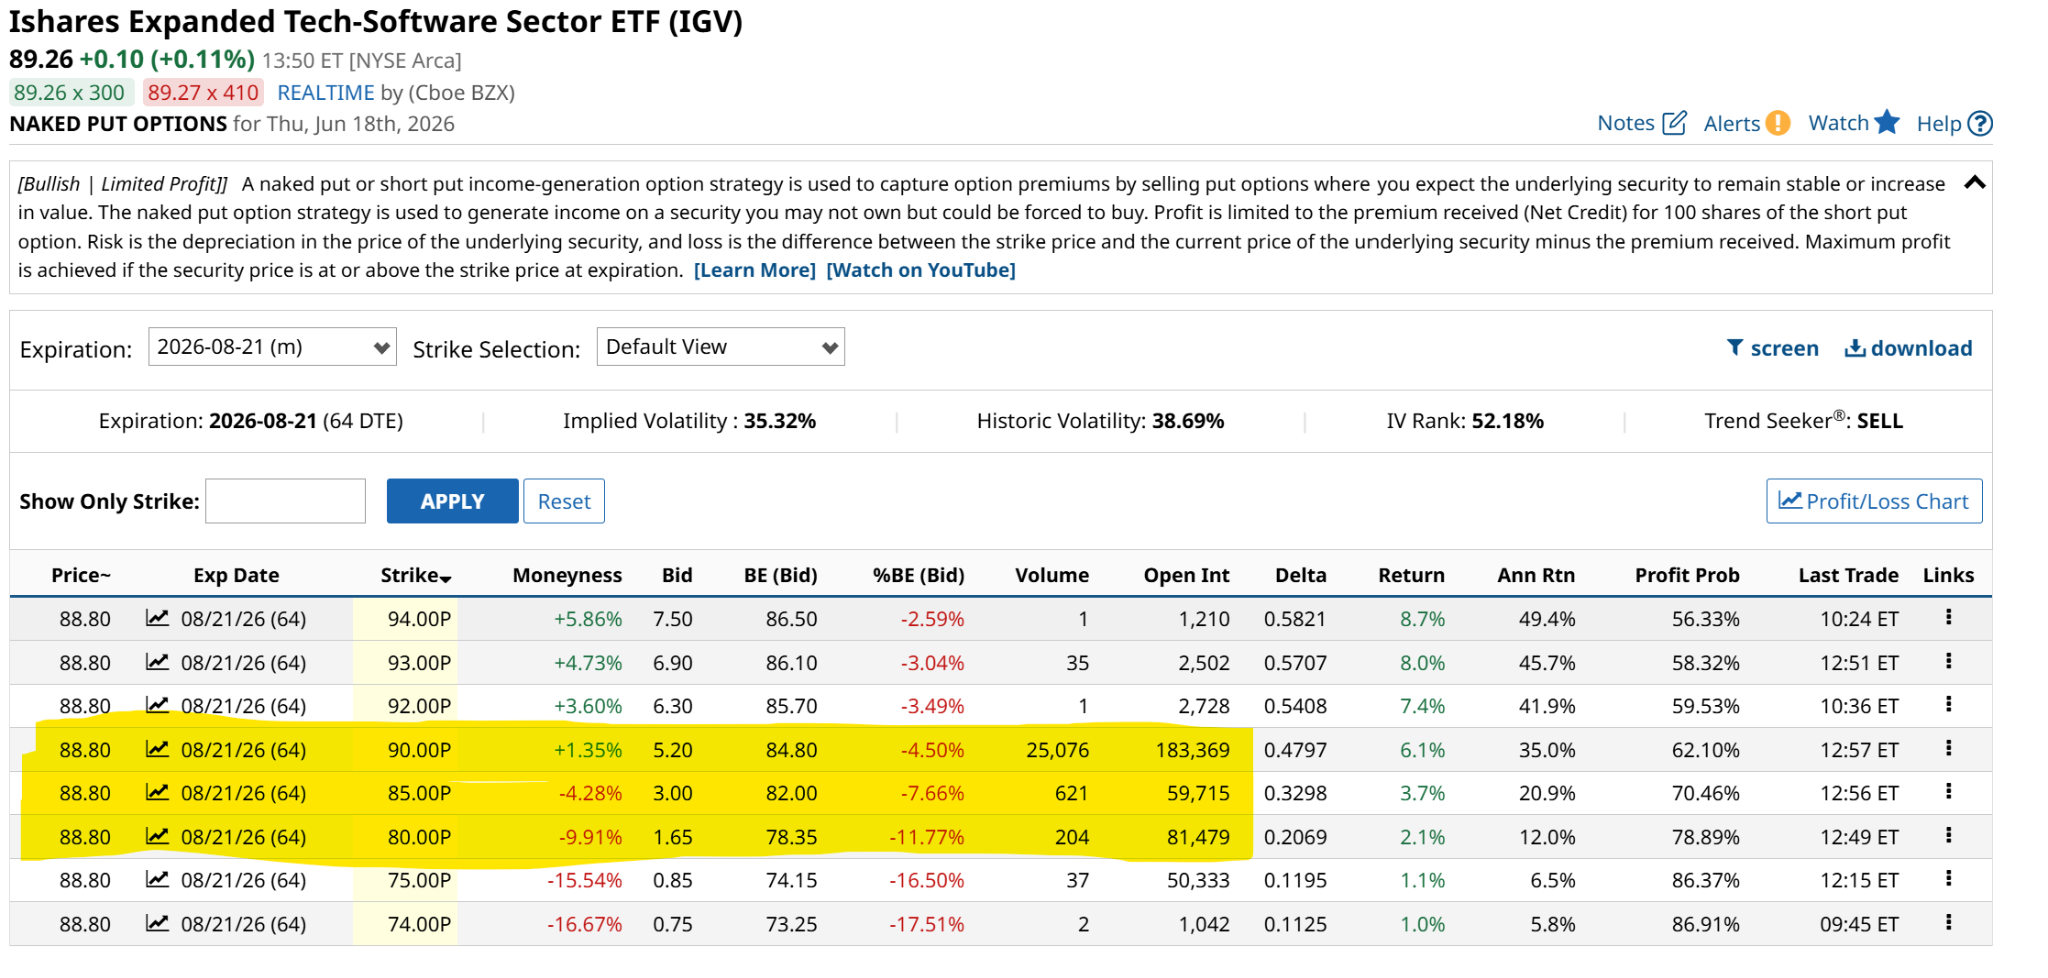
I see the attraction in all three of these. It is a matter of how much you want to risk. The $90 strike is essentially at the money as of this writing, but it costs three times as much as buying puts at the $80 strike, out to Aug. 21 of this year.
To me, the important thing is this: the market is angry with this industry, and is not letting it off the hook just yet. As I said, I do not prioritize narratives, but now that I have summarized the options play here as I see it, I’ll conclude with some quick notes on why software stocks are still looking this weak.
Why Are Software Stocks Down?
Software is no longer moving in lockstep with hardware. Instead, there’s clear operational decoupling inside IGV. While some select enterprise application giants manage to defend their valuations, a significant portion of the broader software roster is experiencing persistent technical friction.
This environment requires a total rethink of how we, as investors, manage risk in tech-heavy portfolios. This index is becoming a case of “haves and have-nots.” To me, it is similar to when REITs were subdivided in terms of attractiveness when the AI trade began in 2022. Data center REITs become the good guys, and traditional, higher-yielding REITs the bad guys.
The software sector remains an essential component of the economy. But if the market continues to sneer at it, why stand in the way? Instead, look for a way to capitalize on what the charts across multiple time frames appear to be saying — that the worst isn’t over for IGV.
Rob Isbitts created the ROAR Score, based on his 40+ years of technical analysis experience. ROAR helps DIY investors manage risk and create their own portfolios. For Rob's written research, check out ETFYourself.com.
On the date of publication, Rob Isbitts did not have (either directly or indirectly) positions in any of the securities mentioned in this article. All information and data in this article is solely for informational purposes. For more information please view the Barchart Disclosure Policy here.
/Micron%20Technology%20Inc_%20logo%20on%20building-by%20vzphotos%20vis%20iStock.jpg)

/AI%20(artificial%20intelligence)/AI%20engineer%20working%20on%20laptop%20by%20ART%20STOCK%20CREATIVE%20via%20Shutterstock.jpg)

/A%20corporate%20office%20for%20IBM%20by%20HJBC%20via%20Adobe%20Stock.jpeg)