On March 8, 2023, the USDA released its March World Agricultural Supply and Demand Estimates Report, the fundamental gold standard for producers and consumers. The monthly WASDE report outlines a snapshot of U.S. and worldwide inventories and other production and consumption data. The full text of the March WASDE is available via this link.
Grains and oilseed prices have retreated from the 2022 highs but remain elevated at the start of the 2023 crop year.
Sal Gilberte’s take on the March WASDE report
Sal Gilberte founded the Teucrium family of agricultural ETF products, including the CORN, SOYB, and WEAT ETFs. Sal told me:
Today’s WASDE confirmed some longstanding trends in the grain markets. Most significantly, these estimates predict the US will use more corn than it produces for the sixth consecutive year; the same is now true for soybeans for the third consecutive year. Soybean ending stocks in the US at 210 million bushels represent a particularly delicate balance between adequate supplies and supplies that begin to become uncomfortably low. It is worth noting that the US soybean stocks/use ratio is now projected at 4.8% compared to the rolling five-year average of 11.6%.
Globally, this will be the third consecutive year that we’ve used more wheat than has been produced; global ending wheat stocks continue their decline. Global corn use will exceed production this year as well, and global corn stocks are projected to decline by about three percent year-on-year as a result. Interestingly, markets reacted with a slight downward move, perhaps for the moment traders are more concerned with recent discounted Russian wheat offers in the Black Sea than with the relatively tight fundamental picture painted by the USDA.
Worth noting is the large decline in Argentine grain production in the March WASDE, especially because some private analysts in South America currently put Argentina’s production numbers lower than the USDA’s March numbers.
Also embedded in the WASDE numbers is the vast amount of grain inventories China claims to hold. If the numbers are to be believed, China holds an incredible seventy percent of the world’s total excess corn, fifty-two percent of all excess global wheat, and thirty-four percent of global soybeans. Let’s hope that China actually has the grain it says it does.
Balance sheets in the grain and oilseed markets remain tight going into the 2023 crop year, which could make for explosive moves if Mother Nature does not supply optimal weather conditions that support bumper crops. The war in Europe’s breadbasket and the critical logistical hub at the Black Sea ports only exacerbate the need for significant production. Meanwhile, Sal’s comment, “Let’s hope that China actually has the grain it says it does,” is correct. China has a habit of being less than forthcoming with its stockpile data, which it views as a state secret. However, that state secret will impact the agricultural products that feed the world.
Soybeans post-WASDE
The USDA told the soybean market that U.S. and global stockpiles fell from the February report. May CBOT soybean futures were sitting around the $15 per bushel level on March 13.
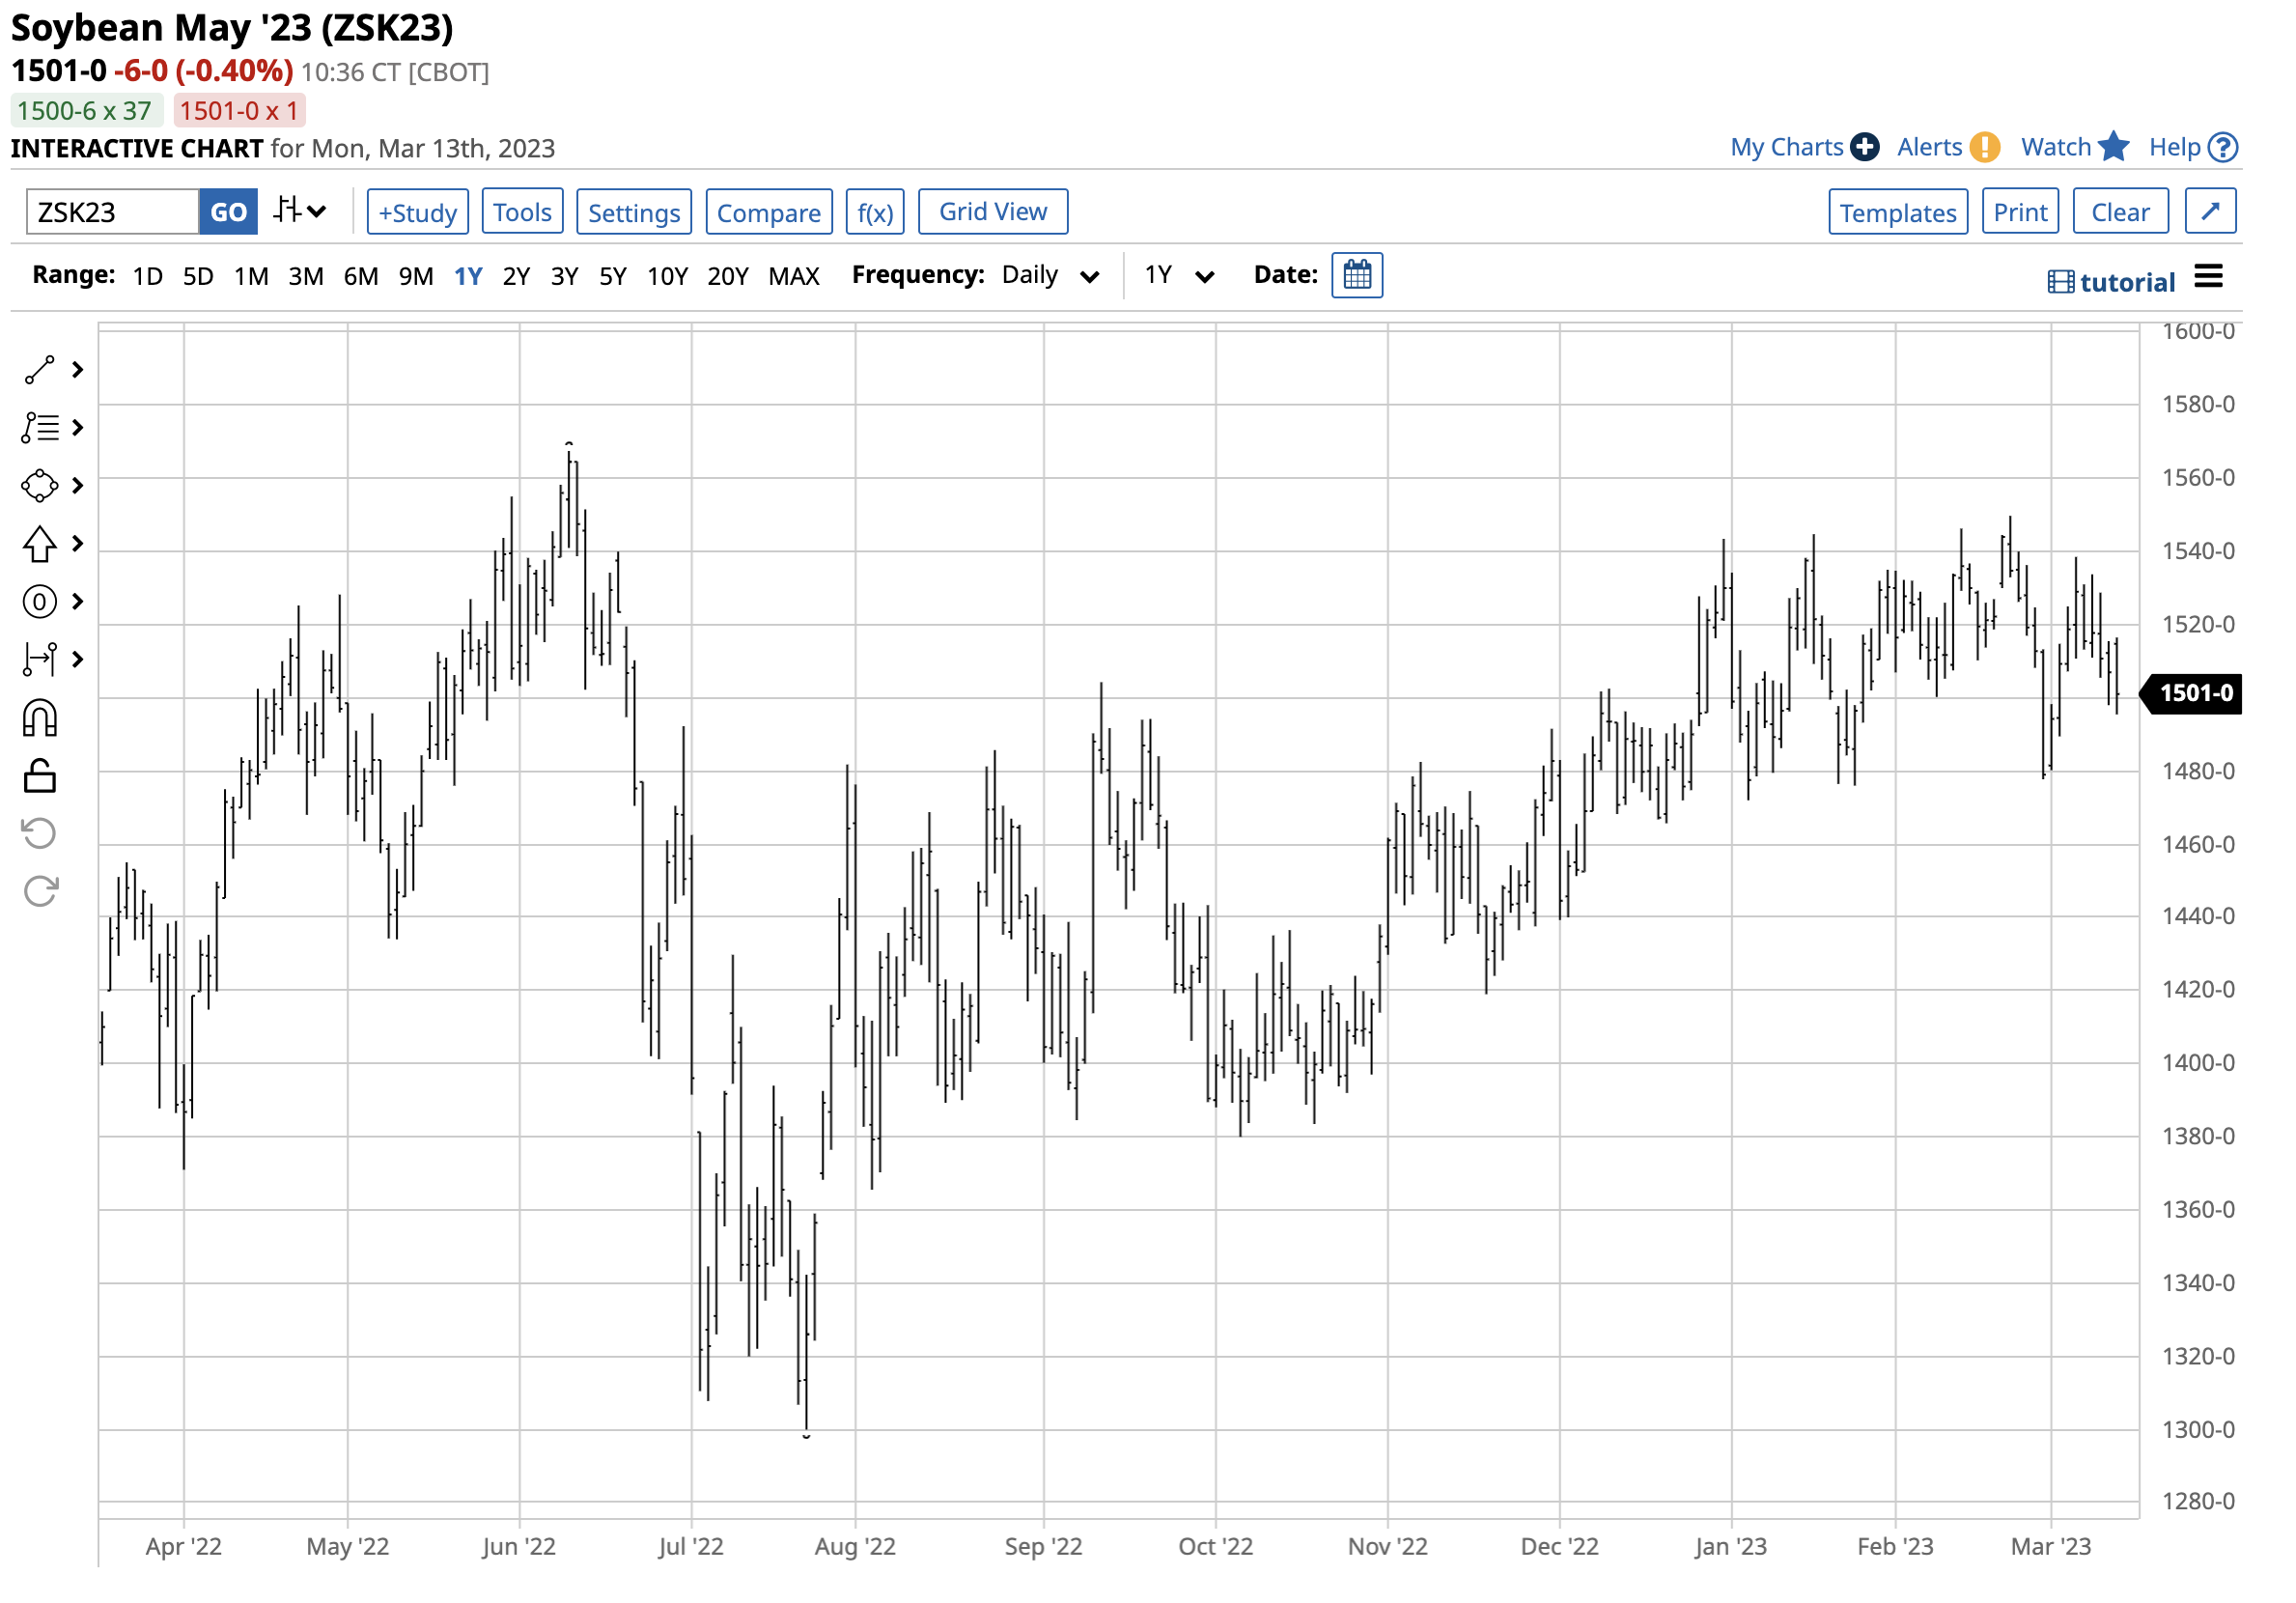
The chart shows the bullish pattern of higher lows and higher highs since the July 22, 2022, $13.00 low on the May contract.
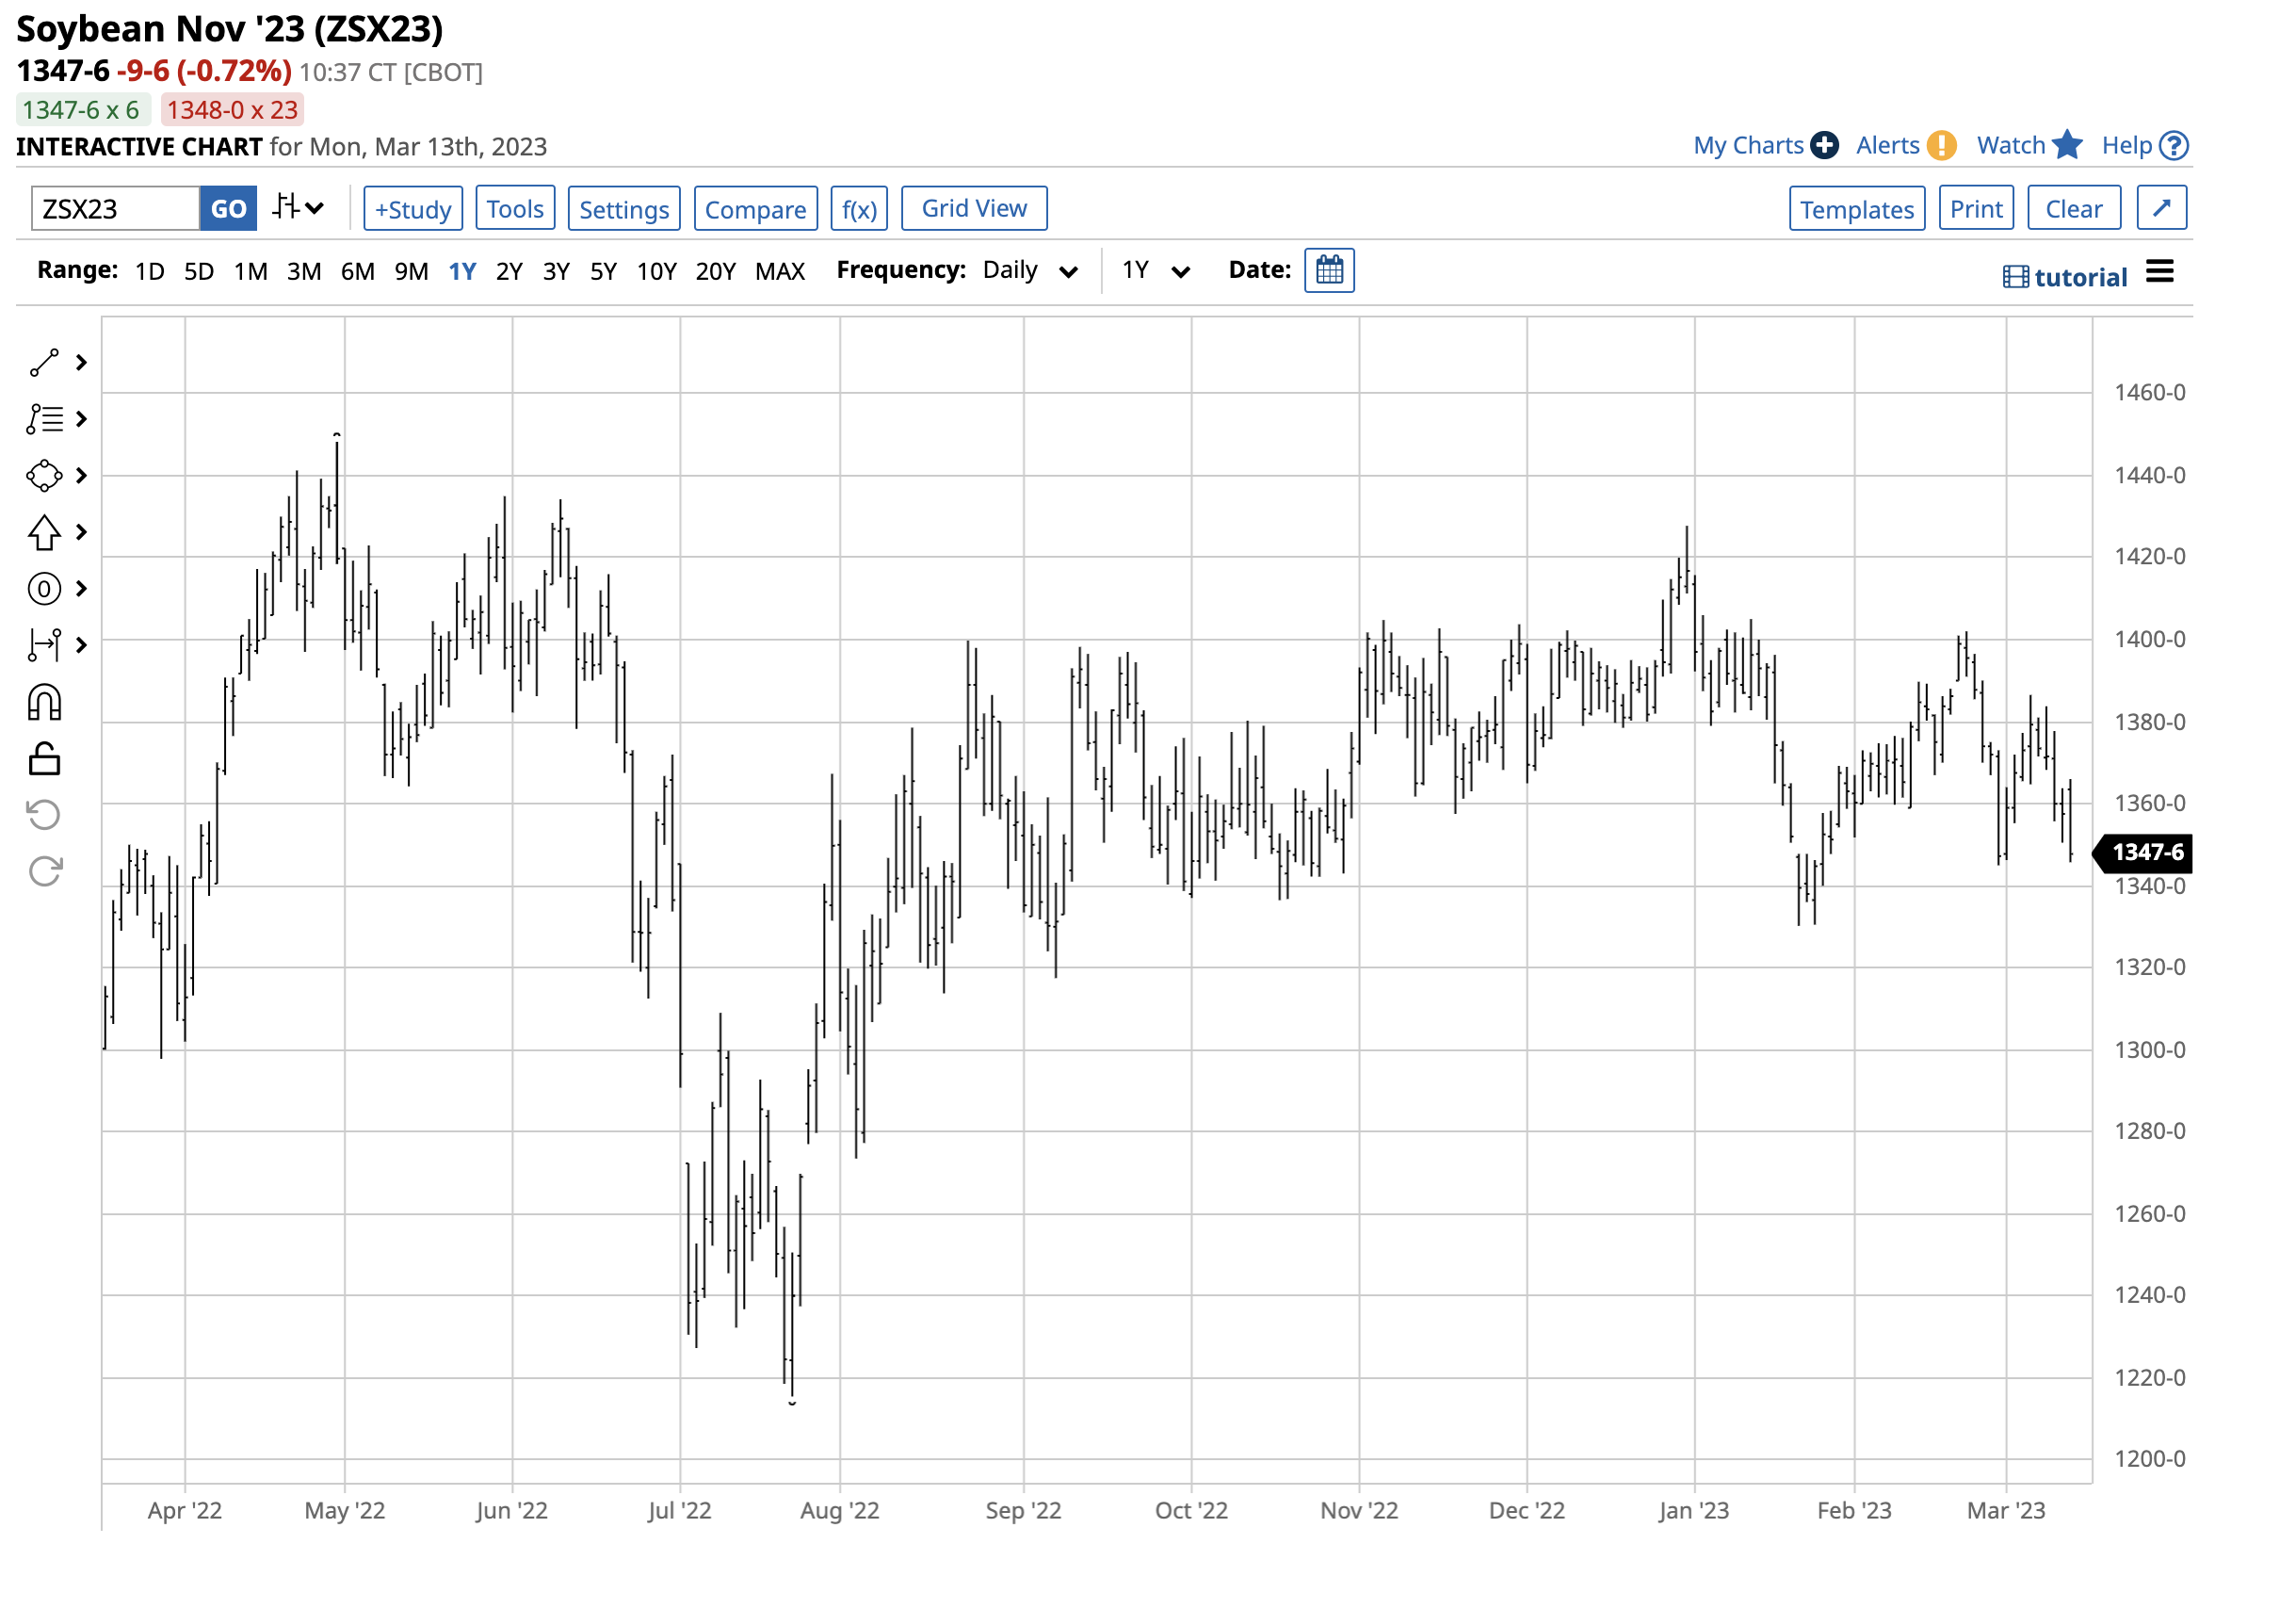
Meanwhile, new-crop November 2023 soybean futures were trading at $13.48 per bushel. The approximately $1.50 per bushel discount for November beans reflects the market’s tightness. Backwardation, or the forward discount, indicates the market’s optimism that farmers will increase output, pushing the 2023 crop prices lower over the coming months. However, the November bean price depends on Mother Nature as favorable weather conditions are critical for a bumper crop and lower price levels.
Corn backs off but remains elevated
In the March WASDE, the USDA increased U.S. and worldwide ending inventories compared to February levels, pushing corn prices slightly lower.
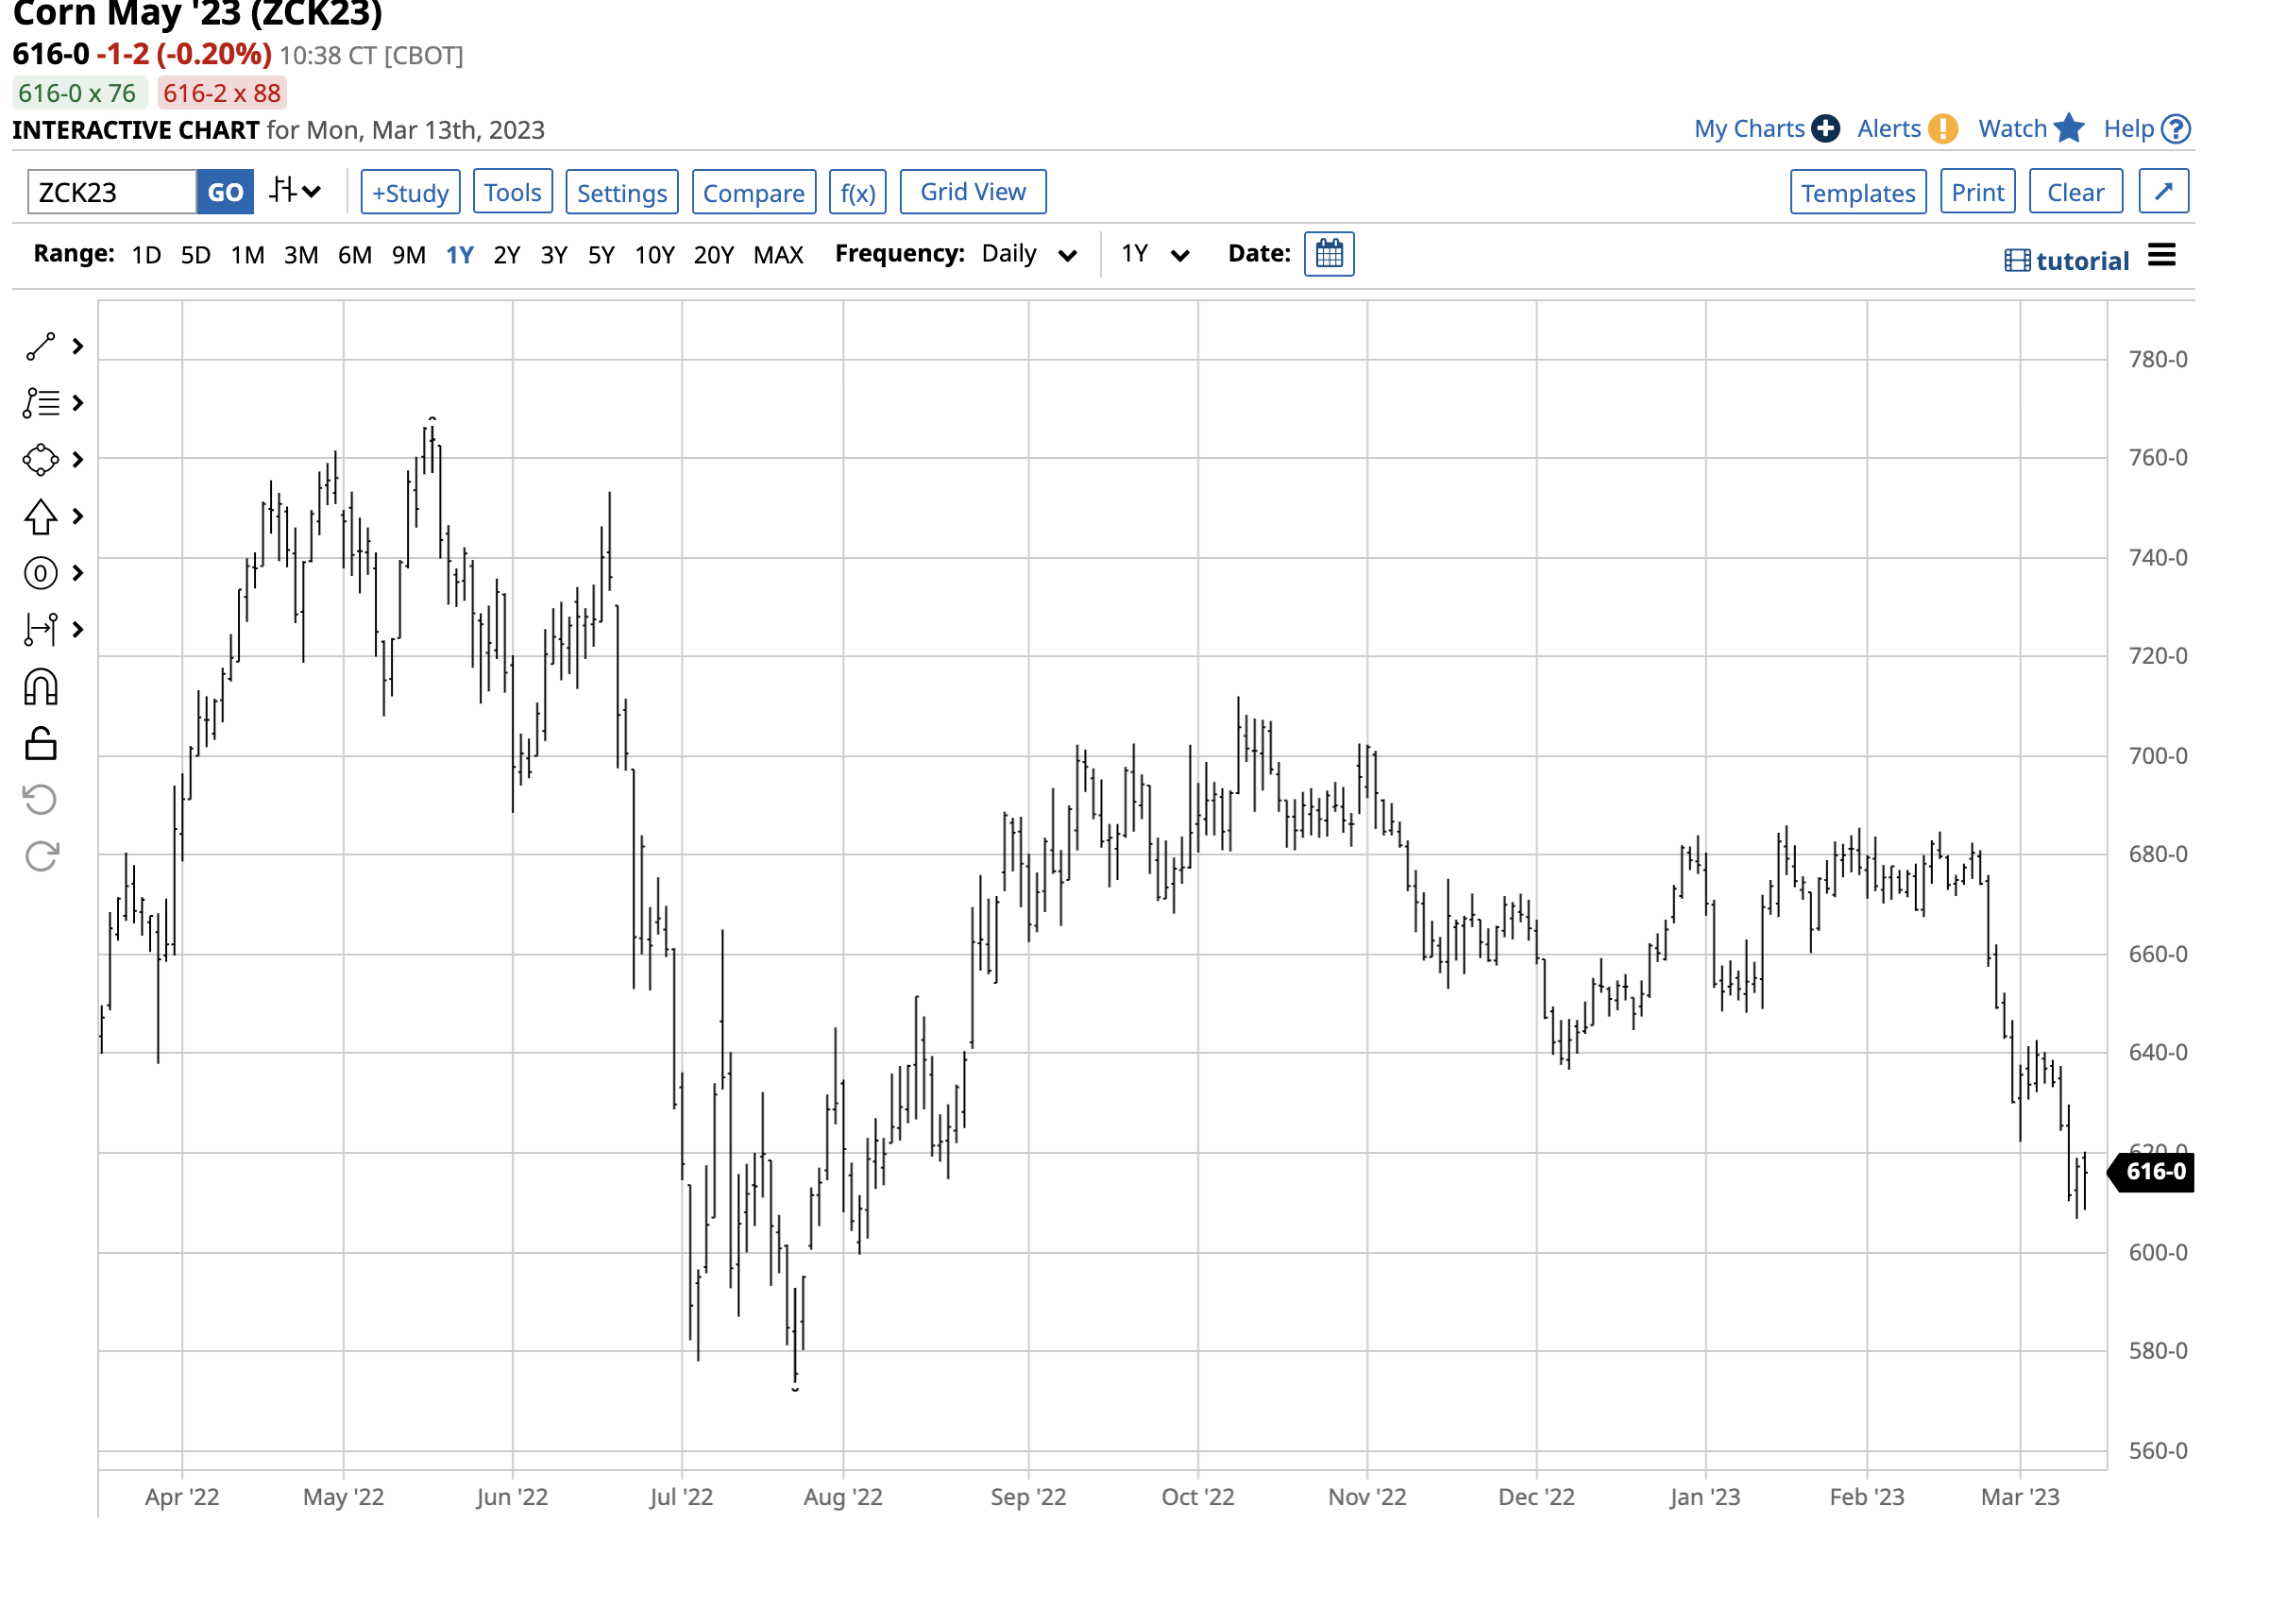
At just the $6.16 per bushel level on March 13, CBOT May corn futures have been trending lower after consolidating between $6.40 and $7.00 per bushel level from August 2022 through February 2023.
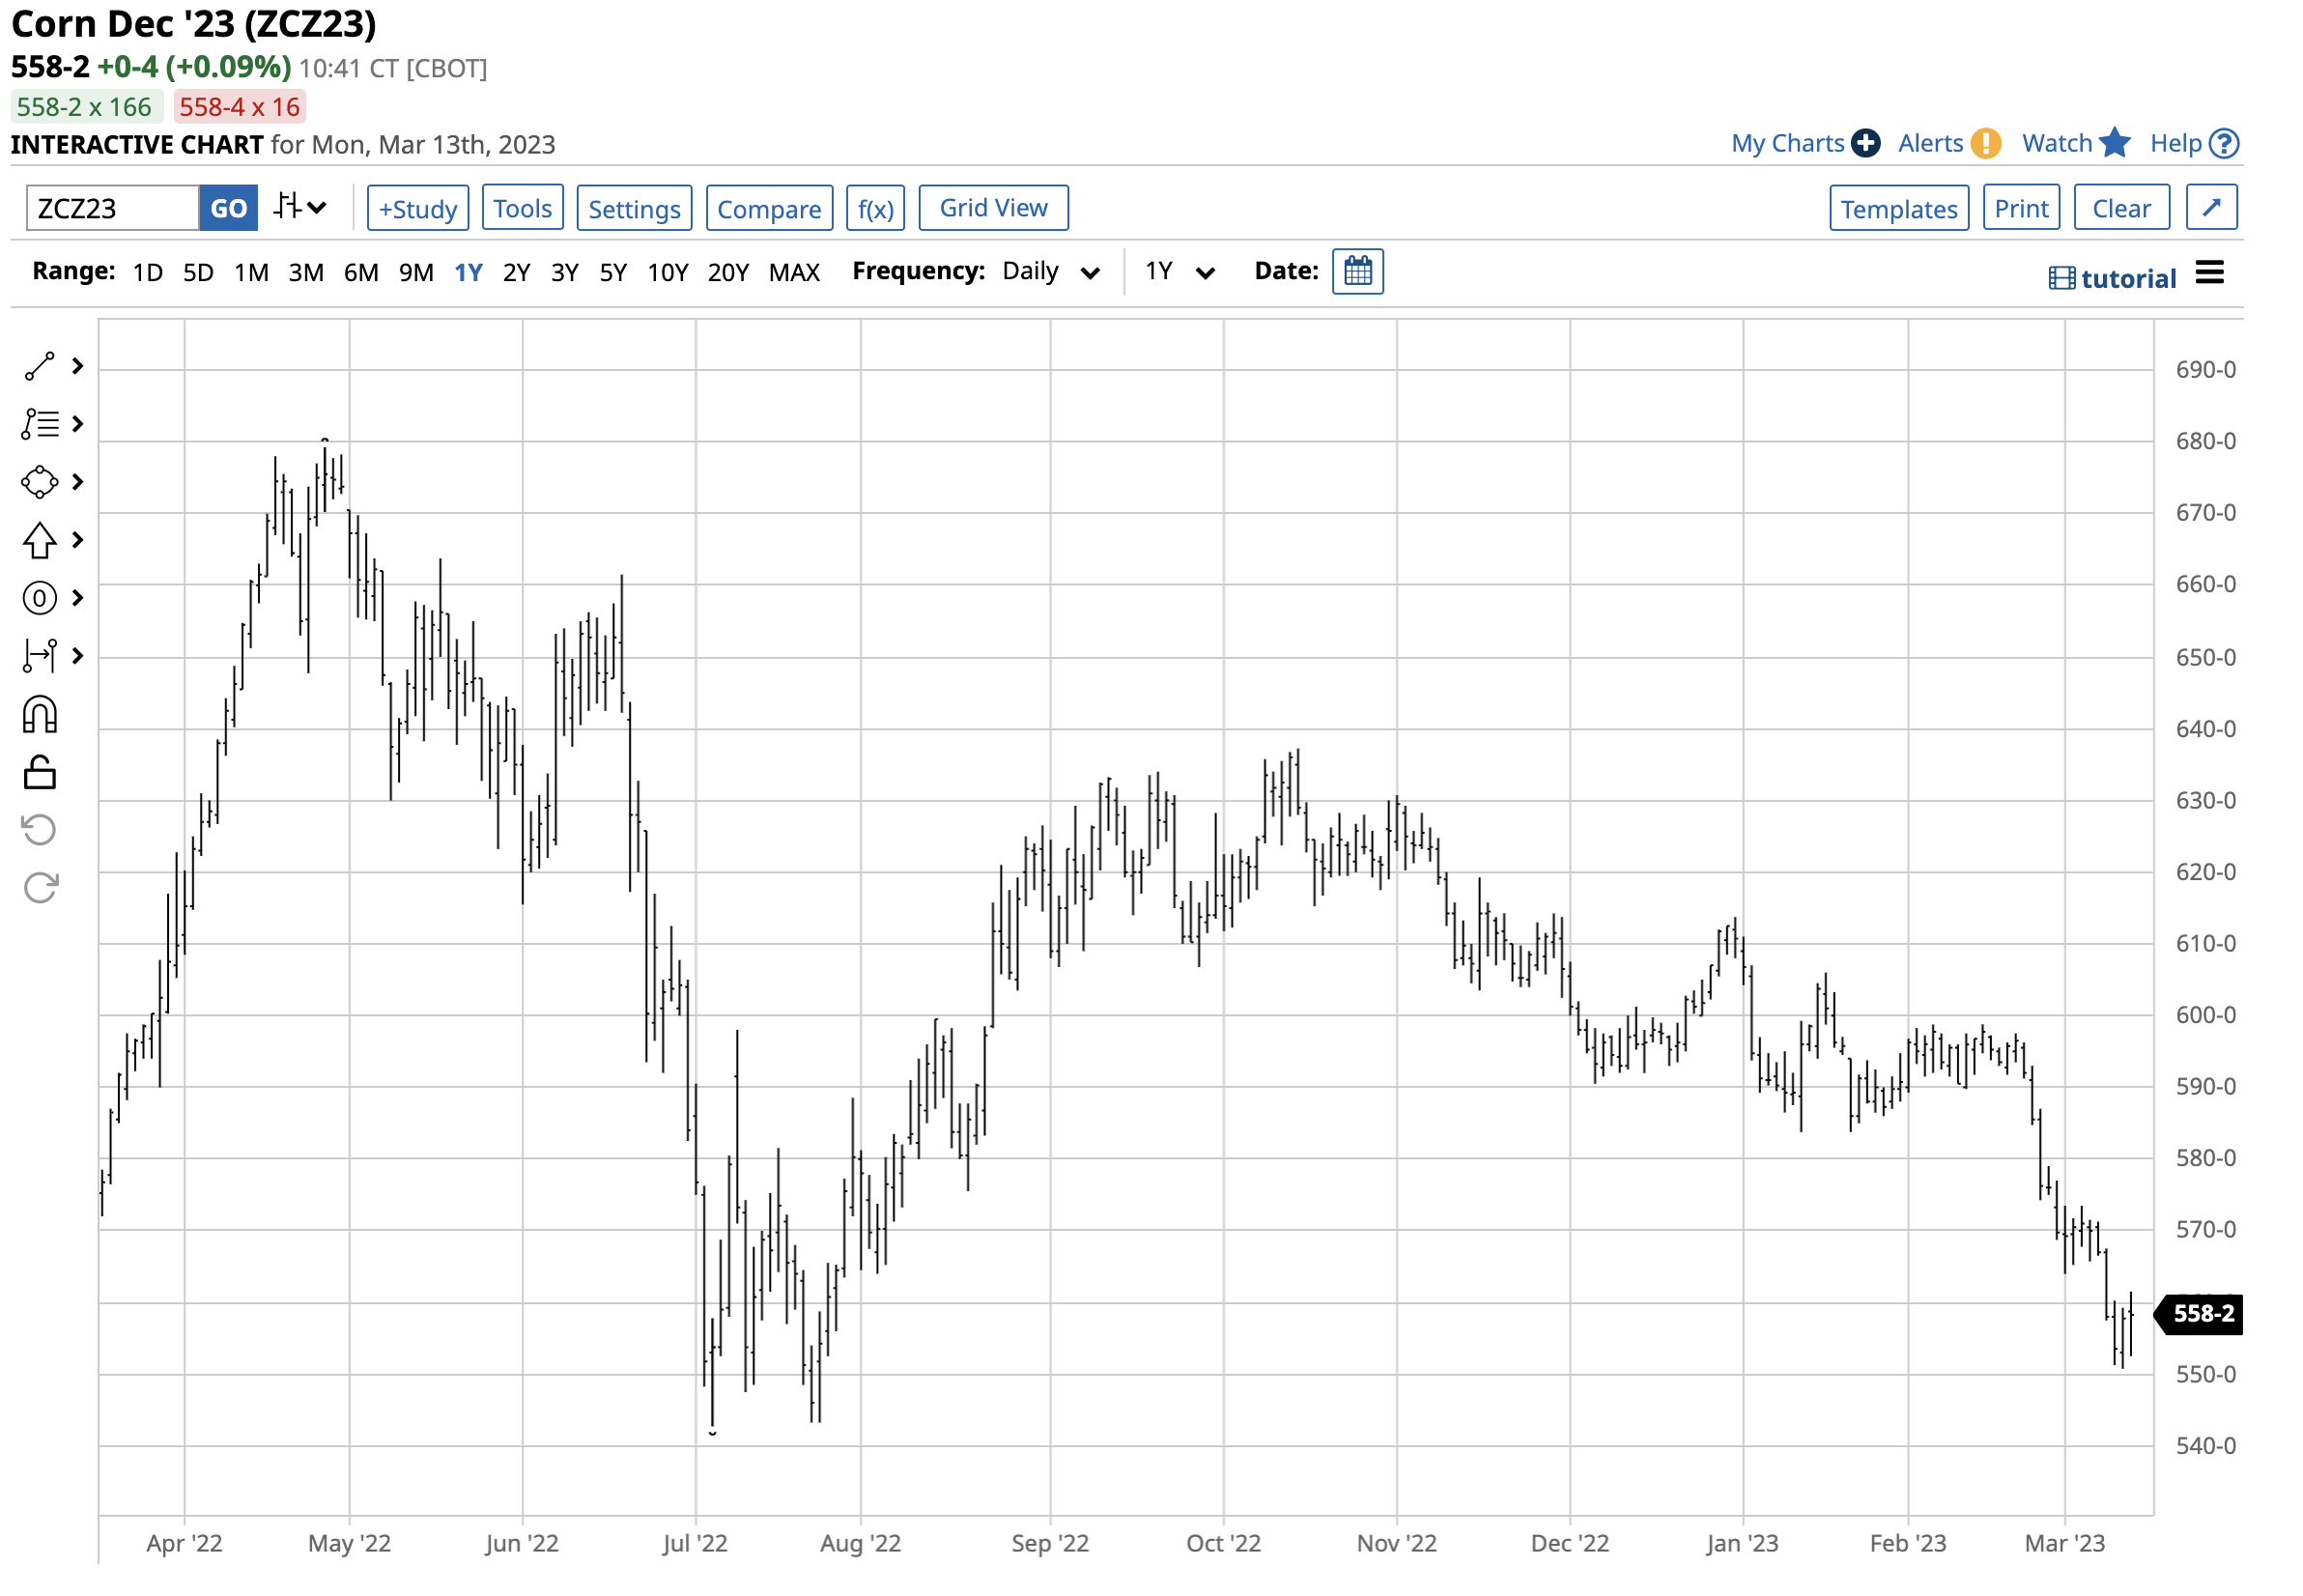
The price action in the new-crop December futures market is a sign of tightness in the corn market.
The price action in the new-crop December futures market is a sign of tightness in the corn market.
The chart highlights the nearly 60 cents per bushel discount for new-crop corn for December 2023 delivery. The backwardation reflects nearby supply concerns and the belief that the 2023 crop will improve the situation as farmers produce more coarse grains at higher prices.
While the weather is critical, energy prices will also play a role in the path of least resistance of corn and soybean prices. Corn is the primary ingredient in U.S. ethanol, and soybean oil in biodiesel. If traditional energy prices rise over the coming months, they will put upward pressure on corn and bean prices.
Wheat falls below $7 but a critical spread remains bullish
The USDA lowered its expectations for worldwide wheat stockpiles. CBOT soft red winter wheat futures have been trending lower over the past months and were over the $6.90 per bushel level for May delivery on March 13.
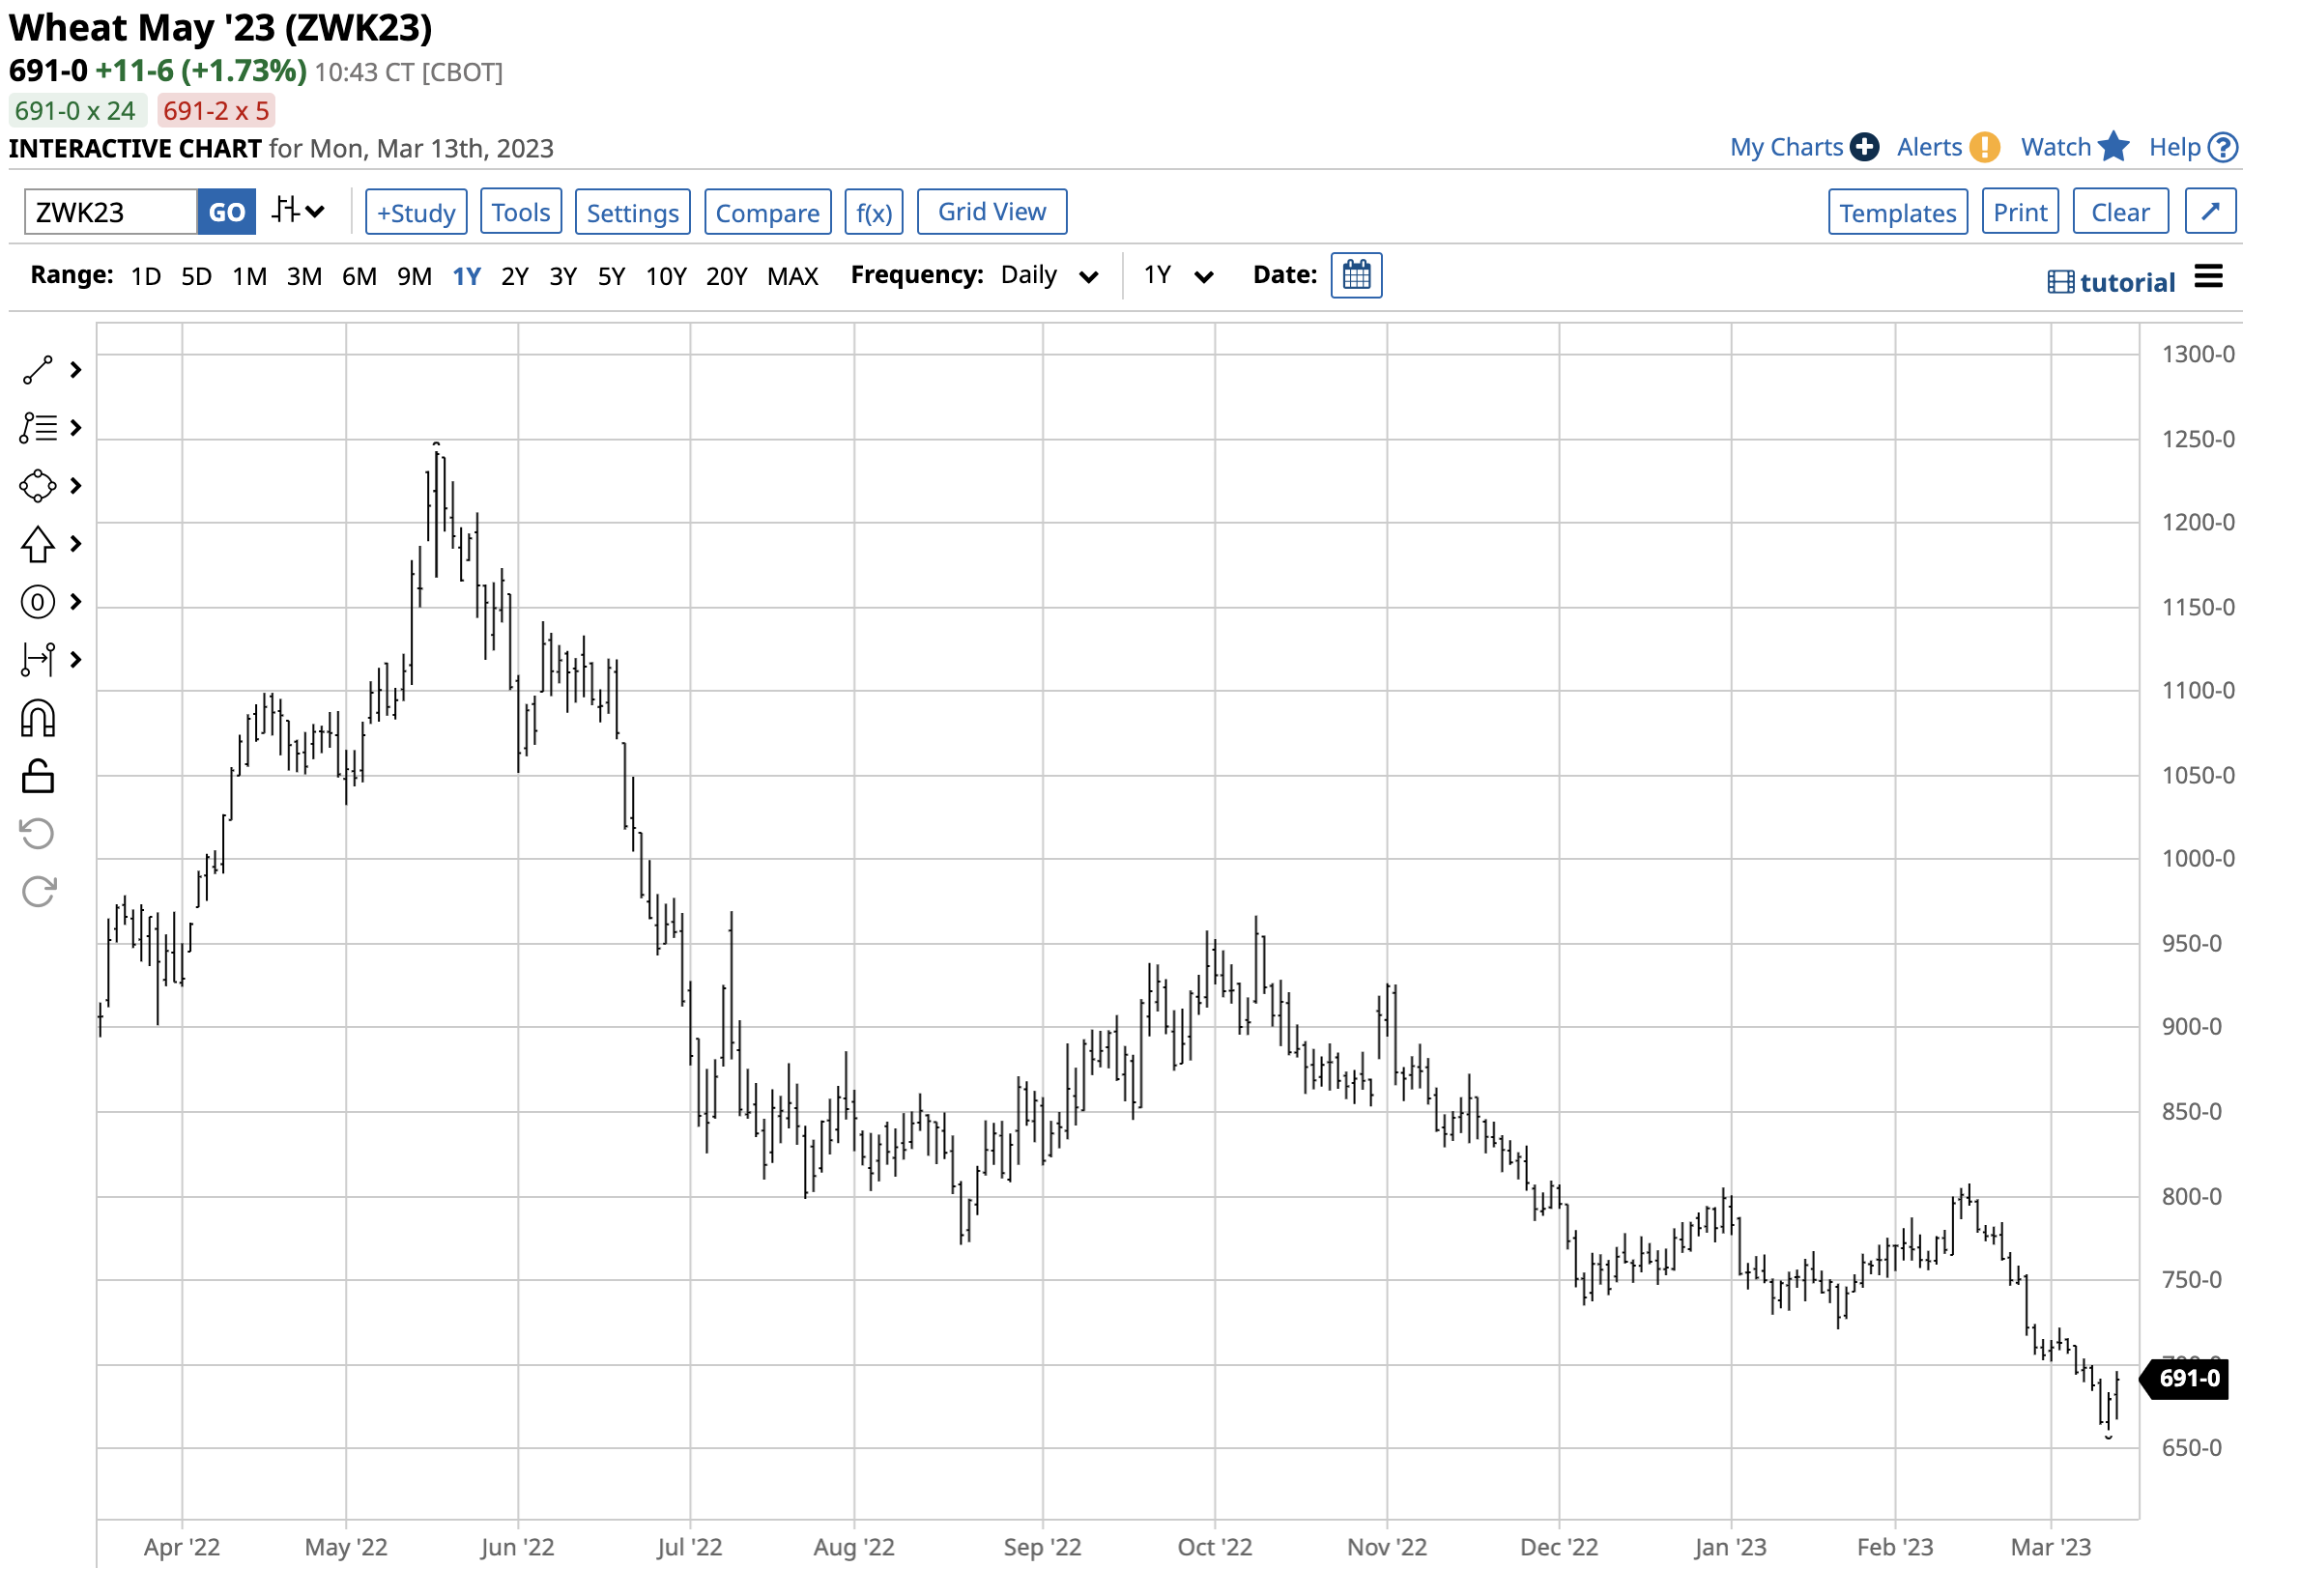
The chart illustrates the bearish trend in May CBOT wheat futures. After trading to a record $14.2525 high in March 2022, CBOT wheat futures have more than halved in value one year later. Wheat futures are not in a backwardation.
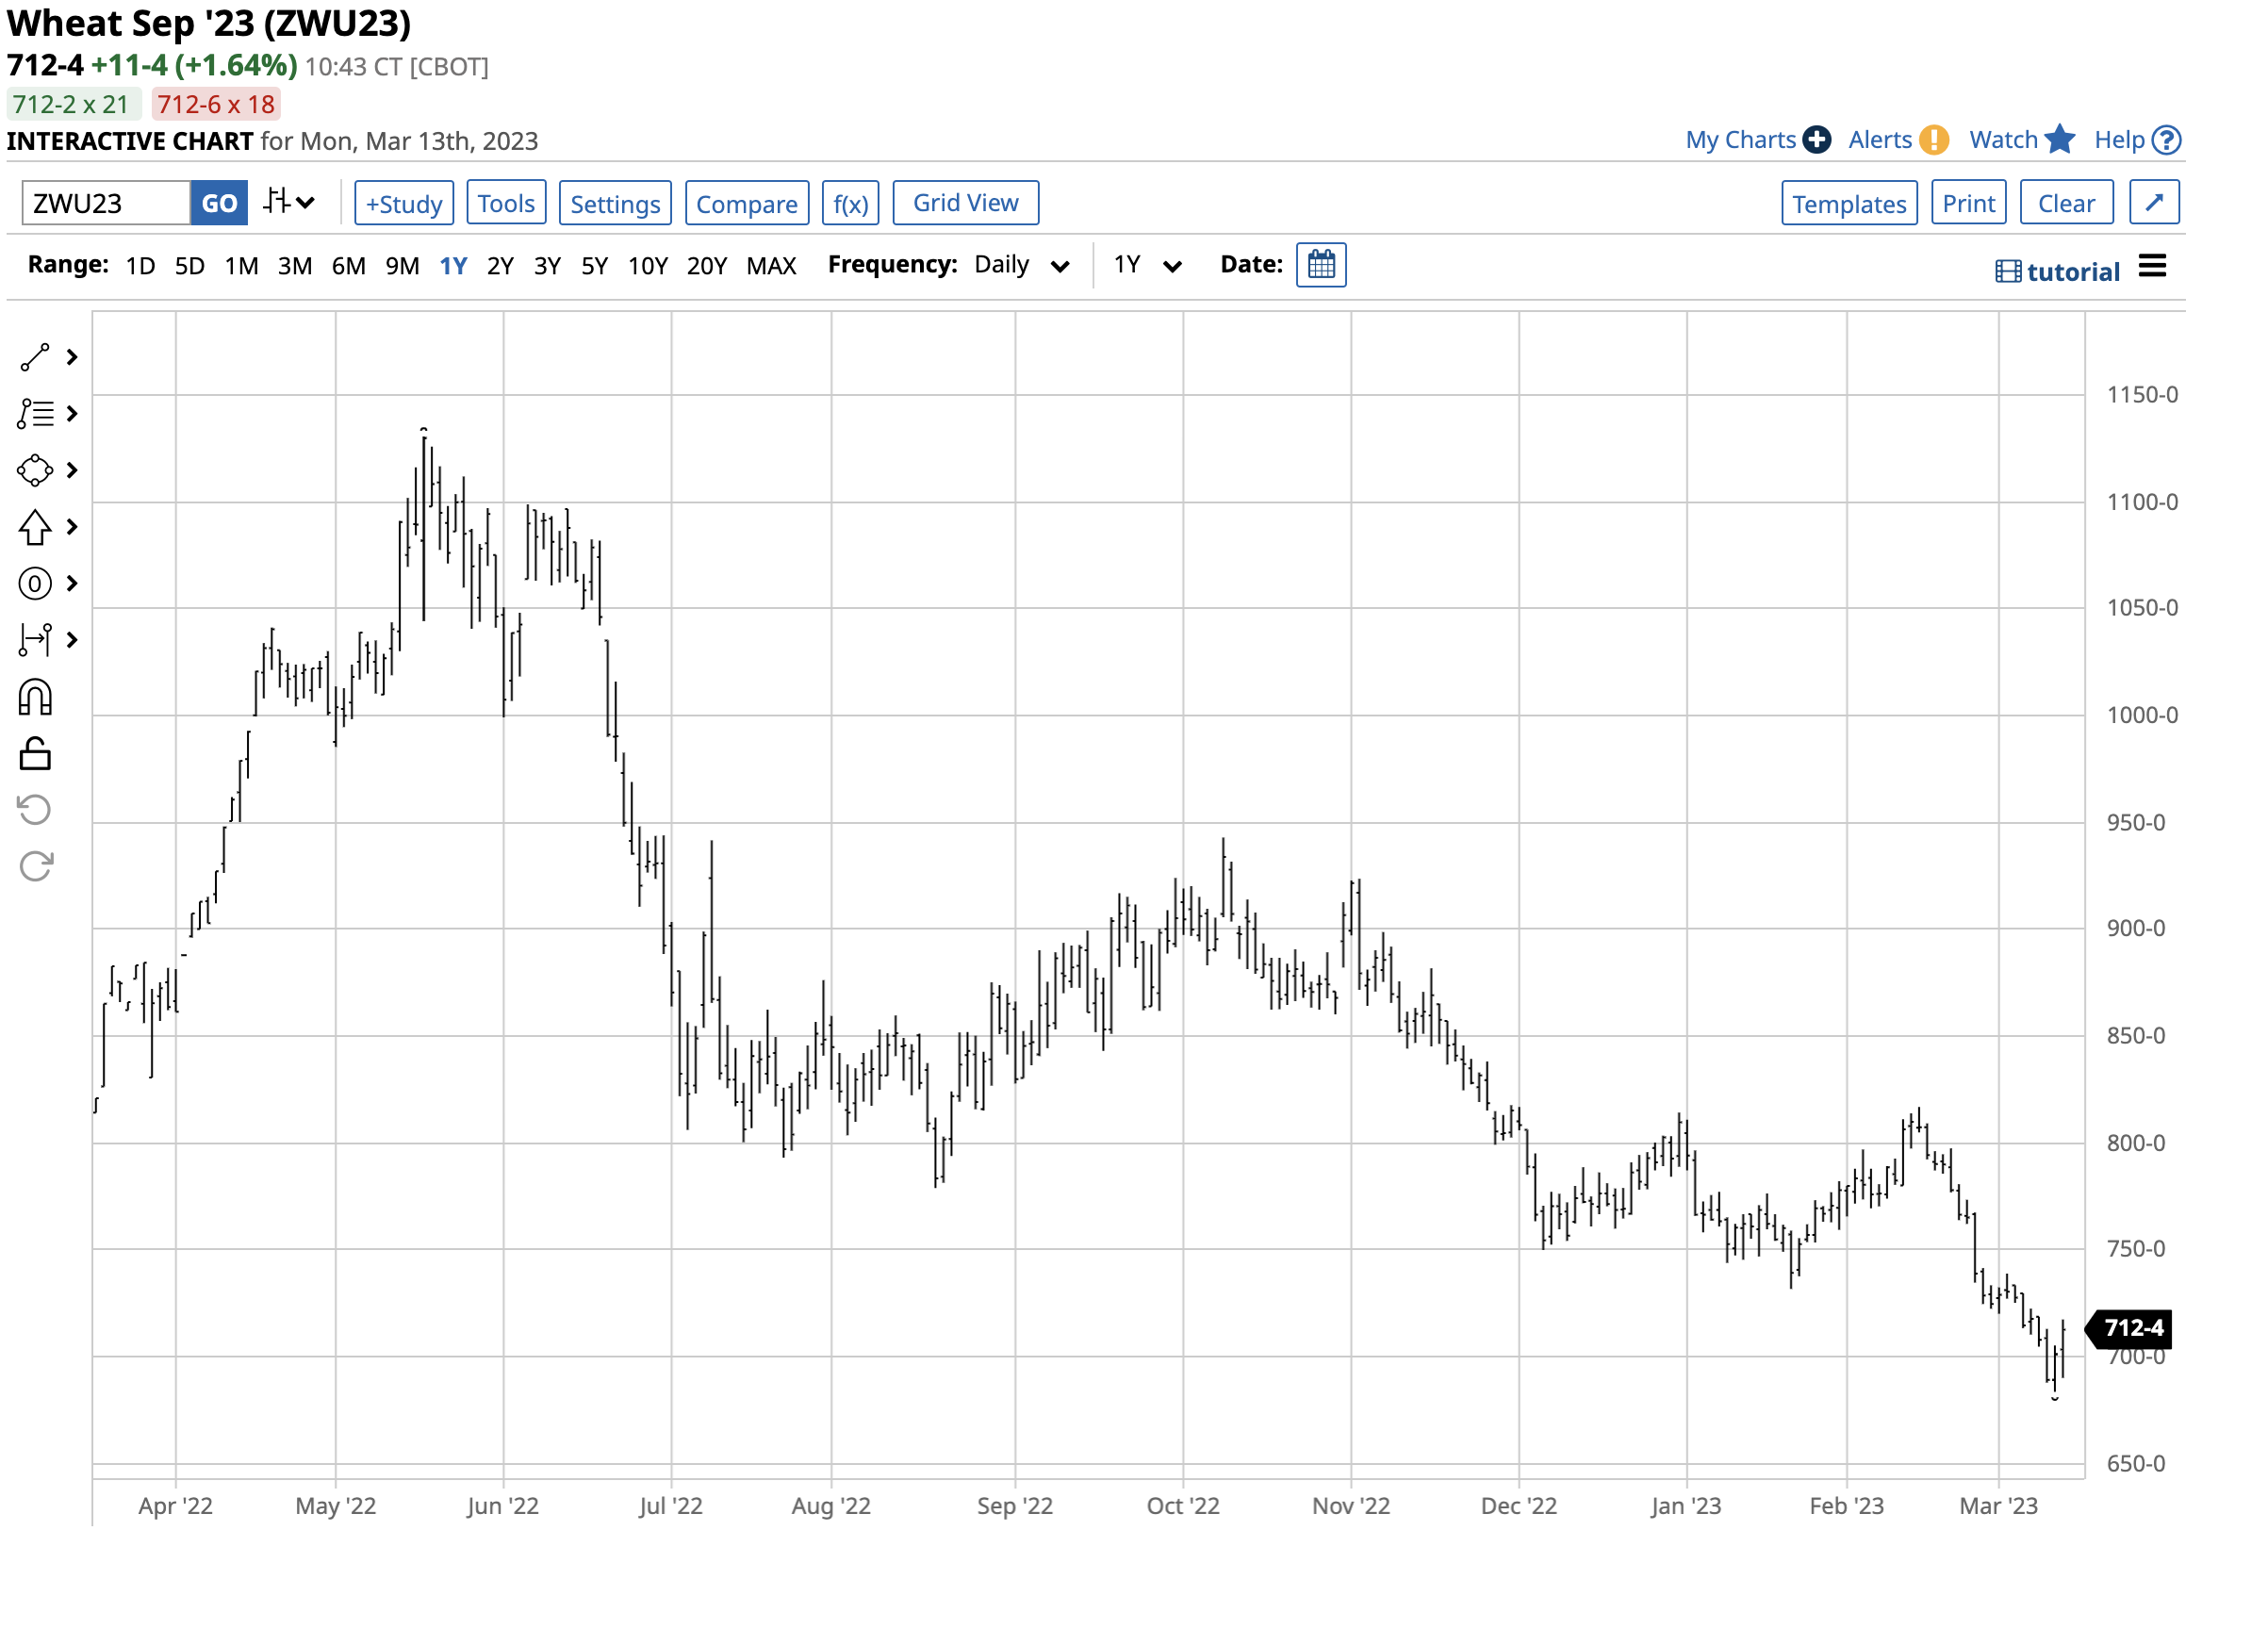
The chart of new-crop September CBOT wheat futures shows the over 20 cents premium to nearby May futures. The contango or forward premium indicates few nearby supply concerns, but the market expects higher prices over the coming months. Moreover, since Russia and Ukraine are leading wheat-producing countries and exporters, wheat is the grain in the eye of the storm when it comes to the war in Europe’s breadbasket.
Another bullish sign for wheat is the spread between the KCBT hard and CBOT soft red winter wheat contracts. U.S. wheat consumers that manufacture bread tend to price using formulas tied to the KCBT wheat futures. Over the past decades, the average premium for KCBT over CBOT wheat has been in the 20-30 cents per bushel range. When the premium falls or becomes a discount, it indicates few supply concerns. When it rises, it signifies increased consumer hedging because of price and supply concerns. On March 10, the spreads indicate significant concerns:
- The May KCBT-CBOT spread ({KEK23}-{ZWK23}) was at an over $1.10 per bushel premium for the KCBT wheat futures.
- The new-crop September KCBT-CBOT spread ({KEU23}-{ZWU23}) was at an 85.0 cents per bushel premium for the KCBT wheat futures.
The while the market is optimistic above the new-crop corn and bean supplies, it remains very concerned about wheat production.
Expect lots of volatility over the coming months
In 2022, CBOT wheat prices rose to a new all-time high, while corn and bean futures reached the highest prices since 2012, the drought-ridden year when the coarse grain and oilseed rose to their all-time peaks.
Mother Nature is the most critical factor for the path of least resistance of the agricultural products over the coming months. However, rising inflation and the war in Ukraine continue to underpin prices as we head into the 2023 Northern Hemisphere planting season. Support for Ukraine has caused Russia to use commodities as economic weapons. As a leading fertilizer exporter, farmers face sky-high prices and scarce supplies in 2023. The highest inflation in decades and rising financing costs have made the per-bushel cost of production soar.
At the beginning of the 2023 crop year, soybean, corn, and wheat prices were considerably lower than the levels in March 2022. However, the same issues that caused prices to explode last year remain a clear and present danger in 2023. Expect lots of price variance in the grain and oilseed futures markets, and you will not be disappointed.
More Grain News from Barchart
- Wheat Markets Giving Bank Some Friday Gains Early on Monday
- Soybeans Lower Overnight as Bank Issues Percolate
- Corn Gives Back Friday Gains
- Commodities: Running the Option Play
On the date of publication, Andrew Hecht did not have (either directly or indirectly) positions in any of the securities mentioned in this article. All information and data in this article is solely for informational purposes. For more information please view the Barchart Disclosure Policy here.

/Renewable%20Energy%20by%20Yuri%20Hoya%20via%20Shutterstock.jpg)


/A%20close-up%20of%20a%20General%20Motors%20corporate%20sign%20by%20lindaparton%20via%20Adobe%20Stock.jpeg)