
- There is a great deal of financial turmoil at this time, a possible reason for much of the investor selling we've seen in the commodity complex since late February.
- This has put a number of markets in Rubber Band Dispositions, meaning a snap back to real fundamentals could occur at any time.
- Since my first rule is to not get crossways with the trend, given it is set my noncommercial activity, when we see these types of market situations a possible strategy is to look at options (both puts and calls).
When it comes to the Silicon Valley Bank fiasco all I hear is the line from John Lennon’s Nobody Told Me, “Well, everybody’s talking, and no one says a word…” For now, I’ll leave the mindless chatter to the masses and see what develops. Do I think it is economic Armageddon like some are calling for? No. Do I think there could be a connection between this latest financial crisis and the recent investor long-liquidation seen in nearly every market sector? Chaos Theory tells us the answer is most likely yes, and to that we can add one of the opening statements from John J. Murphy’s book Intermarket Technical Analysis, “… commodities, bonds, and stocks are closely linked…a thorough analysis of one should include consideration of the other two.”
As I was putting together my Weekly Analysis Sunday (technical analysis of 30 commodity markets), I kept seeing a familiar theme pop up in my Theoretical Positions. Time after time, intermediate-term weekly charts were not showing a clear reversal pattern while short-term daily charts were. Meanwhile, as the CFTC continues in its attempts to update Commitments of Traders reports (the latest released Friday were positions as of Tuesday, February 21), we can see by looking at trends there has been a good deal of selling coming from the noncommercial traders while the commercial side continues to provide support. This has created a number of Rubber Band Disposition[i] situations, with a question being how to play them.
Answer: Run the option play. I know this isn’t American football, but I like to throw that phrase into the conversation every once in a while. In reality, though, when we see a divergence between noncommercial and commercial opinions, and we apply Newsom’s Rule #1 (Don’t get crossways with the trend) and #3 (Use filters (e.g. volatility, seasonality) to limit risk), sometimes the best strategy is to use options. Let’s look at a few of the markets that stood out to me this past weekend.
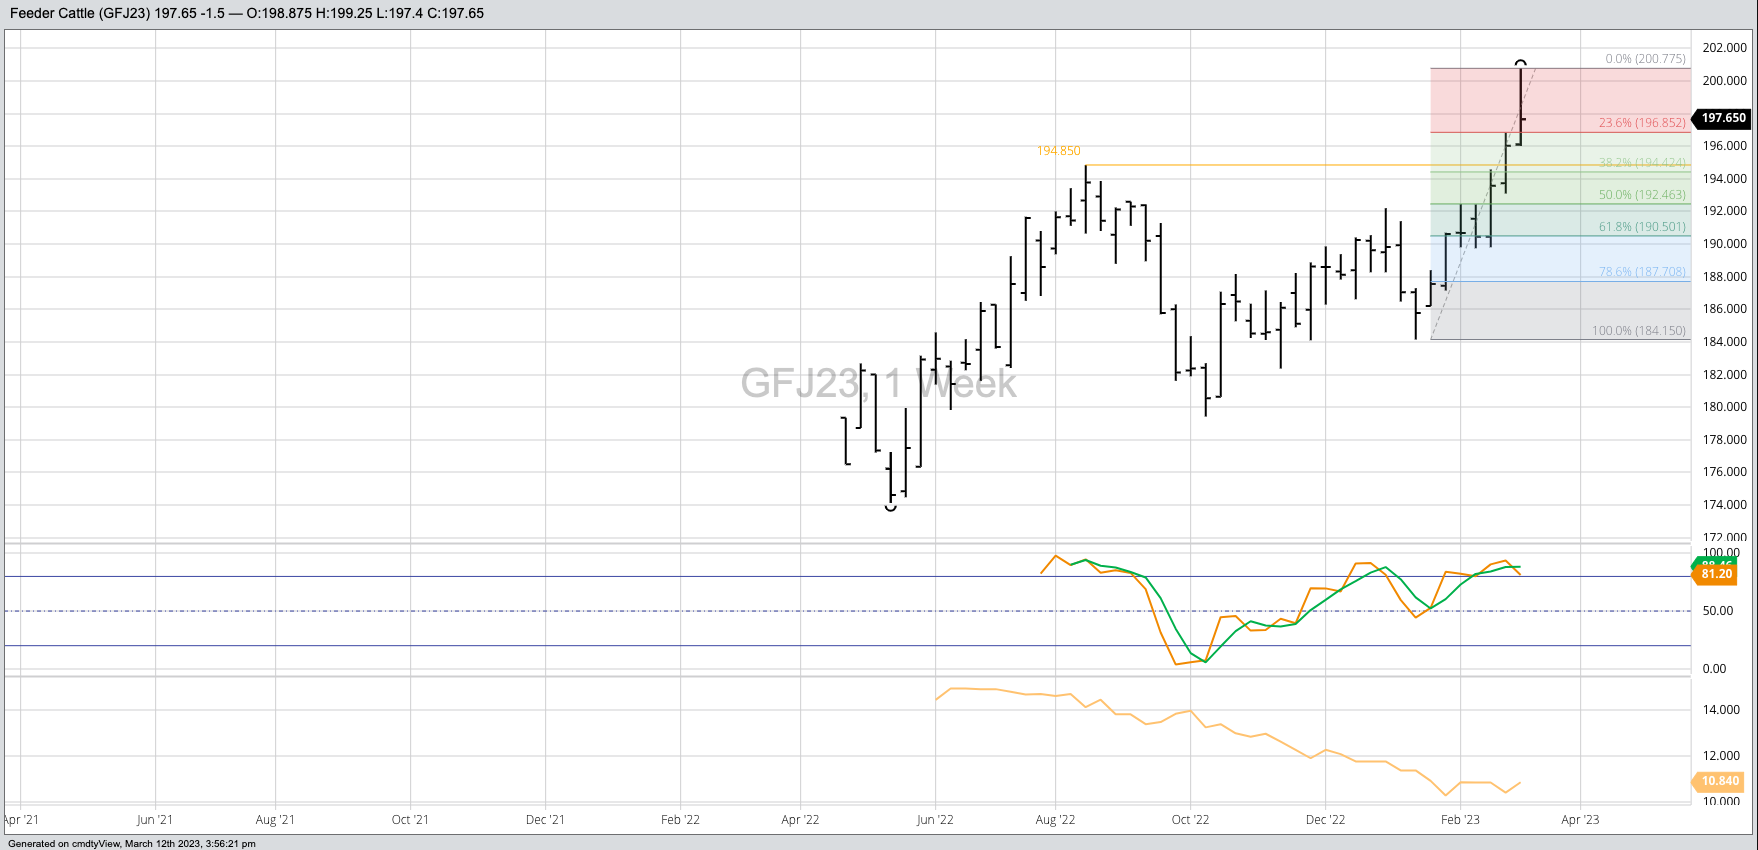
Feeder Cattle: For a number of weeks now I’ve been a proponent of buying put options, ranging from the January and March contracts out through at least the April and May. Why? The market has been on a near vertical run with the April issue posting a new contract high of $200.775 last Thursday. That same day, though, April feeders (GFJ23) completed a bearish spike reversal on its daily chart indicating its short-term trend had turned down. At the same time, no such reversal was seen on the intermediate-term weekly chart. The continued uptrend tells us noncommercial traders have been buying all while the April-May futures spread remains bearish. How do we know this? It closed last Friday at (-$5.925) as compared to the previous 5-year low weekly close for that same week of (-$5.25). Implied volatility was still relatively low at 11.2%, and the short-term technical target area was between $192.50 and $190.50. April feeders closed the week at $197.65.
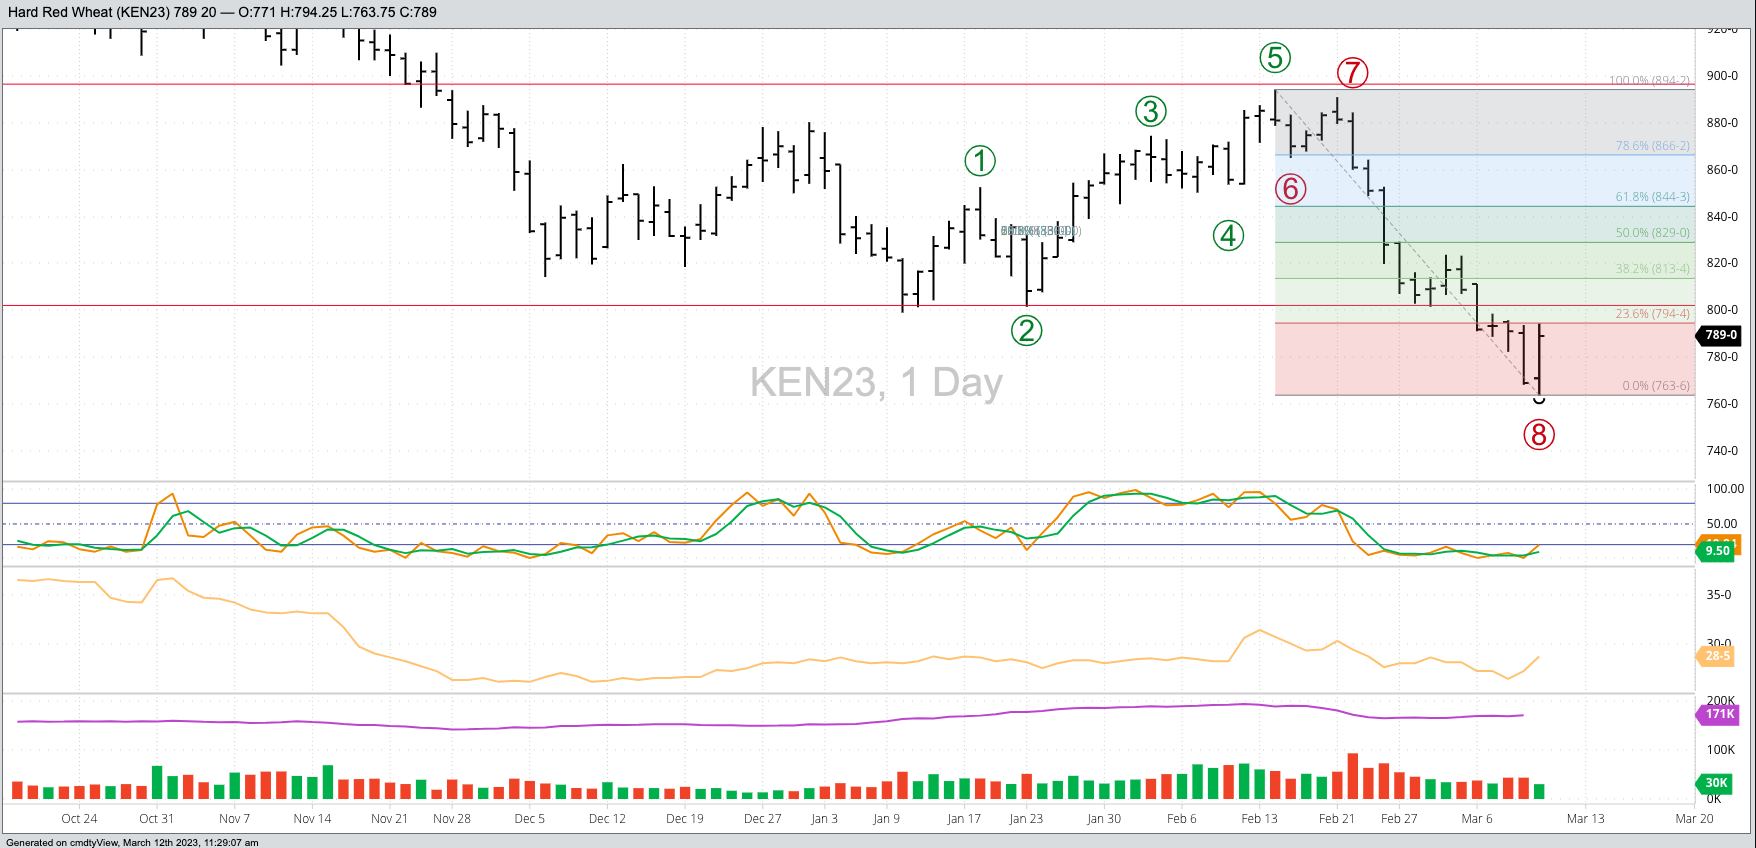
Kansas City Wheat (HRW): As I discussed in a recent piece, one could make the argument wheat is a buying opportunity for investors given long-term futures spreads remain bullish. The most recent CFTC Commitments of Traders report showed noncommercial traders holding a net-long futures position in Kansas City of 11,864 contracts, though given the May issue dropped $1.30 from February 21 through last Friday’s low we can make a safe assumption that futures position is much smaller. However, those traders have shown a willingness to buy, not surprising given the new-crop July-September spread finished the week at a carry of 1.5 cents and covering only 8% calculated full commercial carry (with 33% or less considered bullish). While July Kansas City wheat (KEN23) did not complete a bullish reversal pattern on its weekly chart, it posted an impressive bullish key reversal on its daily chart. The one knock is implied volatility jumped a bit Friday but could still be considered low.
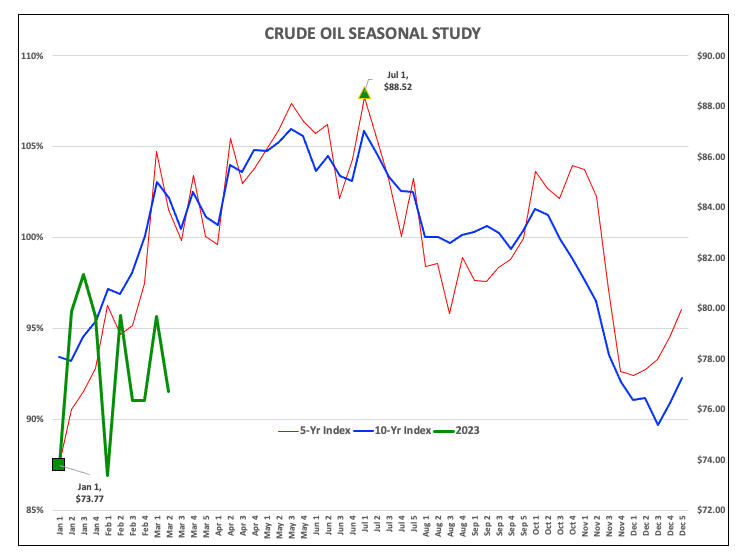
Crude Oil (either Brent or WTI): Here the situation is a bit different as crude oil continues to show a sideways trend on its continuous weekly charts. Usually, the option play in a sideways trending market is to sell options to take advantage of the range, but that is done when implied volatility is high. Looking at the August WTI crude oil contract (CLQ23), implied volatility is still low at a time when the seasonal tendency is for the market to rally through the first week of July. The triangle consolidation on August crude oil’s weekly chart has a range of $14.30. Heading into this week the upside breakout price is $81.25 while the bearish breakout price is $72.68. Given the market’s bullish seasonal tendencies, an upside breakout this week would put the target near $95.50. The market’s forward curve remains inverted beyond the June contract.
[i] A Rubber Band Disposition occurs when noncommercial activity diverges from a market’s real fundamentals. In this case, noncommercial traders have been selling while many markets continue to show inverted forward curves. The idea is a market will stretch, like a rubber band, until it breaks and snaps back to its base. And as we know from Newsom’s Market Rule #6: Fundamentals win in the end.
More Energy News from Barchart
- Energy and Gold Stocks Attracting Investor Attention as Financials Take Hit
- Gasoline- The NYMEX Futures Tend to Reflect Peak Season Demand in Early Spring
- Nat-Gas Tumbles on Warmer U.S. Temps and Robust U.S. Nat-Gas Inventories
- Crude Oil Closes Higher as the Dollar Falls
On the date of publication, Darin Newsom did not have (either directly or indirectly) positions in any of the securities mentioned in this article. All information and data in this article is solely for informational purposes. For more information please view the Barchart Disclosure Policy here.
/AI%20(artificial%20intelligence)/AI%20technology%20concept%20by%20NMStudio789%20via%20Shutterstock.jpg)


