
- The investment community has been bearish Chicago (SRW) wheat for almost a year, indicated by the large noncommercial net-short futures position reported by the CFTC.
- Fundamentally there is good reason for this bearishness given futures spreads and monthly available stocks-to-use calculations.
- But trends change, and the SRW market(s) could be nearing long-term turning points despite counted bearish fundamental reads.
I have a few reasons for posting this piece early today, other than procrastination as it should’ve gone up Tuesday. First, it is Wednesday, and what better time to talk about wheat than on a Wheat Wednesday. Second, today is a USDA data dump day, a minor one at that, and I want to use this piece to remind folks that decisions to invest should not be dependent on imaginary government numbers, regardless of market. Third, nearly every piece of news concerning US wheat is bearish these days, opening the door to a Poseidon Predicament[i].
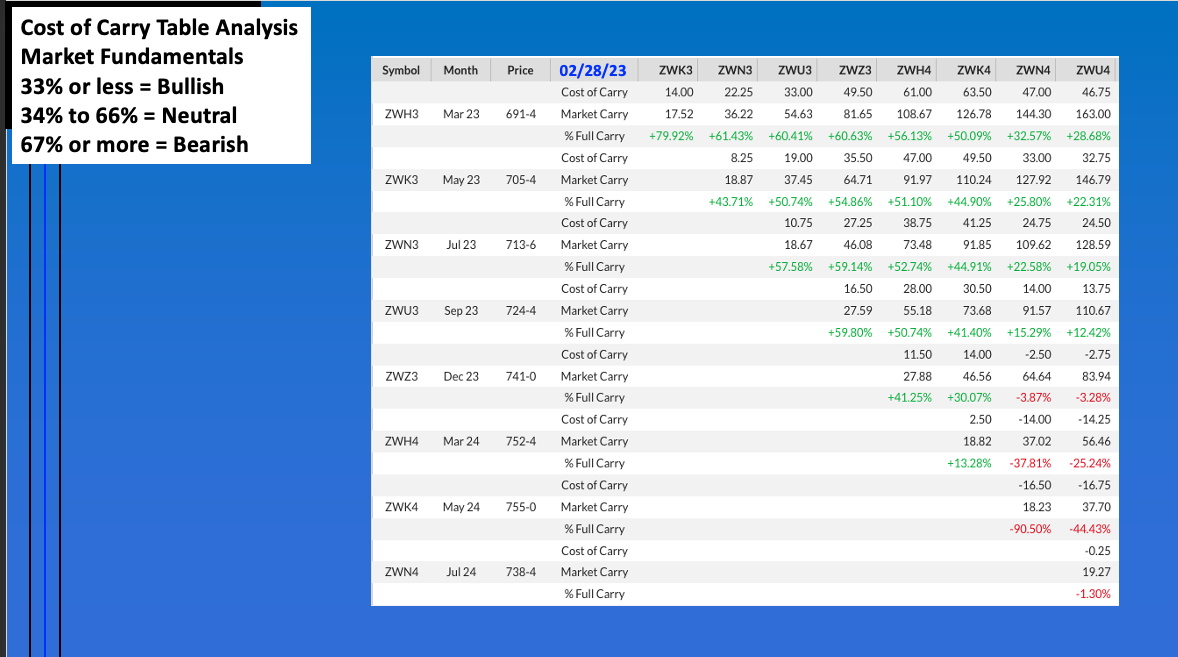
Given Newsom’s Market Rule #6[ii], let’s start with wheat’s real fundamentals. At the end of February, the Chicago (SRW) March-May futures spread was covering 80% calculated full commercial carry, with 67% or more considered bearish. Additionally, the SRW national average cash price at the end of the month $6.58, correlating to an available stocks-to-use figure (as/u) of 35%. The numbers at the end of January were $7.20 and 31.9%, while the previous February showed $8.93 and 25%. The last time SRW as/u were this large was at the end of August 2021. From a fundamental standpoint, then, SRW wheat is bearish giving investment traders (noncommercial interests, funds, algorithms, etc.) ample reason to continue selling.
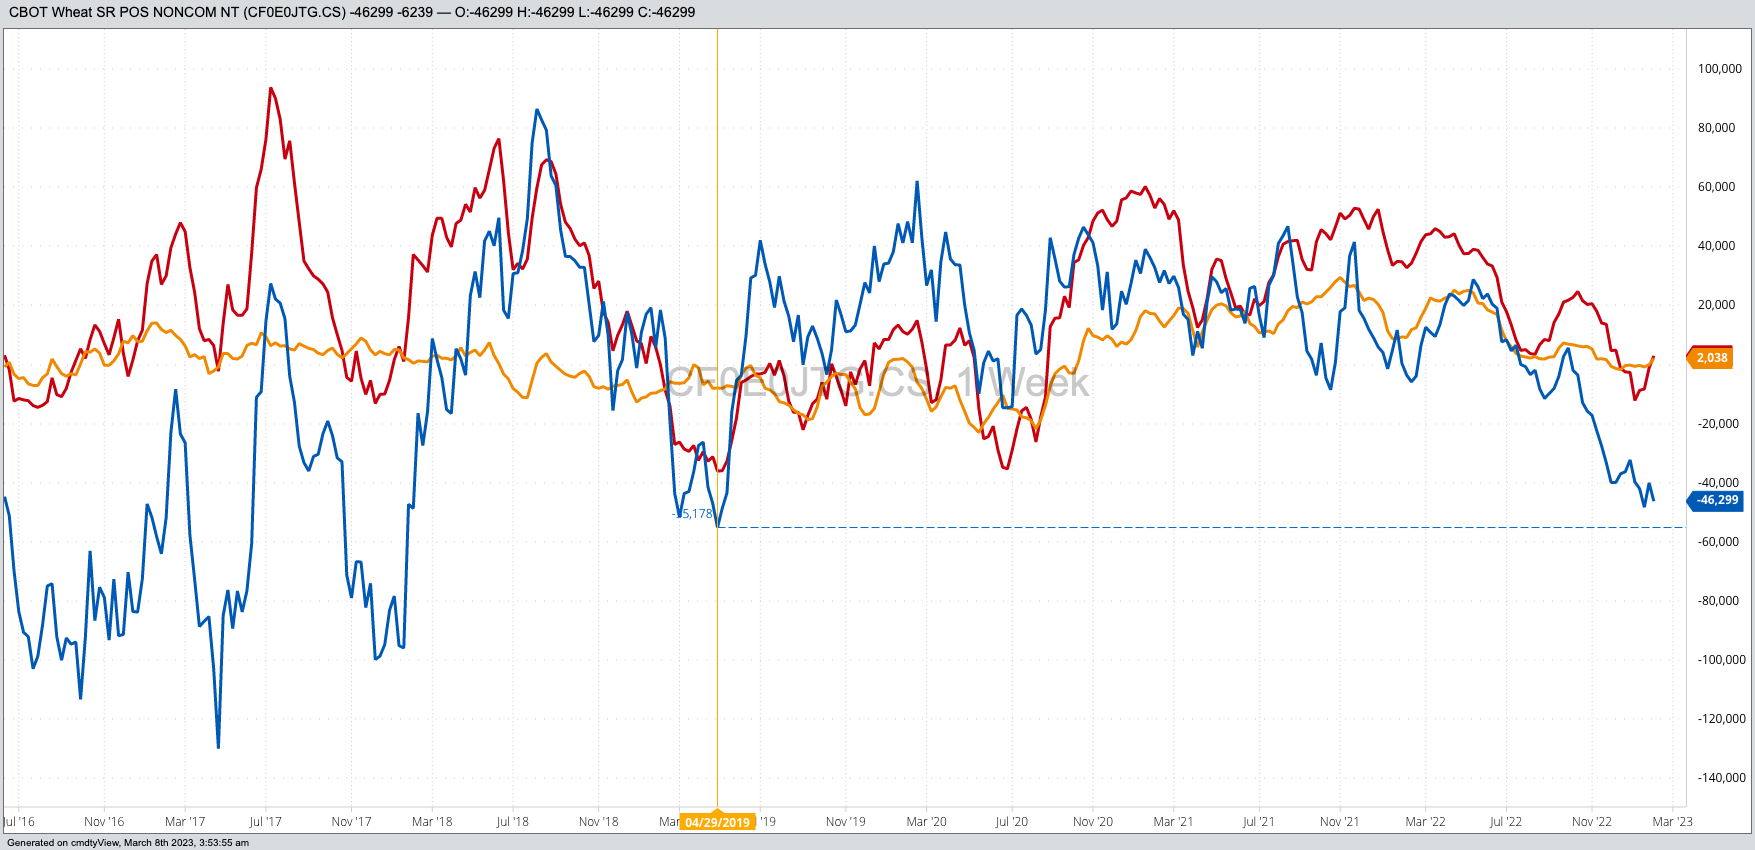
And sell this group has. The latest CFTC Commitments of Traders report, and recall I look at Legacy/Futures Only, showed noncommercial traders holding at net-short futures position in Chicago wheat of 46,299 contracts (solid blue line on chart) as of Tuesday, February 7[iii]. Since then, May Chicago has fallen just over 70 cents indicating continued selling from the noncommercial side. Does it matter if the net-short futures position has moved beyond the previous mark of 55,178 contracts from late April 2019? Not really. But based on the strong selloff seen over the past month we can assume that level has been taken out.
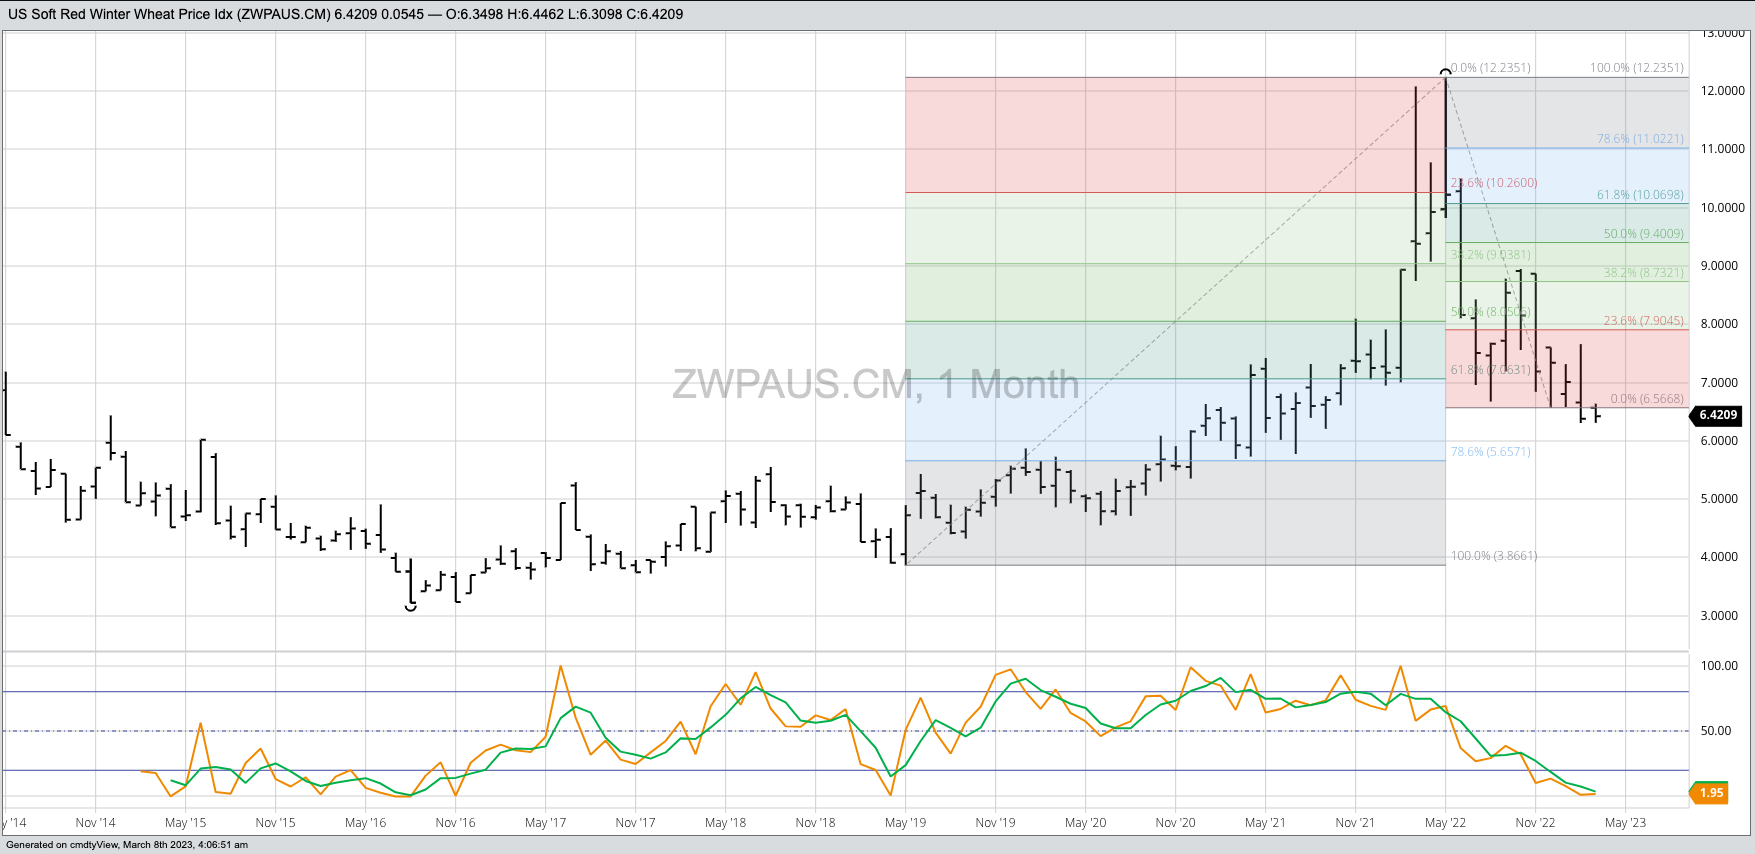
Which leads us to Newsom’s Market Rule #1[iv], and by association Newton’s First Law of Motion applied to markets: A trending market will stay in that trend until acted upon by an outside force, with that outside force usually noncommercial activity. As I’ve been talking about in my monthly newsletter for market investors, the Barchart National SRW Wheat Price Index (ZWPAUS.CM) has been in a major (long-term) 3-wave downtrend since posting a spike high during May 2022. However, the SWPI took out the Wave A (first wave) low of $6.6755 (August 2022) last December and extended the downtrend to $6.3052 during February. This has pulled monthly stochastics (long-term momentum indicator) into single digits, well below the oversold level of 20% and in position for a possible bullish crossover.
As a market investor, we have to remember that a crossover by stochastics is not itself confirmation of a buying (or selling) opportunity, but rather a signal the trend is set to change. Or in other words, the flow of noncommercial money into or out of the market should soon change. This confirmation usually comes in the form of a technical reversal pattern. If we trace the previous major uptrend of the SWPI back to its origin, we see a bullish key reversal[v] completed during May 2019.
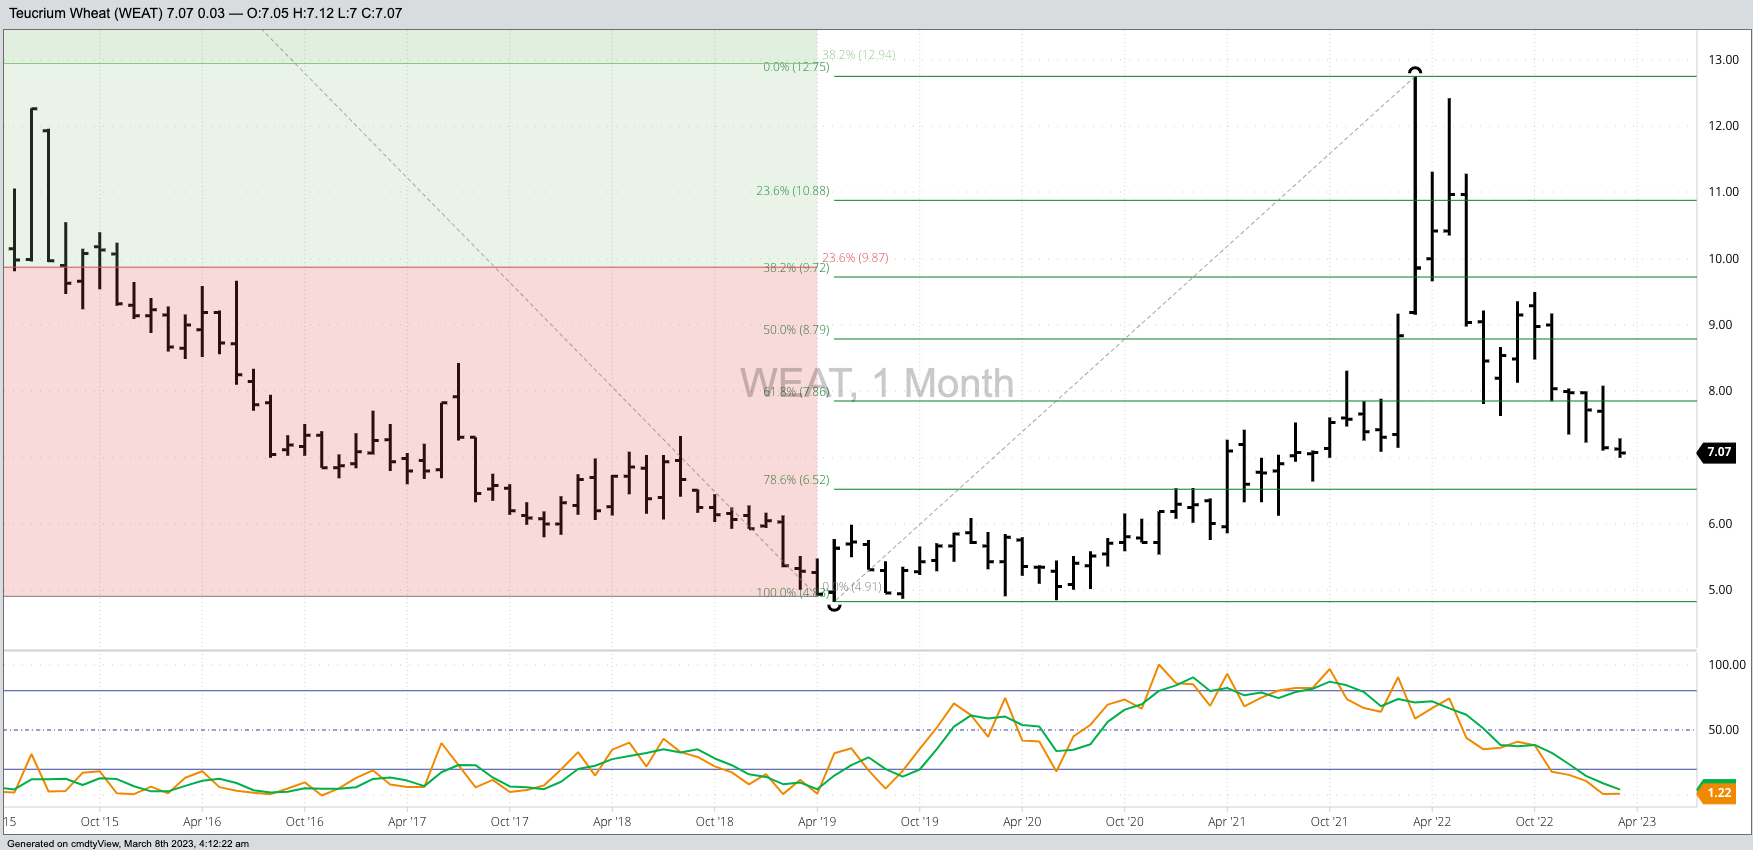
Many investors don’t want to trade cash wheat though, and understandably so. Another avenue is exchange-traded funds (ETFs), with one I track in my newsletter being Teucrium’s Wheat Fund (WEAT). Here we see a similar technical pattern to the SWPI, with the most recent difference being WEAT has posted a new low of $7.00 during March so far. Is the fund oversold? Yes. Has it given us a confirmation to buy? No, but it could by the end of the month if it is able to complete a bullish reversal pattern.
If and/or when that happens, investors will then have to ask themselves what is more important, real fundamentals or technical patterns? If the algorithm is based purely on technical theory (which few are these days), then the first premise of technical analysis[vi] could be applied: Market action discounts everything. If this is true, and we see a bullish technical reversal in WEAT (or wheat, cash and/or futures), then it is telling us the market has accounted for bearish fundamentals and is changing course anyway. But we aren’t there yet. Let’s see how the rest of the month plays out.
[i] A Poseidon Predicament means everyone has run to the same side of the boat, in market terms meaning bullish or bearish, making it easier for the boat (market) to capsize.
[ii] Newsom’s Market Rule #6 tells us: Fundamentals win in the end.
[iii] The CFTC is still trying to catch up on its position reporting following a cyber security issue among clearing firms this past January.
[iv] Newsom’s Market Rule #1 tells us: Don’t get crossways with the trend.
[v] A bullish key reversal is when the market sets a new low for the move before taking out the previous time period’s high and closing higher for the time period. This is one of the more reliable reversal patterns.
[vi] From Technical Analysis of the Futures Markets by John J. Murphy, 1986 edition, page 2.
More Grain News from Barchart
- Double Digit Losses for Spring Wheat
- Turn Around Tuesday for Soybean Futures
- Corn Closes Red
- Barchart Raises Brazil's Production Estimates for Soybeans, While Forecasts for Argentina Remain Unchanged
On the date of publication, Darin Newsom did not have (either directly or indirectly) positions in any of the securities mentioned in this article. All information and data in this article is solely for informational purposes. For more information please view the Barchart Disclosure Policy here.
/A%20close-up%20of%20a%20SpaceX%20sign%20by%20Sundry%20Photography%20via%20Adobe%20Stock.jpeg)

/A%20close-up%20of%20the%20SpaceX%20sign%20on%20a%20black%20building%20by%20IanDewarPhotography%20via%20Adobe%20Stock.jpeg)

/NVIDIA%20Corp%20video%20chip-by%20Antonio%20Bordunovi%20via%20iStock.jpg)