Your browser of choice has not been tested for use with Barchart.com. If you have issues, please download one of the browsers listed here.
Stocks | Futures | Watchlist | News | More
or
Faster, Cleaner, Better.

Soybean Meal Micro Aug '25 (SMQ25)

[[ item.lastPrice ]] [[ item.priceChange ]] ([[ item.percentChange ]]) [[ item.tradeTime ]] [CBOT]
[[ item.bidPrice ]] x [[ item.bidSize ]] [[ item.askPrice ]] x [[ item.askSize ]]
[[ rootItem.symbol ]]underlying price [[ rootItem.lastPrice ]] [[ rootItem.priceChange ]] ([[ rootItem.percentChange ]]) [[ rootItem.tradeTime ]]
News & Headlines for [[ item.sessionDateDisplayLong ]]
Livestock & Fibonacci

Educational and Actionable information using Fibonacci and W.D. Gann analysis.

HEM26 : 104.475s (-0.67%)
LEM26 : 246.325s (+0.81%)
GFK26 : 370.625s (+0.71%)
Why Trade Selection Matters More Than Trade Management in Spread Trading

Is trade management overrated? A deeper look at spread trading suggests selection matters far more than most traders think.

What's the Skinny on Orange Juice?

Jim delves into OJ (Weatherwise & Marketwise & Healthwise & Otherwise)

OJU26 : 199.90s (-0.10%)
OJK26 : 199.40s (-0.25%)
OJN26 : 199.50s (-0.15%)
OJF27 : 202.60s (-0.10%)
OJX26 : 201.40s (-0.10%)
Soybeans Ease Lower on Thursday

Soybeans saw losses of 1 to 5 ¼ cents in most contracts on Thursday, as May saw a 4 ¼ cent gain this week. The cmdtyView national average Cash Bean price was down 5 1/2 cents at $10.94. Soymeal futures...

ZSPAUS.CM : 10.9405 (unch)
ZLK26 : 68.94s (+2.73%)
ZMK26 : 315.2s (-0.94%)
ZSPX26US.CM : 10.8732 (unch)
ZSX26 : 1154-0s (-0.13%)
ZSK26 : 1163-4s (-0.43%)
ZSN26 : 1180-0s (-0.38%)
Wheat Close the Week with Slight Gains

The wheat complex held on for marginal gains to head into the long weekend. Chicago SRW futures saw fractional to 2 cent gains on the day, with May down 6 ¾ cents on the week. KC HRW futures were 2 to...

KEN26 : 631-0s (+0.44%)
KEK26 : 615-6s (+0.33%)
MWK26 : 6.4675s (+0.74%)
ZWK26 : 598-2s (+0.13%)
ZWN26 : 609-4s (+0.12%)
Corn Heads into the Long Weekend Mixed

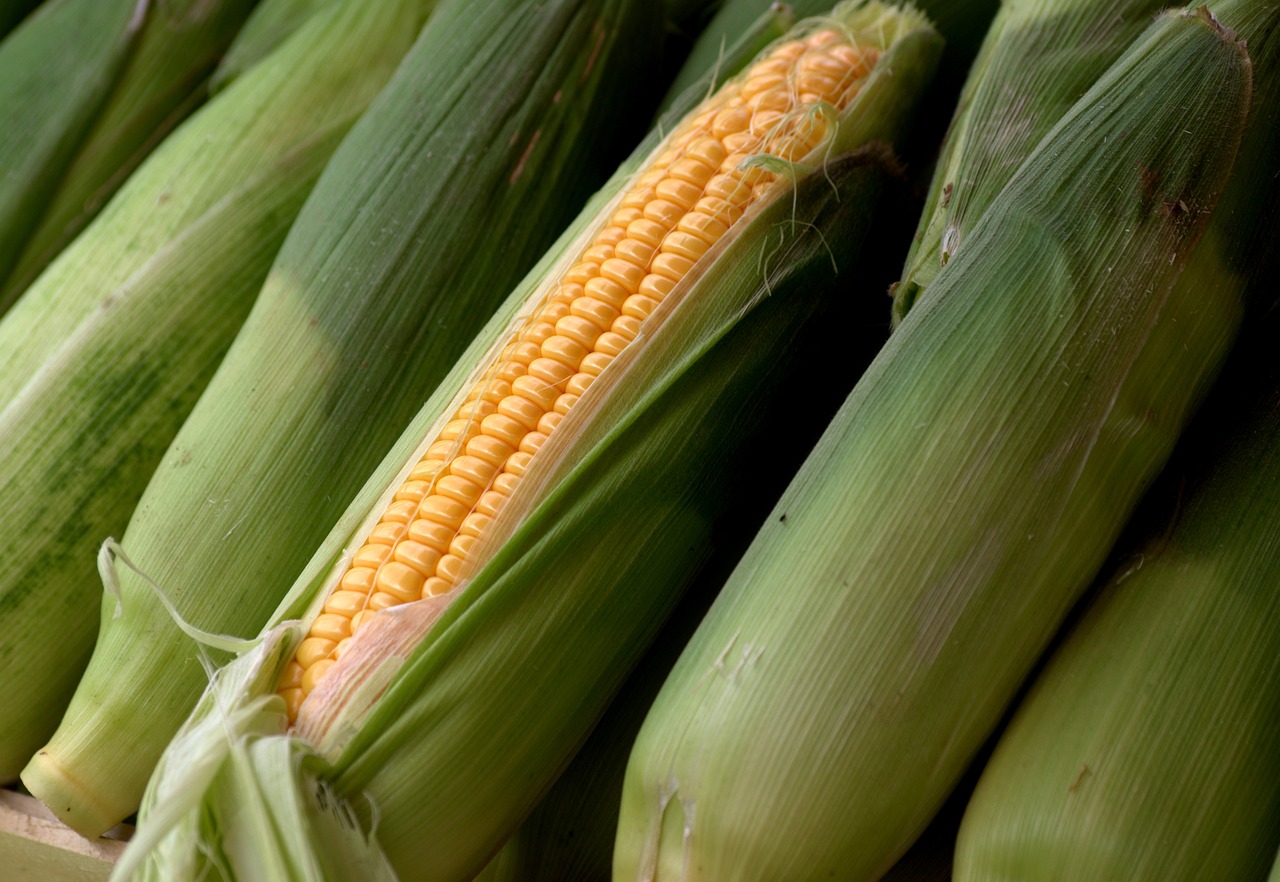
Corn futures headed into the long weekend, with some front month weakness as money was being taken off the table. Old crop contracts were fractionally to 2 cents lower, as new crop was steady to fractionally...

ZCZ26 : 481-2s (unch)
ZCN26 : 463-2s (-0.38%)
ZCK26 : 452-2s (-0.44%)
ZCPZ26US.CM : 4.4179 (unch)
ZCPAUS.CM : 4.1247 (unch)
Hormuz Shutdown: Where are the Grain, Cattle, and Oil Markets Headed?

The war in Iran is driving a historic surge in energy and grain prices while simultaneously threatening to break the cattle market due to rising input costs and shrinking consumer disposable income.

CLK26 : 111.54s (+11.41%)
LEJ26 : 246.200s (+0.88%)
Pure Hedge - Livestock and Grain

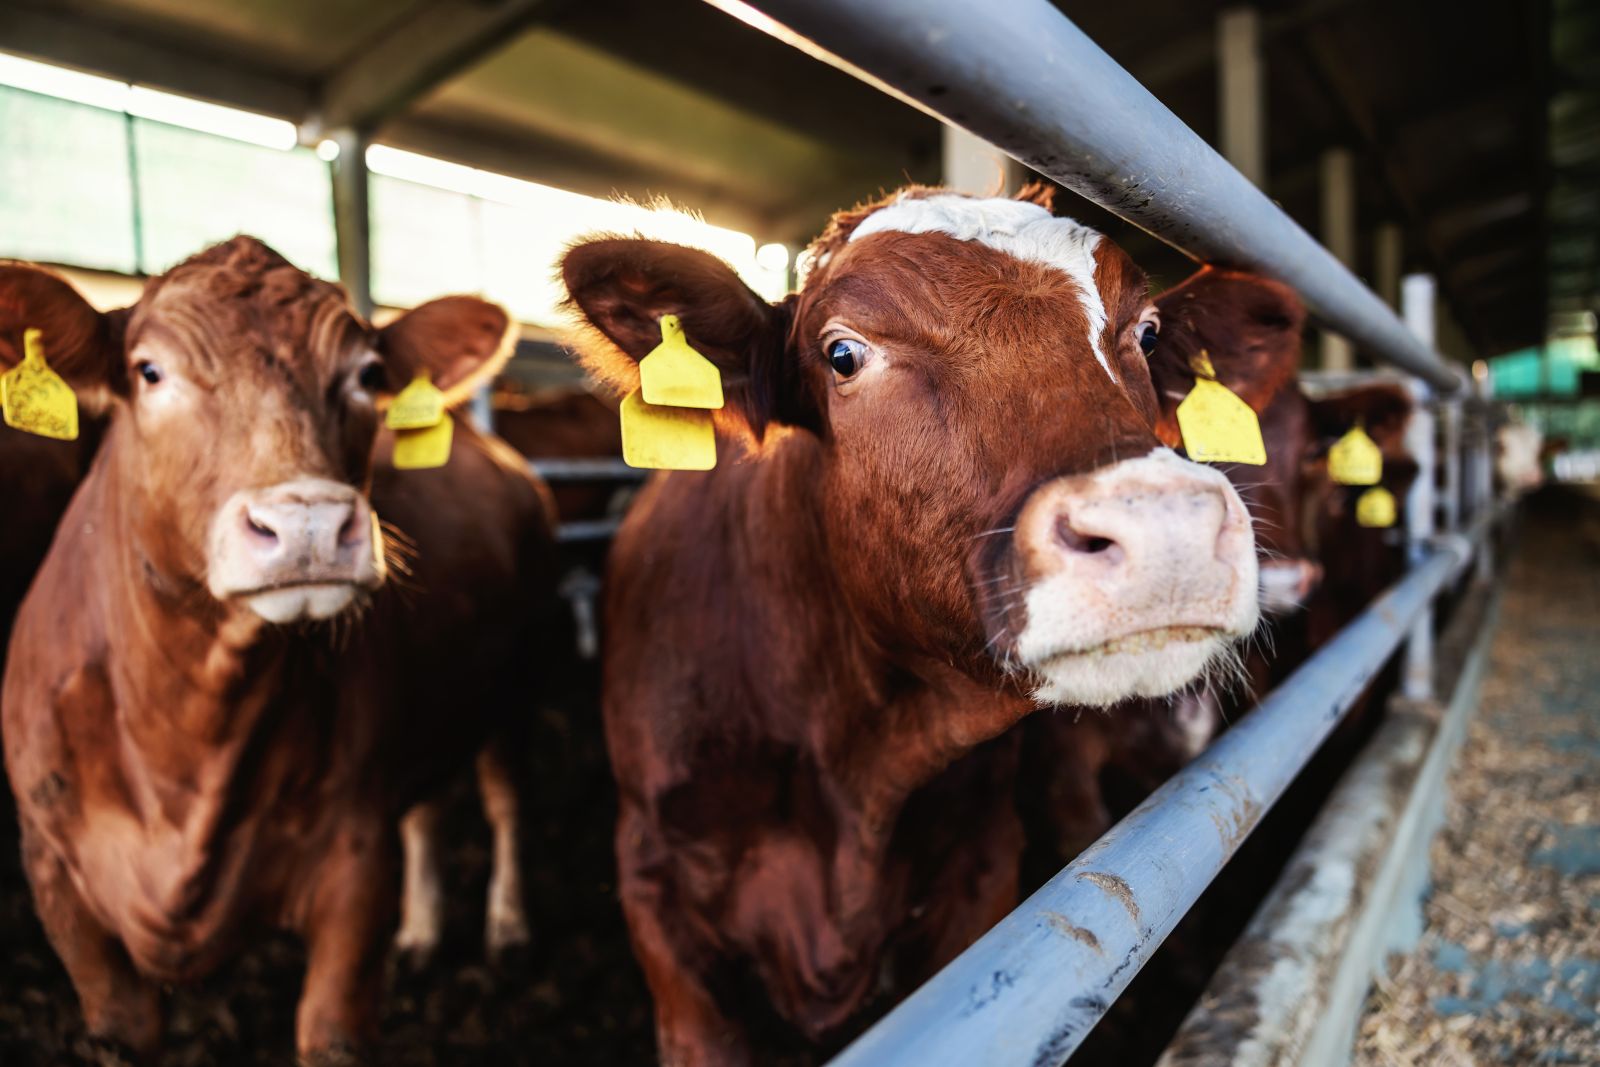
New Contract Highs in the Live Cattle Market - Grains Still Look Overpriced

Grain Spreads: 2nd Quarter Gameplan

Low Risk High Reward Strategies to Consider

Shootin' the Bull about the next most probable move.

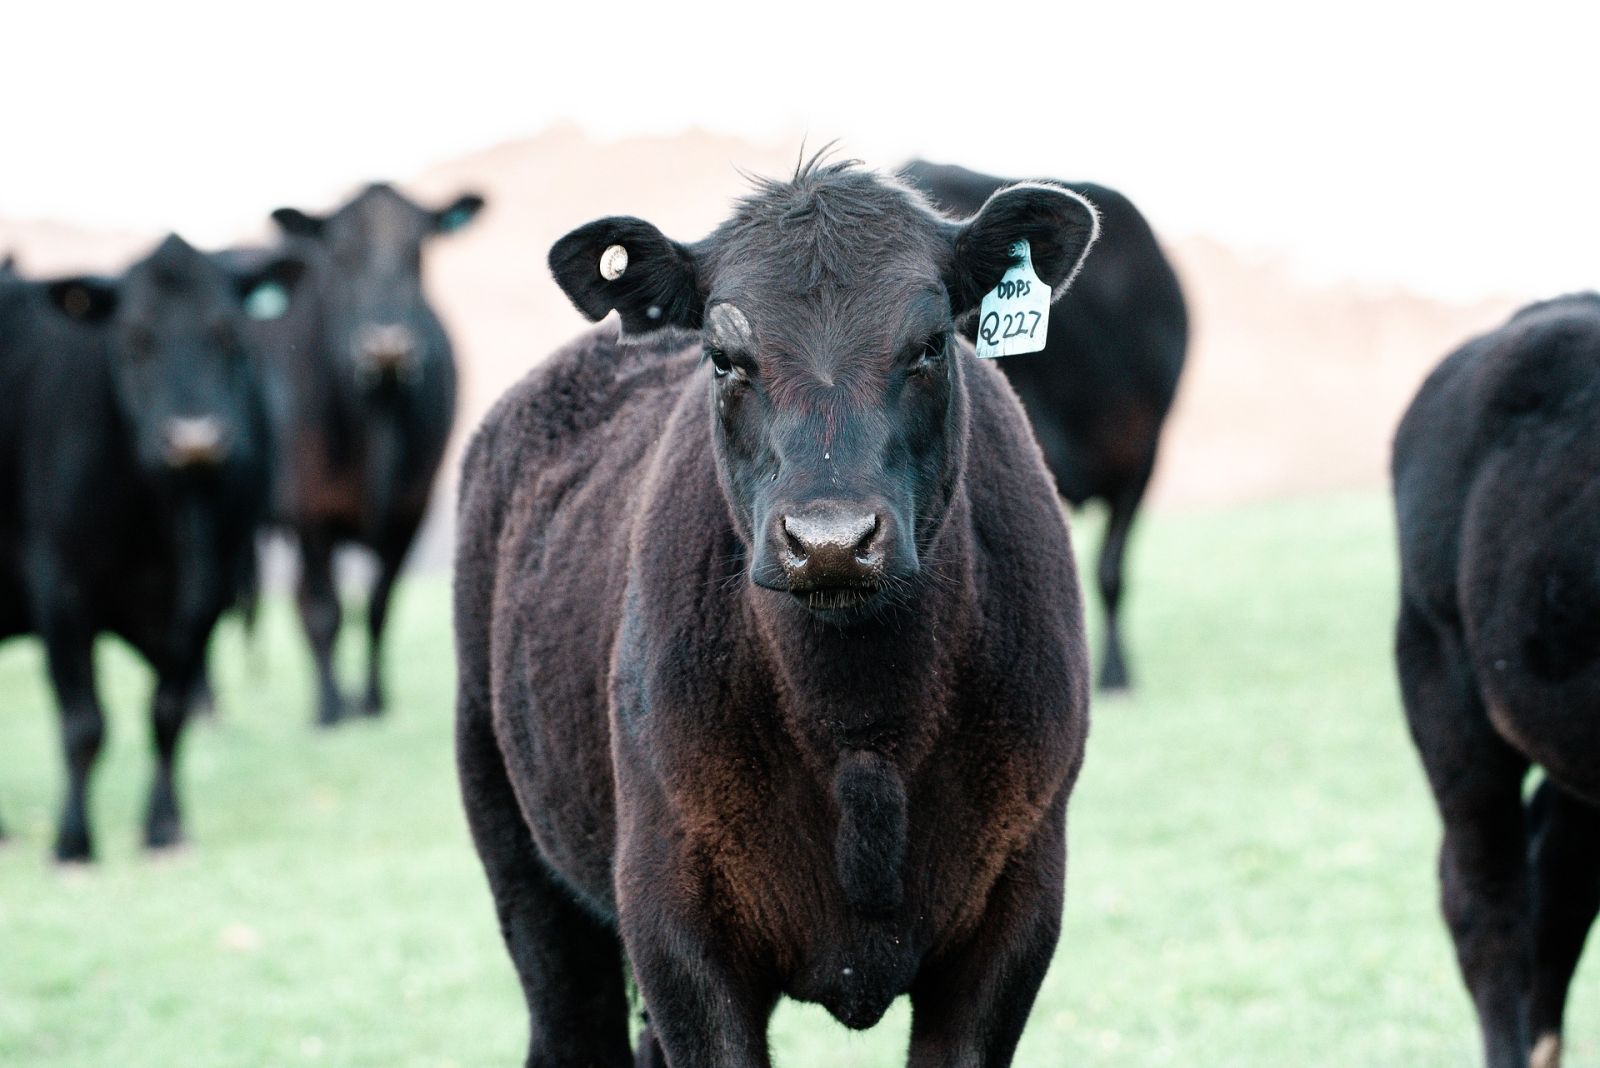
Price may move higher or may move lower, but the next most probable move in the industry is to cut production capacity.

Barchart Exclusives

Tesla Stock Keeps Falling - But 10% Lower TSLA Puts Yield 2.0% for One Month Out
Tesla stock has been falling over the past month. That has pushed up put option premiums. Meanwhile, analyst price targets are significantly higher. As a result, it makes sense to short out-of-the-money puts. Read more

Barchart Grains News

Soybeans Ease Lower on Thursday
Soybeans saw losses of 1 to 5 ¼ cents in most contracts on Thursday, as May saw a 4 ¼ cent gain this week. The cmdtyView national average Cash Bean price was down 5 1/2 cents at $10.94. Soymeal futures were down $3.00 to $4.20, as May was down 10... Read more
Want to use this as
your default charts setting?
Save this setup as a Chart Templates
Switch the Market flag
for targeted data from your country of choice.
Open the menu and switch the
Market flag for targeted data from your country of choice.
Want Streaming Chart Updates?
Switch your Site Preferences
to use Interactive Charts
Need More Chart Options?
Right-click on the chart to open the Interactive Chart menu.
Use your up/down arrows to move through the symbols.