Your browser of choice has not been tested for use with Barchart.com. If you have issues, please download one of the browsers listed here.
Stocks | Futures | Watchlist | News | More
or
Faster, Cleaner, Better.

Guernsey Light Sweet Crude Oil Index NE2 Futures Cash (JGWY00)

[[ item.lastPrice ]] [[ item.priceChange ]] ([[ item.percentChange ]]) [[ item.tradeTime ]] [NYMEX]
[[ item.bidPrice ]] x [[ item.bidSize ]] [[ item.askPrice ]] x [[ item.askSize ]]
[[ rootItem.symbol ]]underlying price [[ rootItem.lastPrice ]] [[ rootItem.priceChange ]] ([[ rootItem.percentChange ]]) [[ rootItem.tradeTime ]]
Quote Overview for [[ item.sessionDateDisplayLong ]]
[[ rowChartData.labelLow ]]
[[ rowChartData.lowPriceFormatted ]]
[[ rowChartData.lowPrice ]]
[[ rowChartData.labelHigh ]]
[[ rowChartData.highPriceFormatted ]]
[[ rowChartData.highPrice ]]
since [[ rowChartData.lowDate ]]
since [[ rowChartData.highDate ]]
[[ value ]] [[ value ]]
Get Realtime - Quotes and Charts for Futures Traders. Learn More >>

More Guernsey Light Sweet Crude Oil Index (NE2) Futures Quotes

All Futures Prices
Please wait...

Most Recent Stories

More News
Why Seasonal Futures Spreads Work: The Hidden Rhythms Inside Commodity Markets

This article explains why seasonal patterns persist in commodity markets and how futures spreads are designed to capture those recurring tendencies.

The 4-Week Ladder: A Smarter Way to Create Steady Option Income

Instead of concentrating option trades in one expiration, a 4-week ladder staggers positions across multiple cycles to smooth results and simplify decision-making.

1 Under-$10 Stock Set to Surge as Much as 963% in 2026

The high price estimate for Arcturus suggests the stock can rally as high as 963%. Is it a far-fetched target?

$SPX : 6,966.28 (+0.65%)
ARCT : 6.78 (+0.15%)
Dry January with abundant geopolitical heat

USDA Reports at 11 AM on Monday

The Saturday Spread: Reading the Market’s Signals to Jump Ahead of the Crowd (HPE, SNOW, CRWD)

Successful trading involves anticipating what might happen next just as much as reacting to evolving undercurrents.

CRWD : 470.61 (+1.45%)
SNOW : 219.09 (-2.10%)
HPE : 22.17 (+0.68%)
Cotton Closes Friday with Slight Weakness

Cotton futures rounded out the Friday session with contracts steady to 5 points lower, as March was 40 points higher this week. Crude oil futures were back up $1.02 per barrel at $58.78. The US dollar...

CTK26 : 65.91s (-0.03%)
CTH26 : 64.41s (-0.08%)
CTZ24 : 71.40s (-1.37%)
Cattle Fall Lower on Friday

Live cattle futures slipped lower on Friday, with contracts down $1 to $1.55. February was down $2.27 this week. Cash trade was picked up at $232-233 across the country this week. The Friday morning Fed...

LEM26 : 229.750s (-0.66%)
LEJ26 : 234.675s (-0.66%)
LEG26 : 233.725s (-0.66%)
GFH26 : 354.700s (-0.85%)
GFF26 : 360.725s (-0.48%)
GFJ26 : 353.050s (-1.00%)
Soybeans Slips from Highs, Closes Friday with Marginal Gains

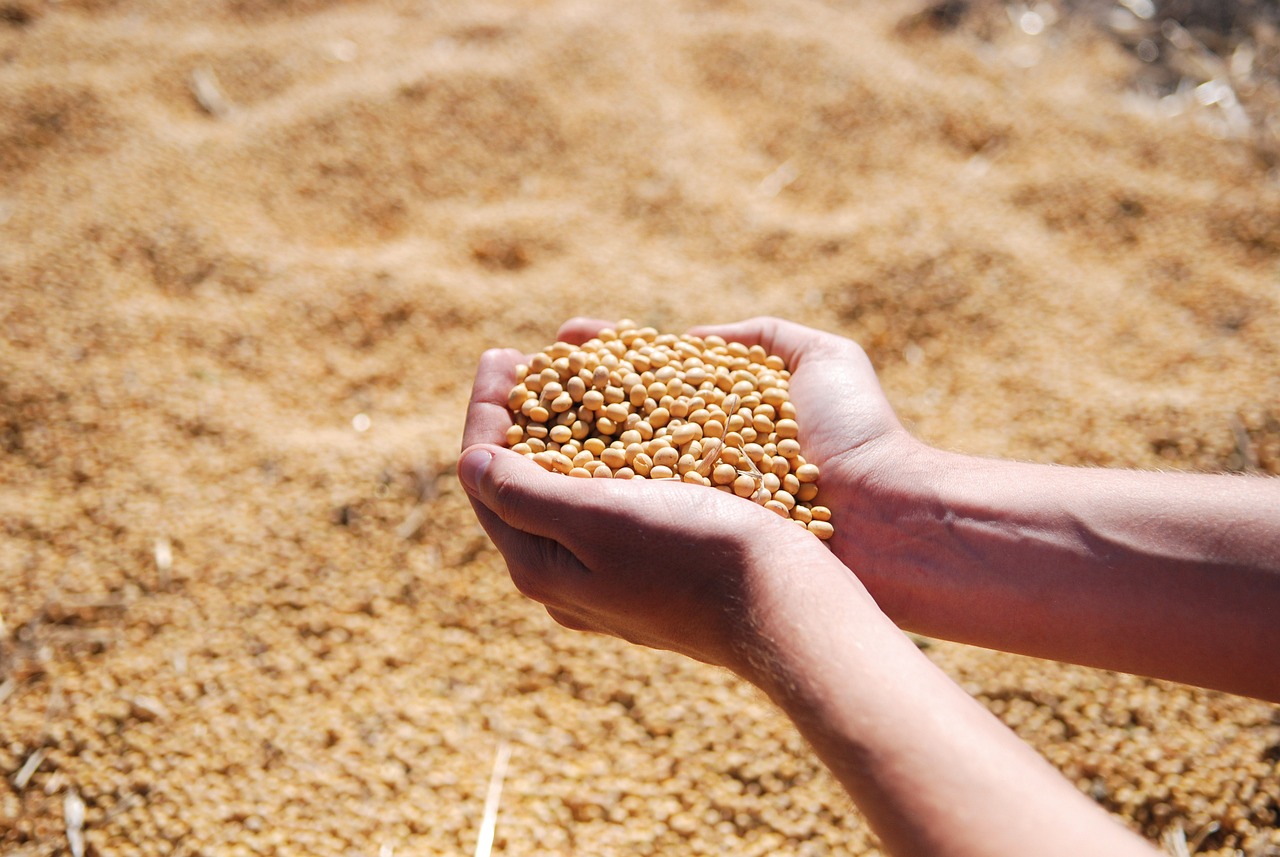
Soybeans slipped off the midday highs this week with contracts up 1 to 1 ½ ents in the front months at the close. March was up 16 3/4 cents on the week. The cmdtyView national average Cash Bean price...

ZSPAUS.CM : 9.8965 (+0.16%)
ZLH26 : 49.69s (+0.49%)
ZMH26 : 303.7s (+0.03%)
ZSX25 : 1112-6s (-1.70%)
ZSF26 : 1048-4s (+0.14%)
ZSH26 : 1062-4s (+0.12%)
Hogs Slip Lower on Friday

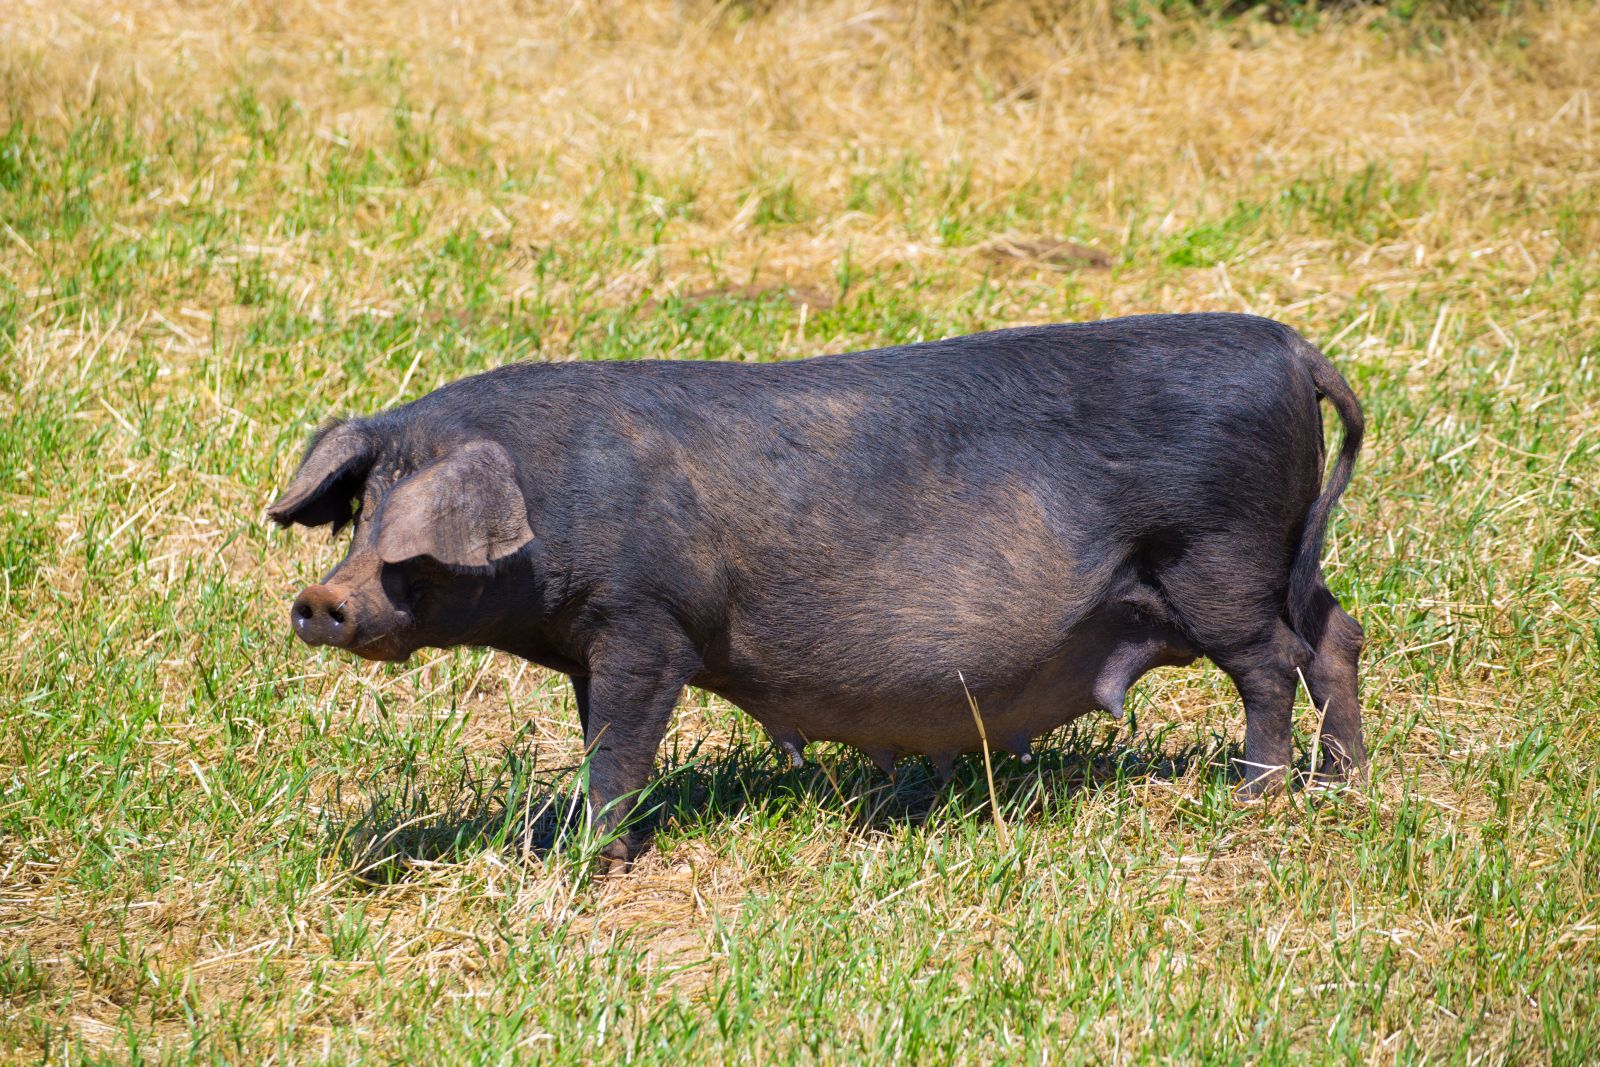
Lean hog futures were weaker on Friday, with contracts down a dime to 57 cents on the day, as February was $1.20 lower this week. USDA’s national base hog price was reported at $68.08 on Friday afternoon,...

HEJ26 : 91.775s (-0.16%)
HEG26 : 85.300s (-0.67%)
HEK26 : 95.850s (-0.10%)
Wheat Squares Up Ahead of USDA data to Close Friday

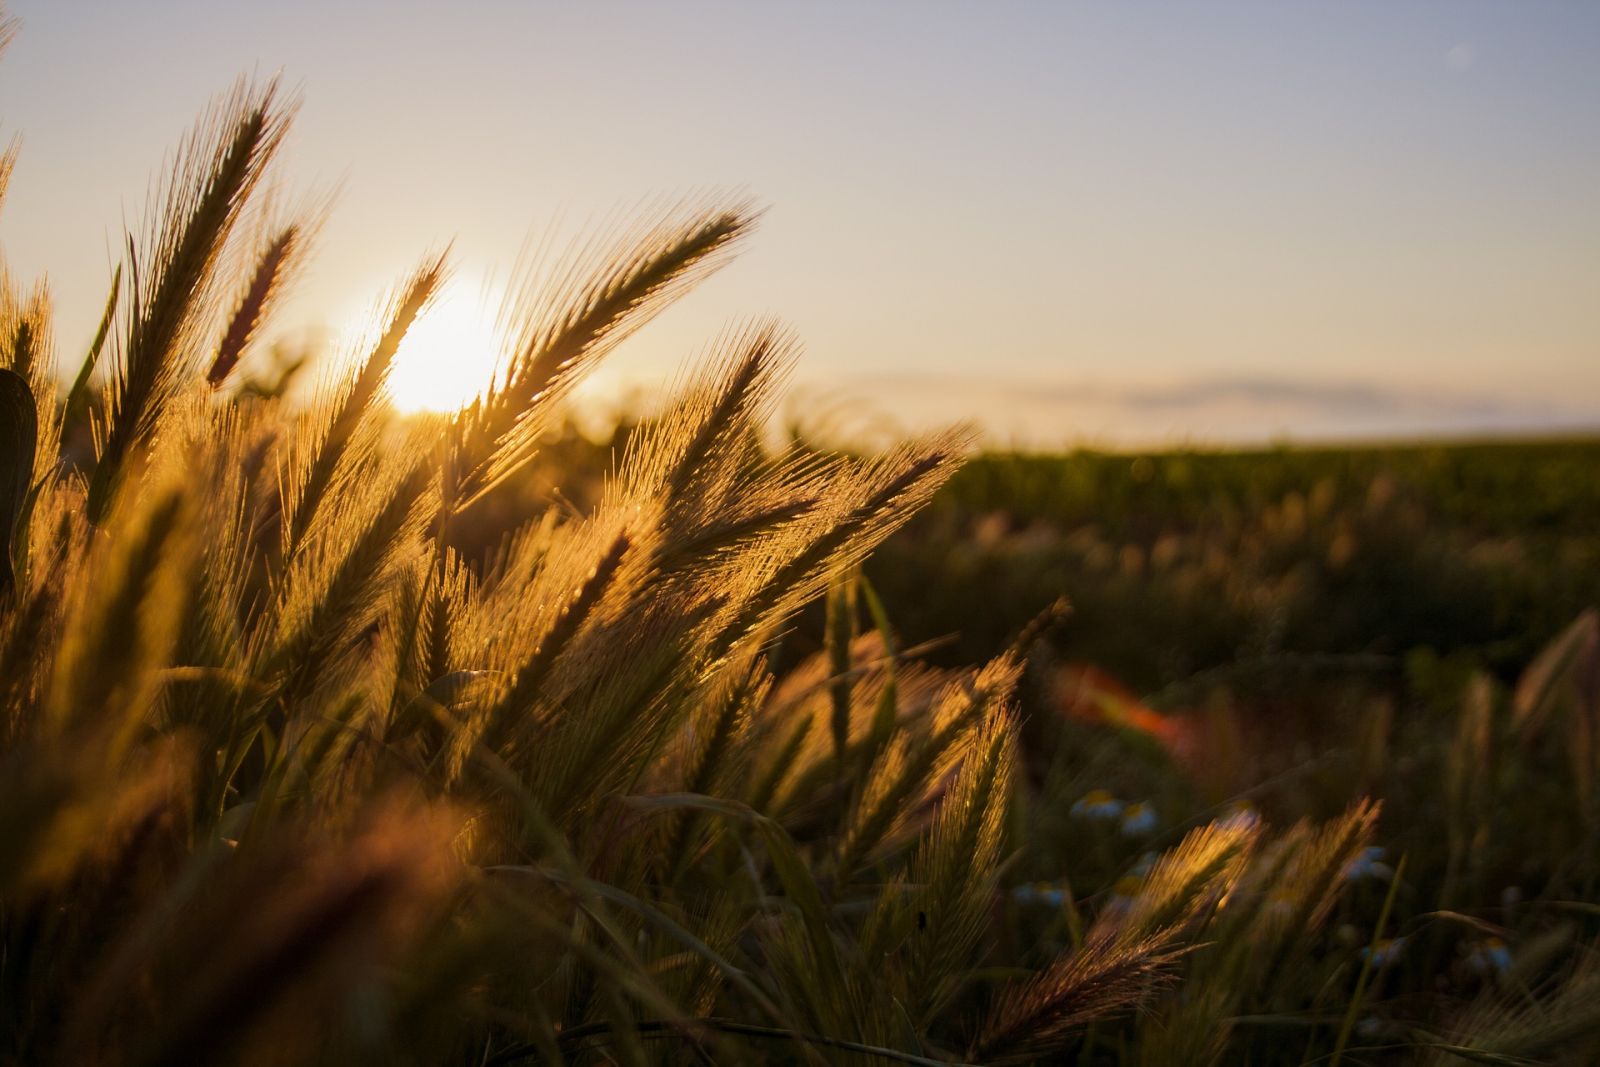
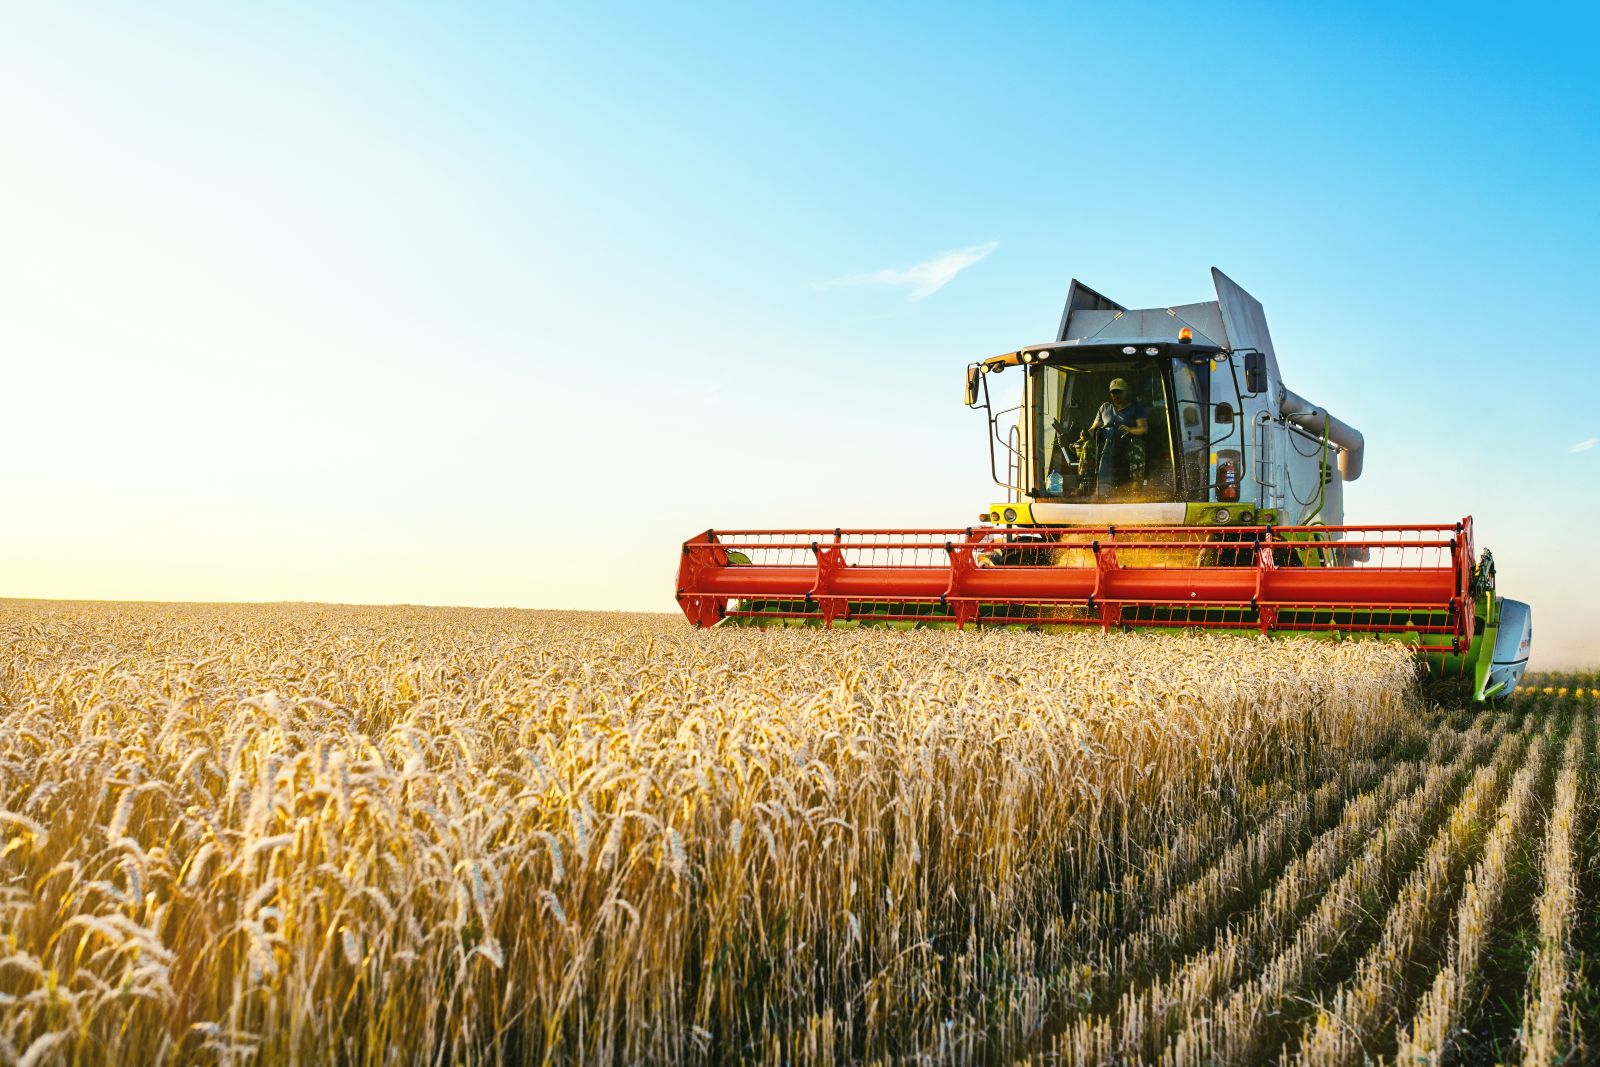
The wheat complex spent the Friday session squaring up ahead of the Monday USDA reports. Chicago SRW futures were fractionally lower, with March up 10 ¾ cents this week. KC HRW futures closed with steady...

KEK26 : 543-0s (unch)
KEH26 : 530-2s (unch)
MWH26 : 5.6750s (-0.66%)
ZWH26 : 517-2s (-0.14%)
ZWK26 : 528-6s (-0.05%)

Key Turning Points

3rd Resistance Point N/A
2nd Resistance Point N/A
1st Resistance Point N/A
Last Price N/A
1st Support Level N/A
2nd Support Level N/A
3rd Support Level N/A

See More

52-Week High 0.000
Fibonacci 61.8% N/A
Fibonacci 50% N/A
Fibonacci 38.2% N/A
52-Week Low 0.000

See More

Want to use this as
your default charts setting?
Save this setup as a Chart Templates
Switch the Market flag
for targeted data from your country of choice.
Open the menu and switch the
Market flag for targeted data from your country of choice.
Want Streaming Chart Updates?
Switch your Site Preferences
to use Interactive Charts
Need More Chart Options?
Right-click on the chart to open the Interactive Chart menu.
Use your up/down arrows to move through the symbols.
Free Barchart Webinar