
Here’s my summary of market sentiment right now. If investors owned as much of their wealth in commodity exchange-traded funds (ETFs) as they do in S&P 500 Index ($SPX) ETFs, what’s been happening since late last year would be dominating the news and dinner table conversations.
One glance at performance over two distinct time frames — one month and six months — tells the story. There’s lots of variability. And very recently, perhaps the beginning of the end for the highest flyers in the commodity space.
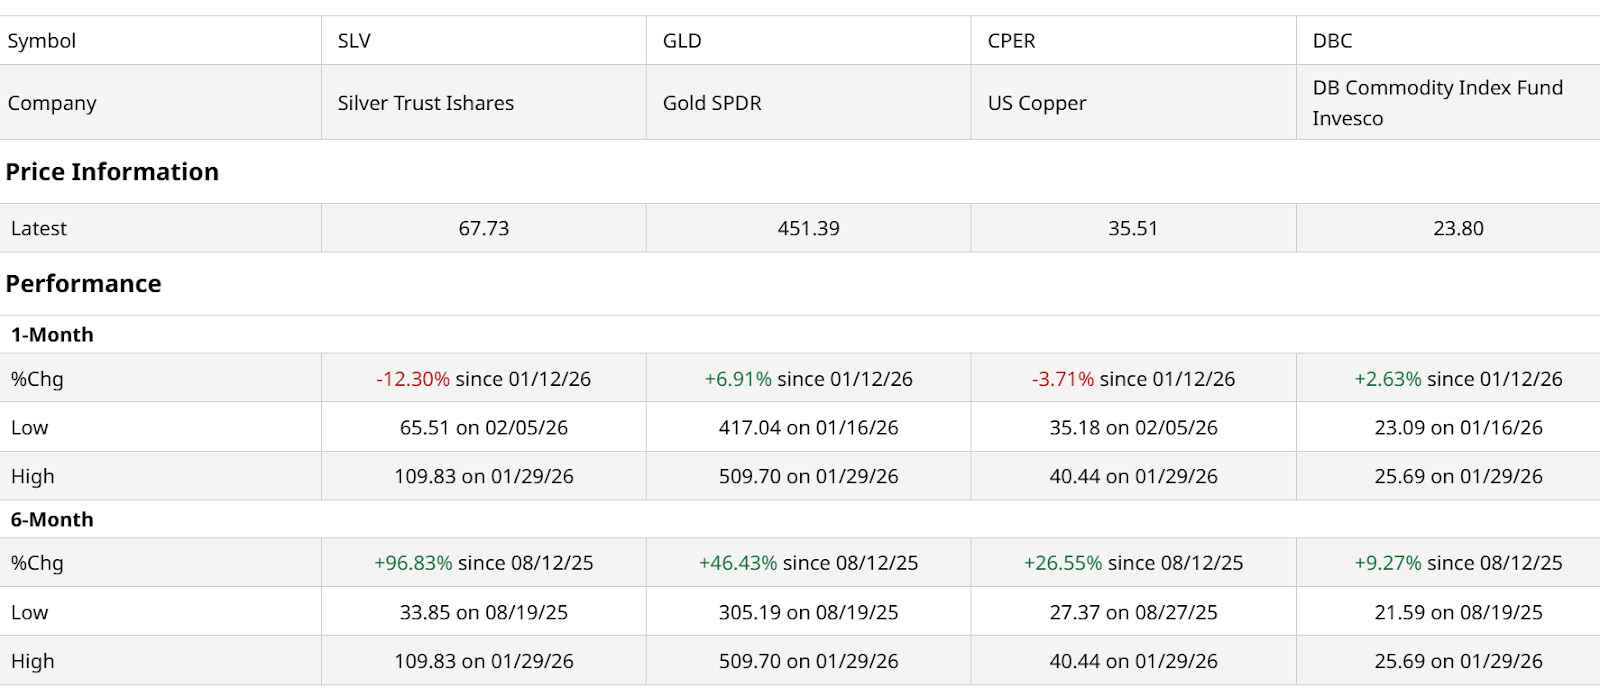
This part of the market has entered a period of intense fragmentation following a historic rally at the start of the year. While broad indices like the Invesco DB Commodity Index Tracking Fund (DBC) remain significantly above their 52-week lows, recent sessions have seen a violent unwinding of several formerly high-flying sectors.
This split in performance highlights a market that is no longer moving as a single unit but is instead being pulled apart by specific supply dynamics and shifts in buyer sentiment.
Here’s a daily view of DBC. It has hit a roadblock.
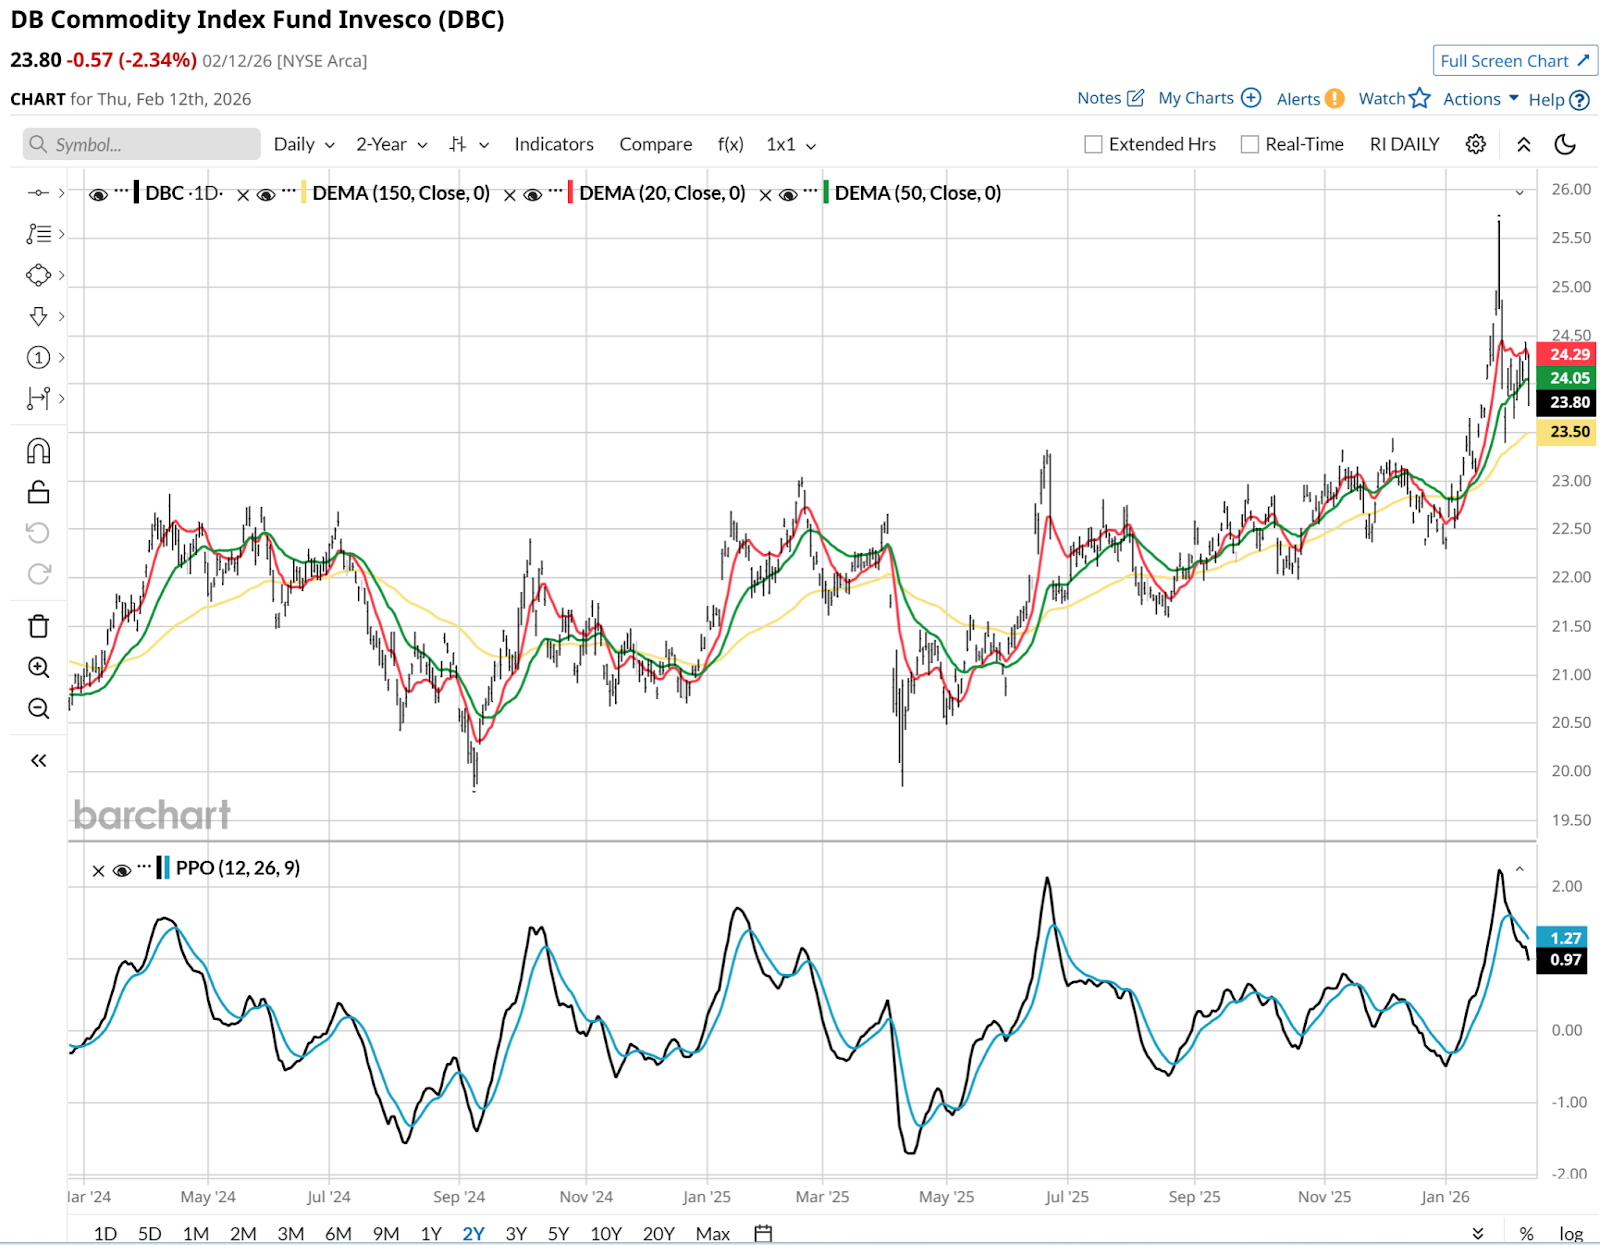
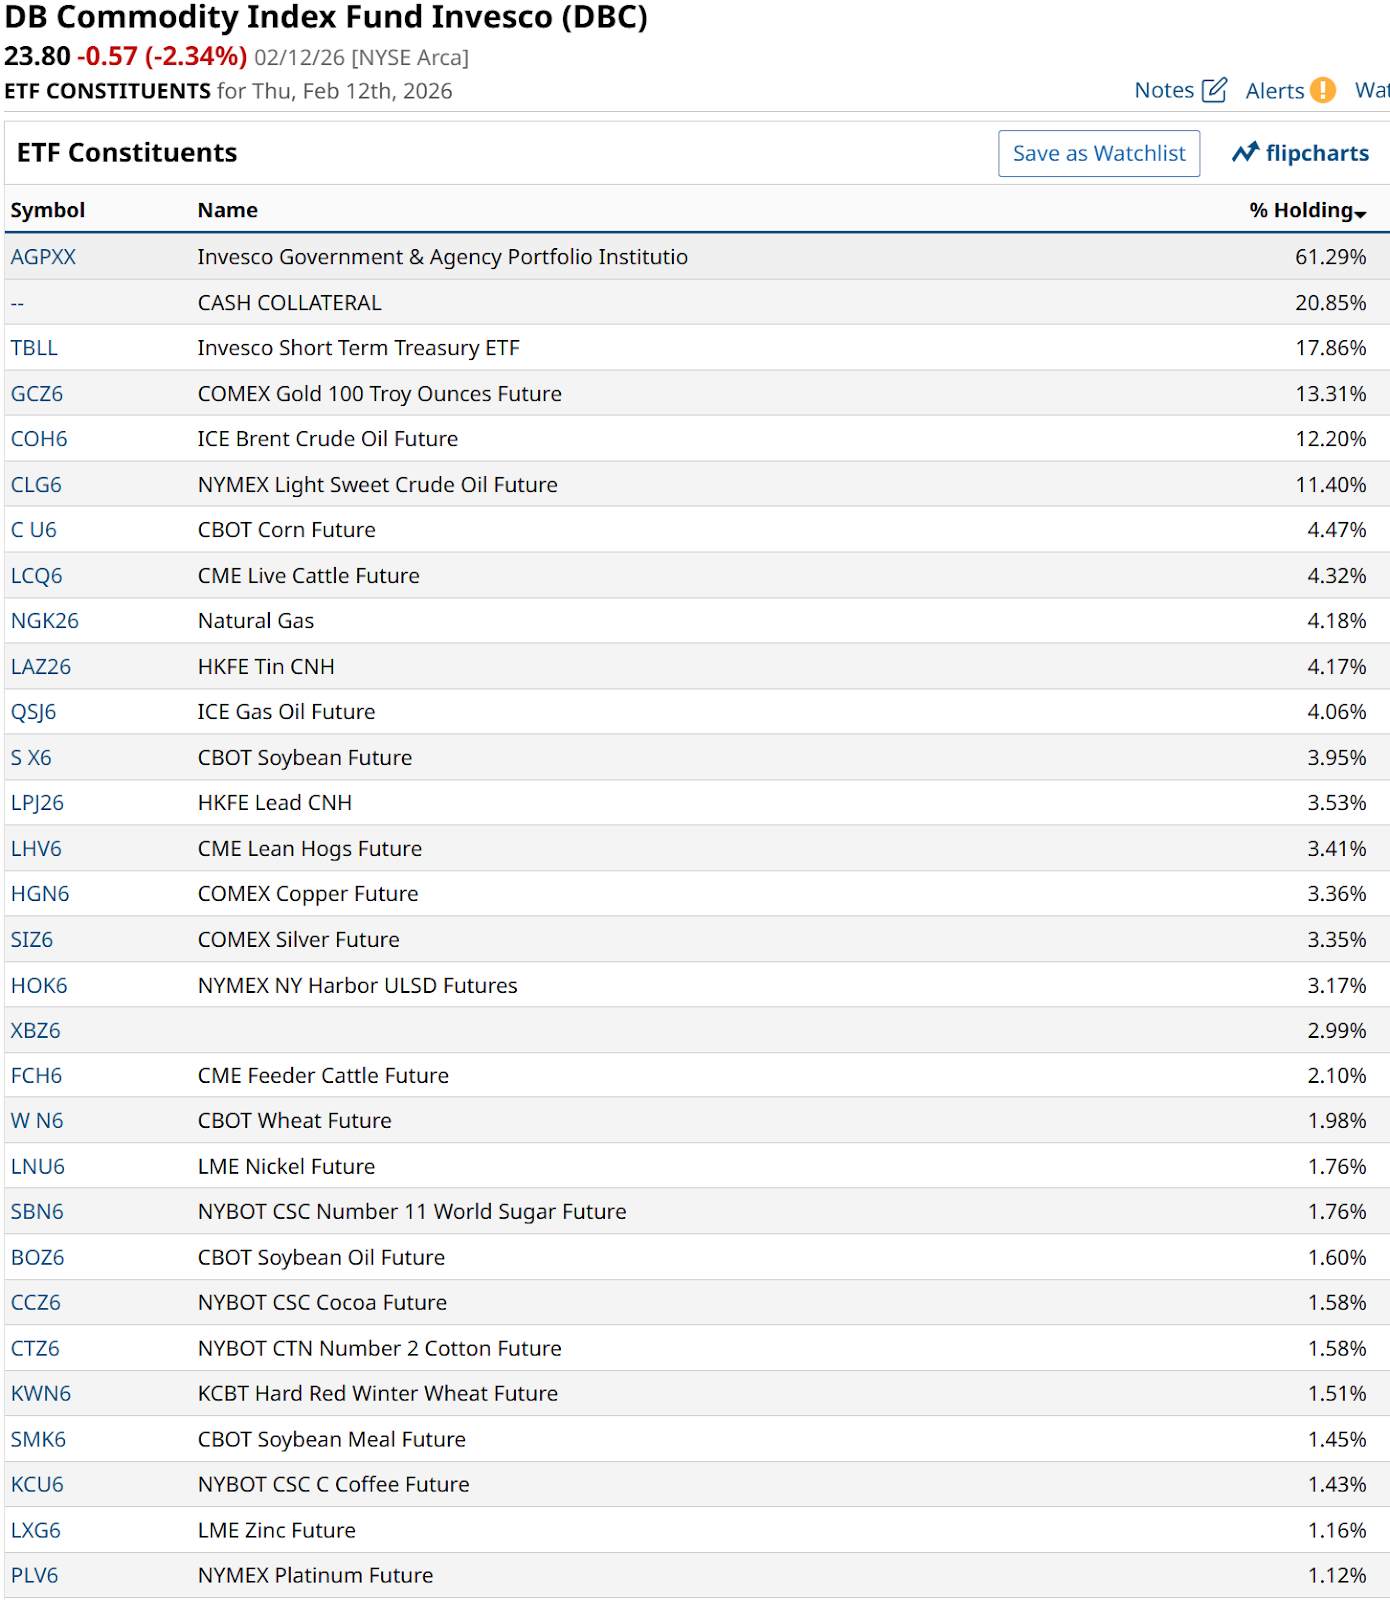
And when we examine the list of holdings for this ETF, we can see why. Gold, silver, copper, and oil have all had strong runs, sometimes in sync and other times not. But now, they are all at risk of peaking at the same time. For commodity investors and traders, this is a good time to take account of where there might be another leg higher to be had. As well as which ones are looking bad and ugly, as the old movie title goes.
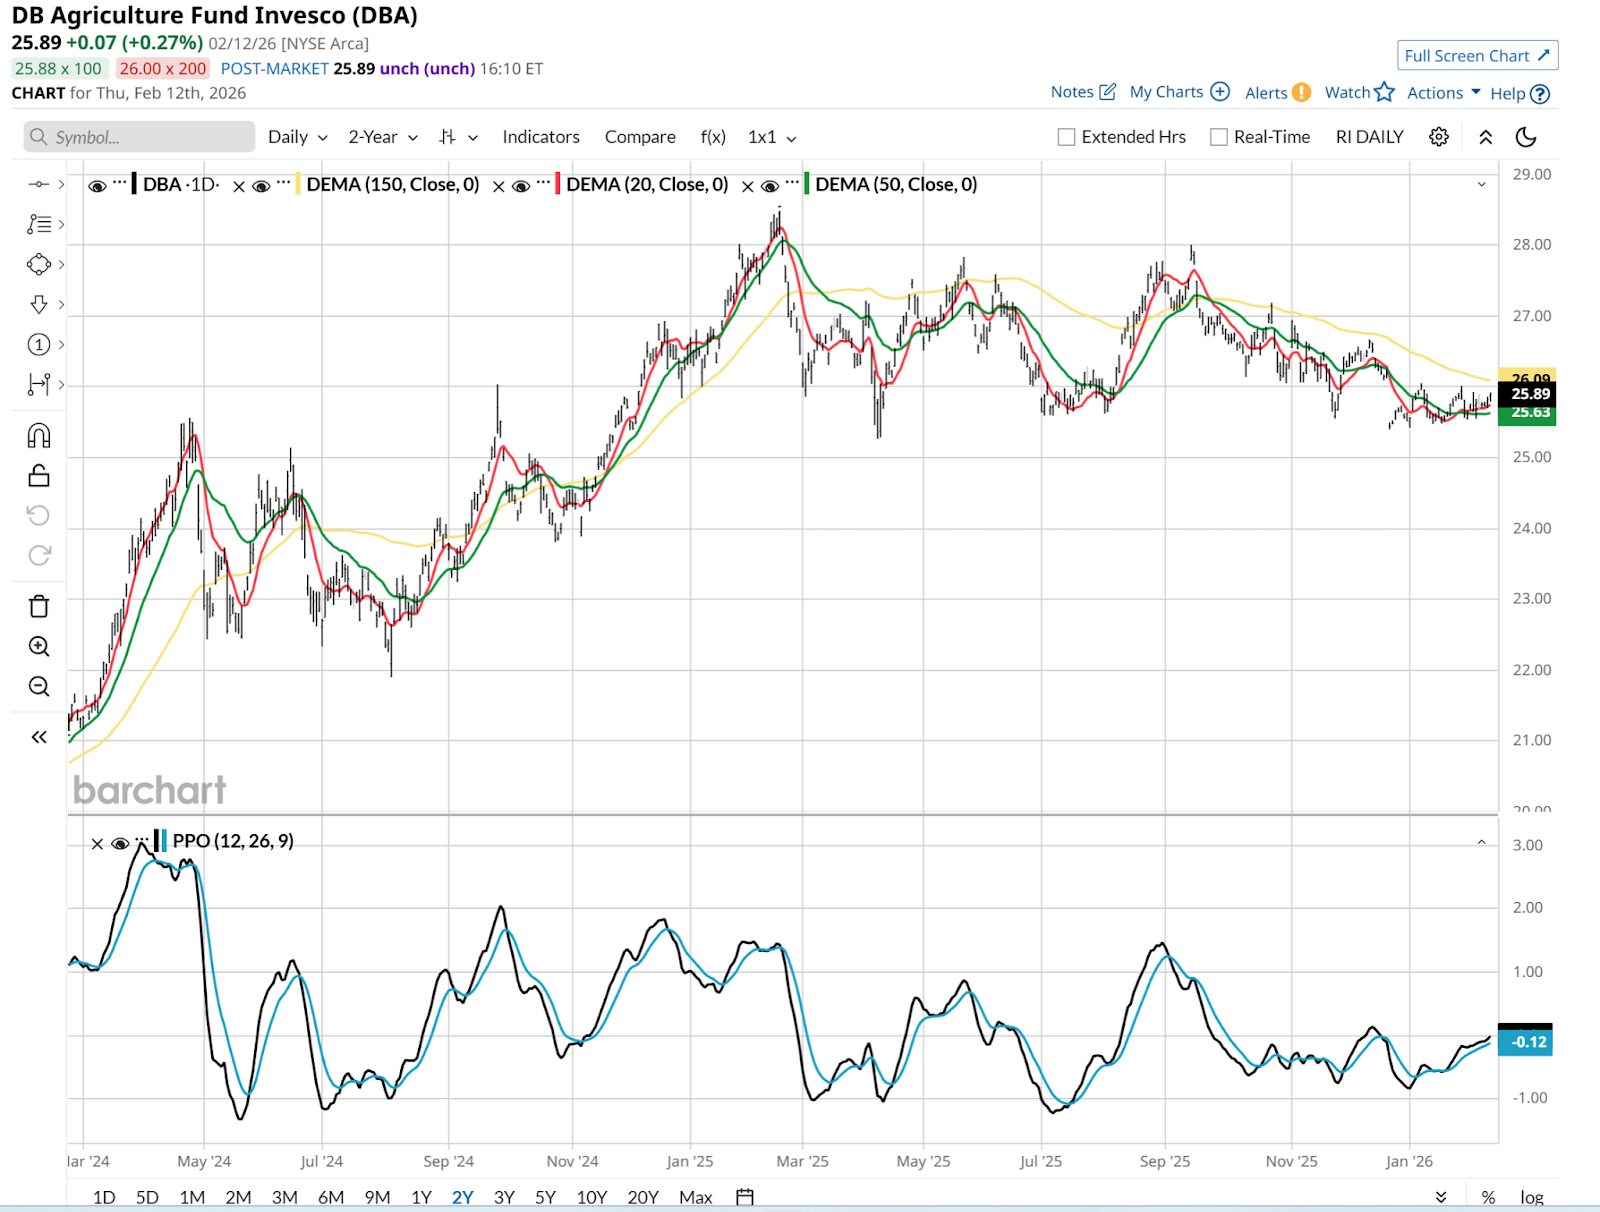
The Good: Agricultural Commodities
The brighter spots in the market are found where actual physical demand is clashing with tight supply chains. That includes select food products that have largely avoided the recent carnage hitting other sectors. Here’s DB Agriculture Fund Invesco (DBA), which drills down to that subsector. In this case, flat price action is better than what we’ll see below.
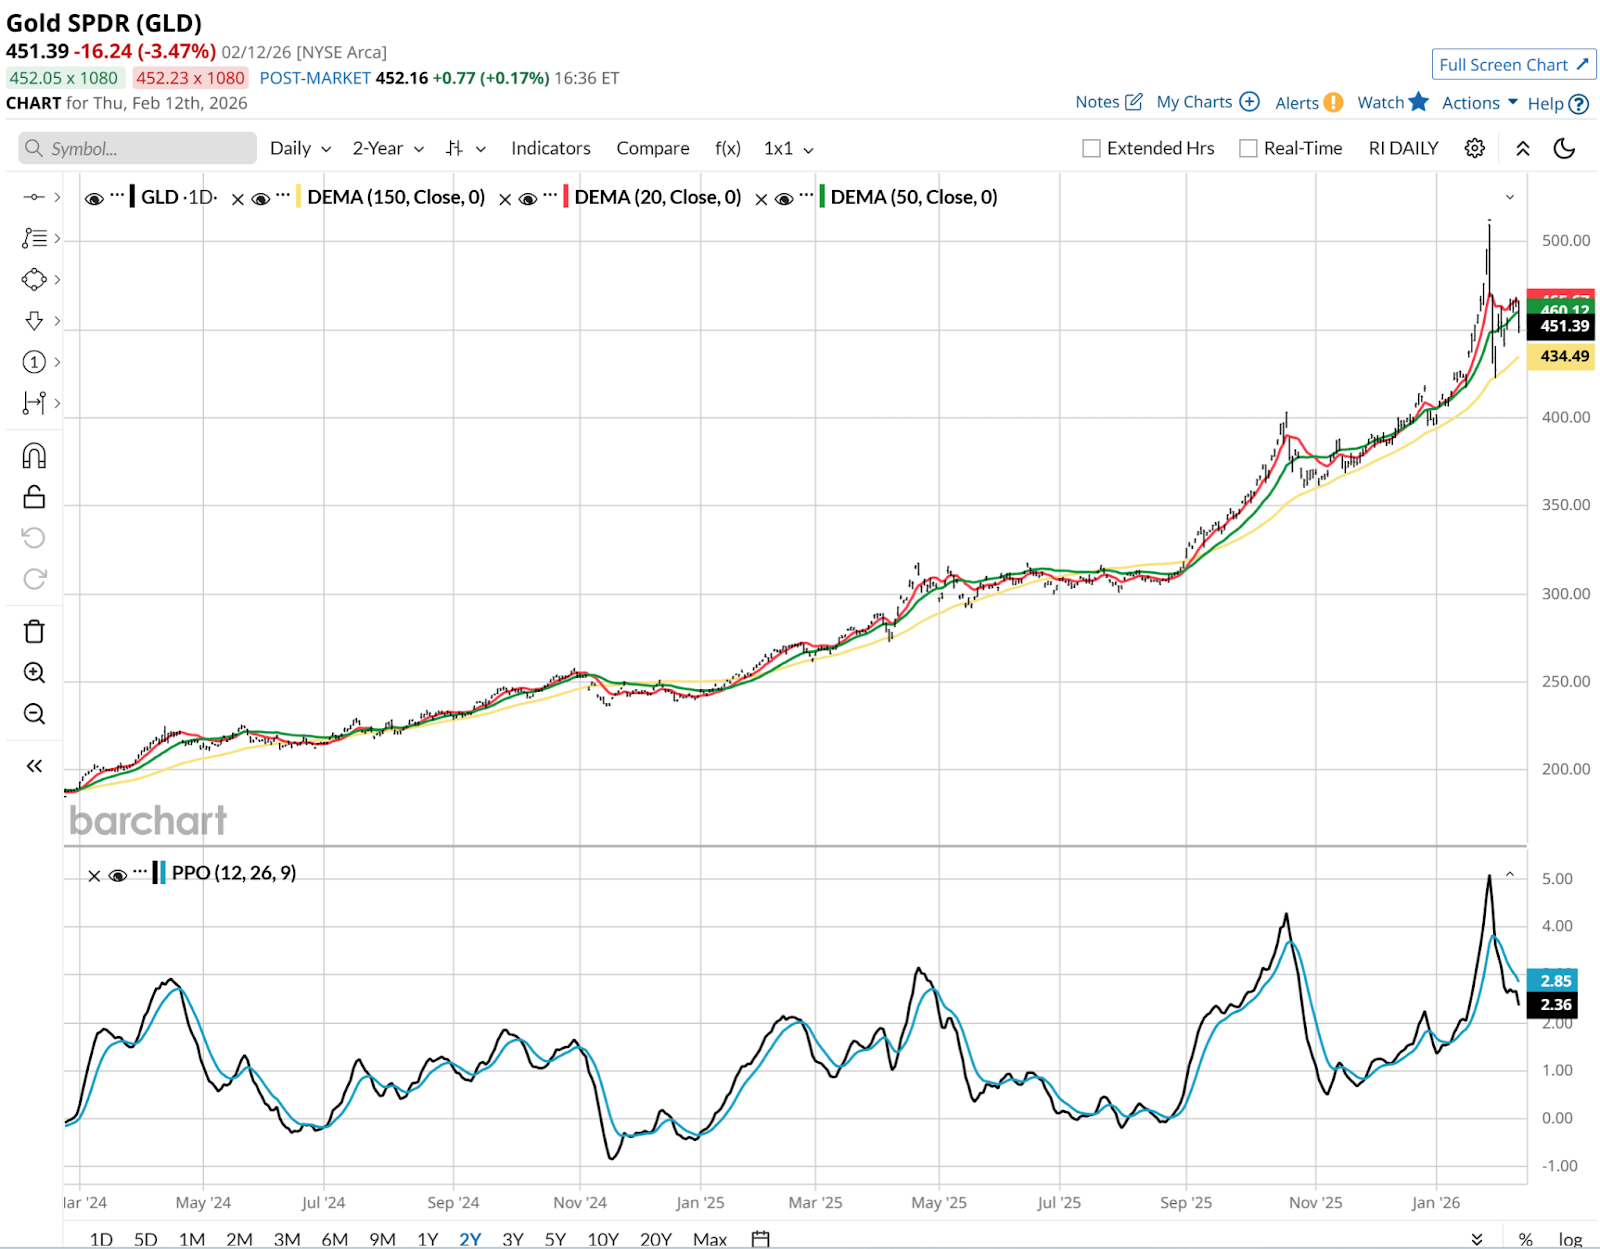
The Bad: Precious Metals Hit a Wall
Here’s the Gold SPDR (GLD), and like silver, it is hinting that the best of times are done for a while. Given the meme-like surges we’ve seen, this will be very interesting to watch.
My observation is that markets in 2026 are all about liquidity, and chasing one market area after another. Just like a pizza after it's been out of the oven for a while, these might be cooling down in a meaningful way.
The Ugly: Energy Volatility and the Cocoa Collapse
Some sectors are dealing with sharp reversals driven by weather shifts and changing harvest outlooks, creating a trap for anyone chasing recent momentum. Here’s oil via the US 12 Month Oil ETF (USL). On many occasions this year, I thought I saw a pending breakout higher. And news flow relating to Iran, Venezuela, Russia, and others seemed to support that.
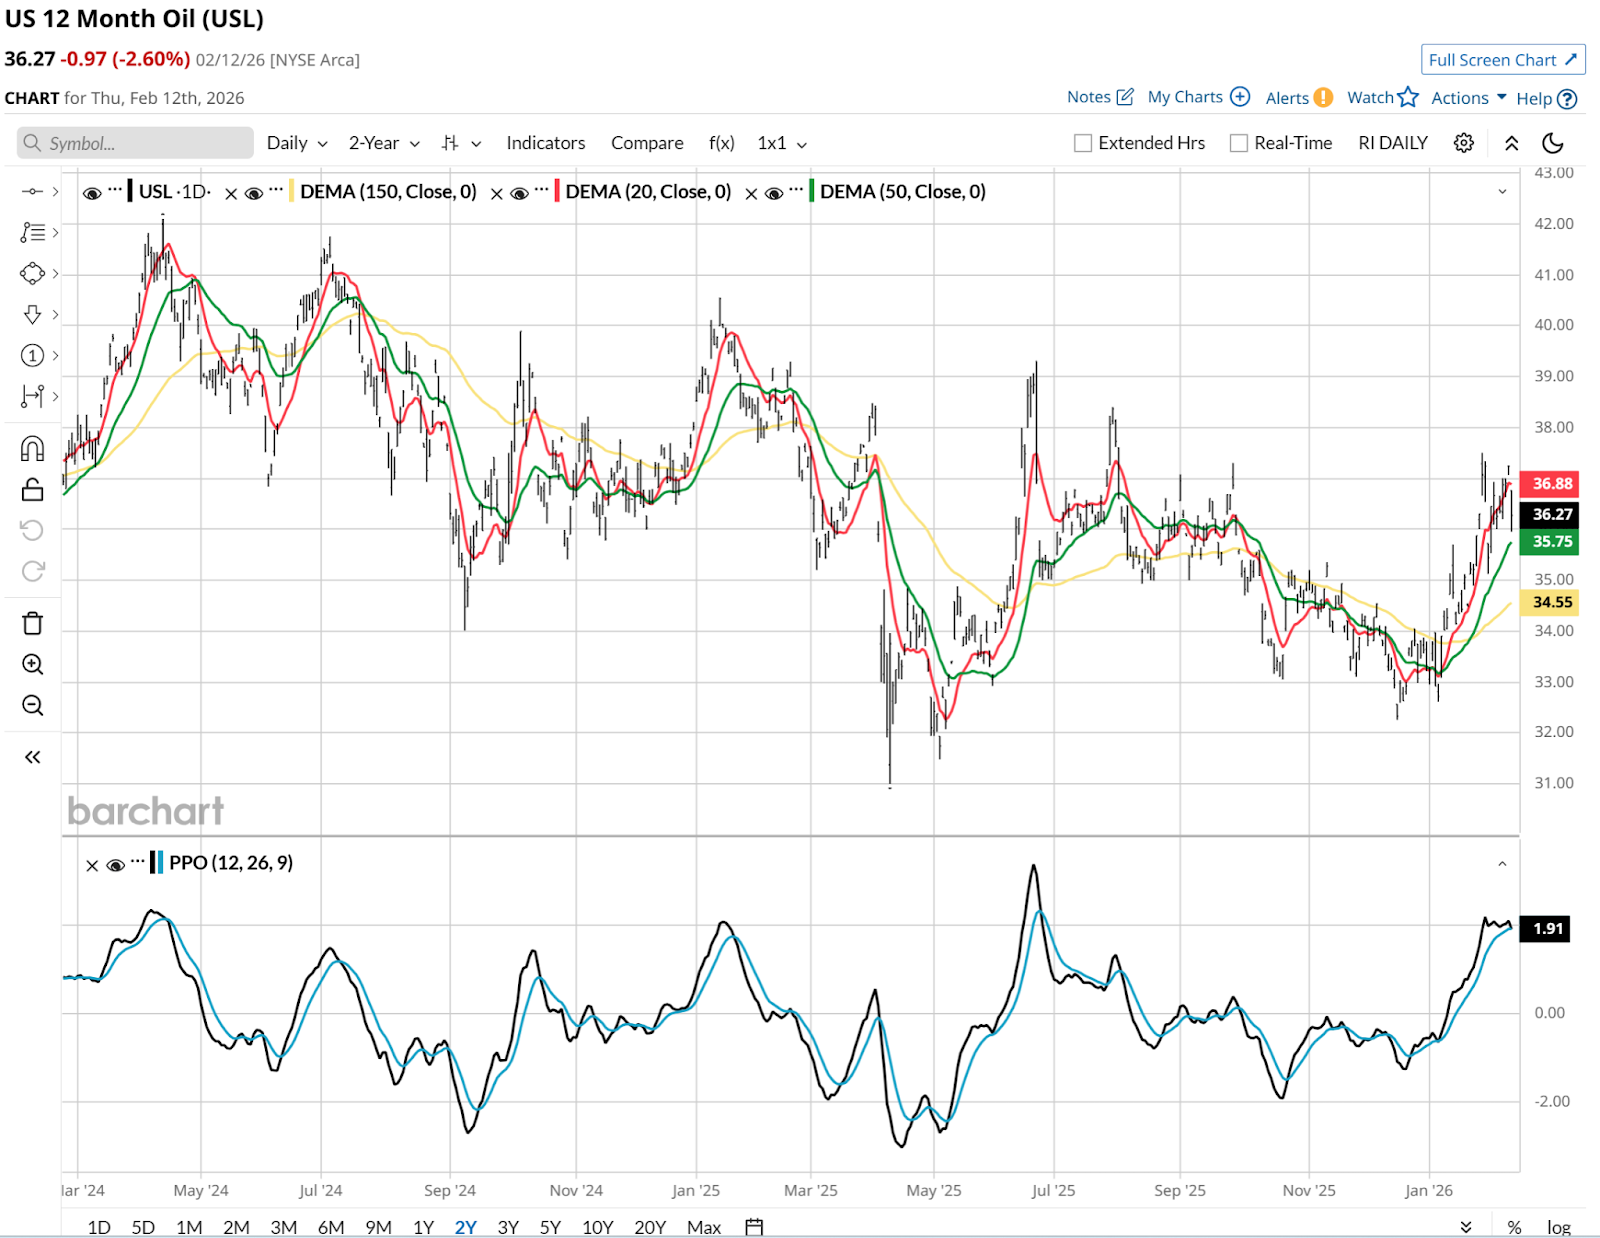
The chart above shows what happened. The picture below tells a story of an ETF gearing up to rally multiple times, only to see it peter out before it could really lift off. Translation: Potential opportunity has been downgraded to uncertainty.
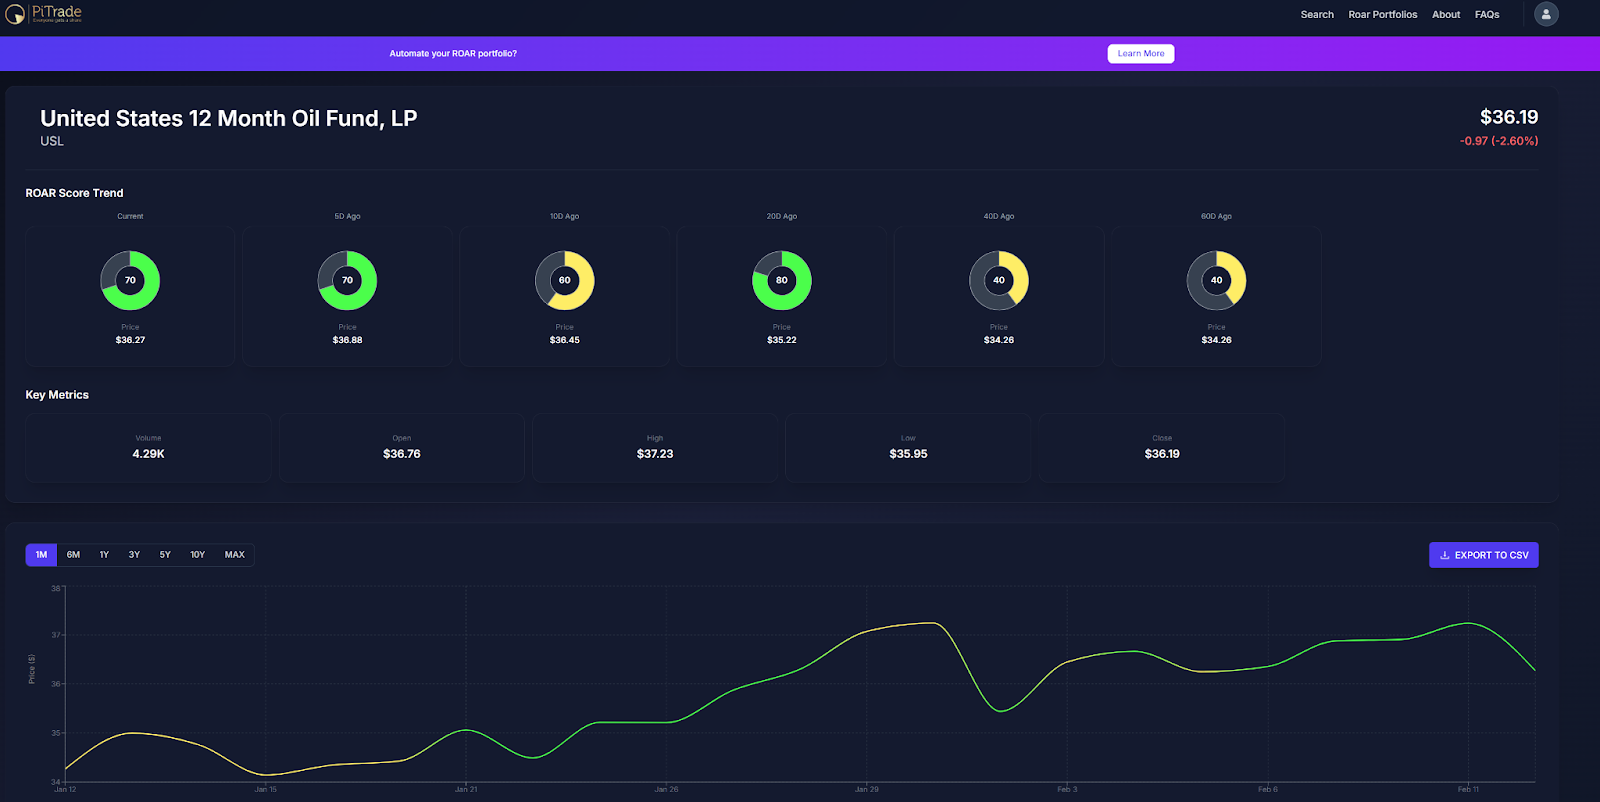
Time has not run out on oil. It never does. But the fits and starts evidenced in the past month’s little gyrations between a ROAR Score of 60 (top of neutral/yellow range) and 70 (start of lower risk/green range) are looking more like a false alarm.
But as risk managers, that’s what we want from technical analysis, isn’t it? “Tell me what to inch closer to, and make my decisions less binary and more about return versus risk.”
The Takeaway
We often talk about pivoting from equities to commodities or bonds. However, with commodities acting so wildly, this might be a case where looking at ETFs that contain equities that benefit from trends in the agriculture space (the “good” commodity area cited above).
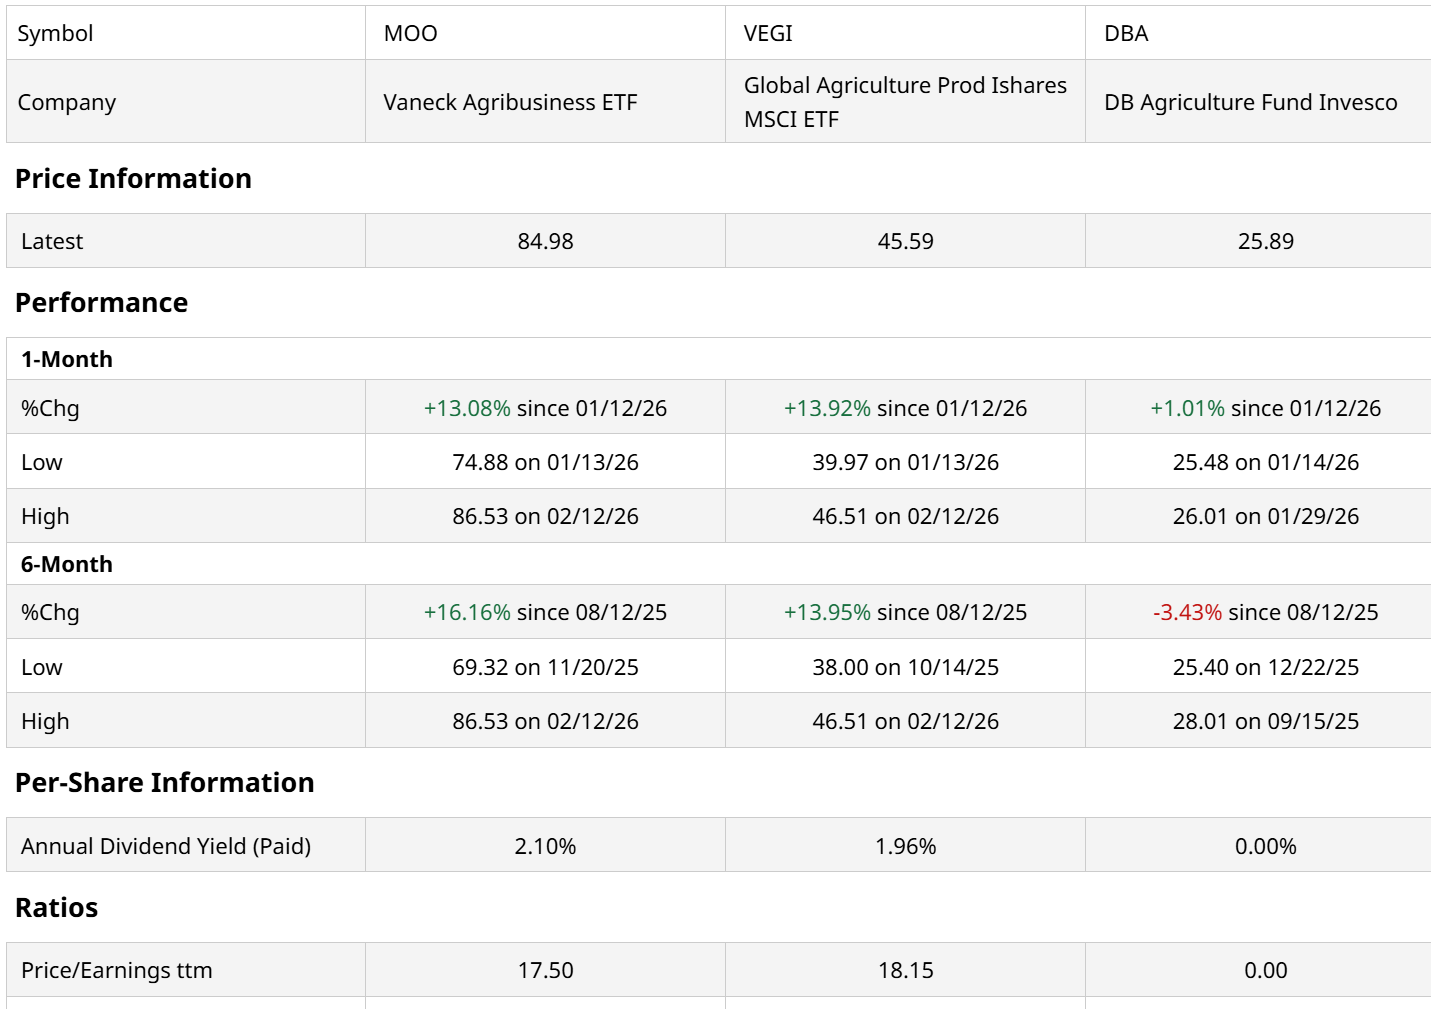
A pair of ETFs that deliver on that purpose are Vaneck Agribusiness ETF (MOO) and Global Agriculture Prod Ishares MSCI ETF (VEGI). As we see in the above table, they are outperforming the agricultural commodity index ETF, have below-market price-to-earnings (P/E) multiples, and even pay yields nearly twice that of the S&P 500 Index. They could be worth a look.
Rob Isbitts created the ROAR Score, based on his 40+ years of technical analysis experience. ROAR helps DIY investors manage risk and create their own portfolios. For Rob's written research, check out ETFYourself.com.
On the date of publication, Rob Isbitts did not have (either directly or indirectly) positions in any of the securities mentioned in this article. All information and data in this article is solely for informational purposes. For more information please view the Barchart Disclosure Policy here.
/Apple%20Inc%20logo%20on%20Apple%20store-by%20PhillDanze%20via%20iStock.jpg)

/Intel%20Corp_%20logo%20on%20mobile%20phone-by%20Piotr%20Swat%20via%20Shutterstock.jpg)
/The%20Shopify%20logo%20on%20a%20smartphone%20screen%20by%20IB%20Photography%20%20via%20Shutterstock.jpg)
/Starbucks%20Corp_%20logo%20by-%20eyewave%20via%20iStock.jpg)