Soybean Oil Dec '13 (ZLZ13)
[[ item.lastPrice ]] [[ item.priceChange ]] ([[ item.percentChange ]]) [[ item.tradeTime ]] [CBOT]
[[ item.bidPrice ]] x [[ item.bidSize ]] [[ item.askPrice ]] x [[ item.askSize ]]
for [[ item.sessionDateDisplayLong ]]
Find the latest Soybean Oil prices and Soybean Oil futures quotes for all active contracts below.
[[ timeframe ]] futures price quotes as of Fri, Jul 10th, 2026.
Latest price quotes as of [[ snapshotDate ]].
[[ timeframe ]] futures price quotes, based on [[ timeframe ]] data.
Looking for expired contracts? Check out our Soybean Oil Historical Prices page.
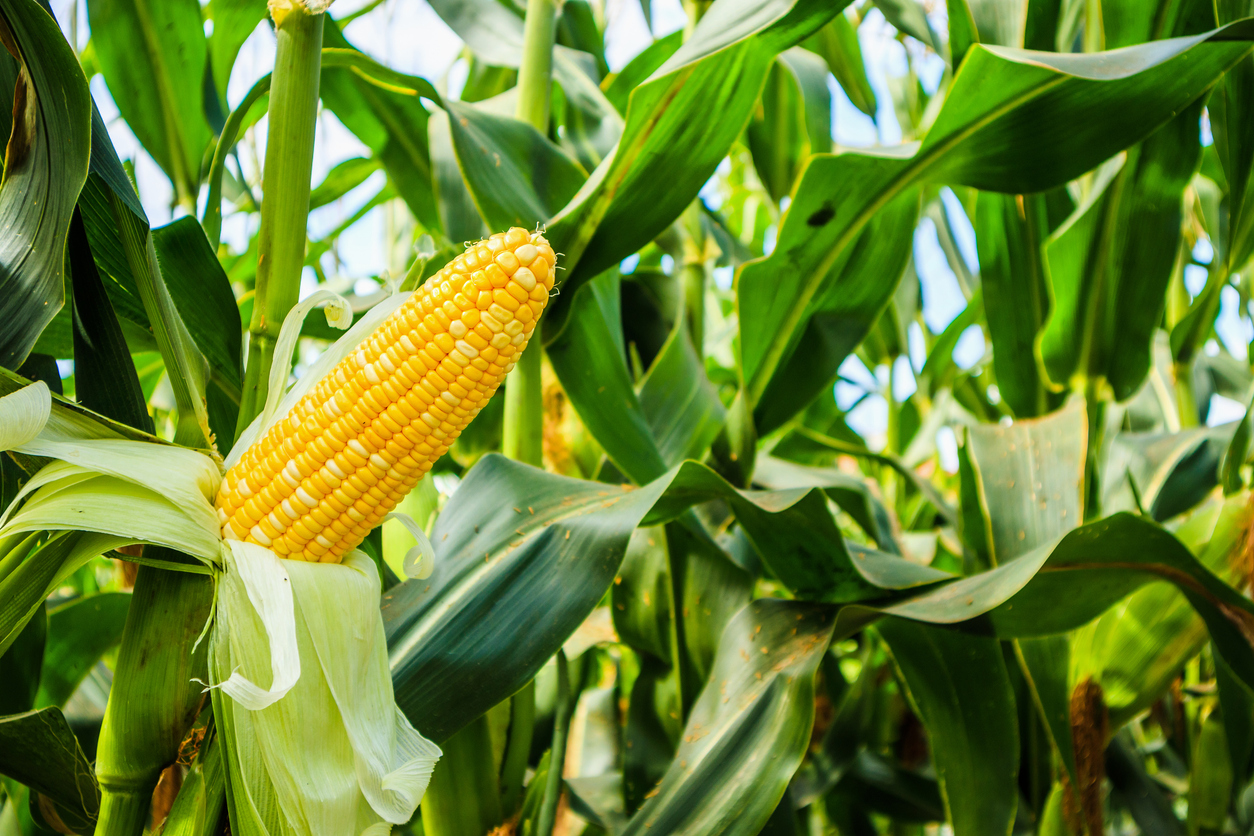
Corn Fades Lower on Thursday
Corn futures closed the Thursday session with contracts 2 to 4 ¼ cents lower, as nearby July was down 7 cents. The CmdtyView national average Cash Corn...

Wheat Posts Strength on Thursday
The wheat complex led the grain complex higher on Thursday, holding with gains across the three exchanges. Chicago SRW contracts posted gains of 4 ¾ to...

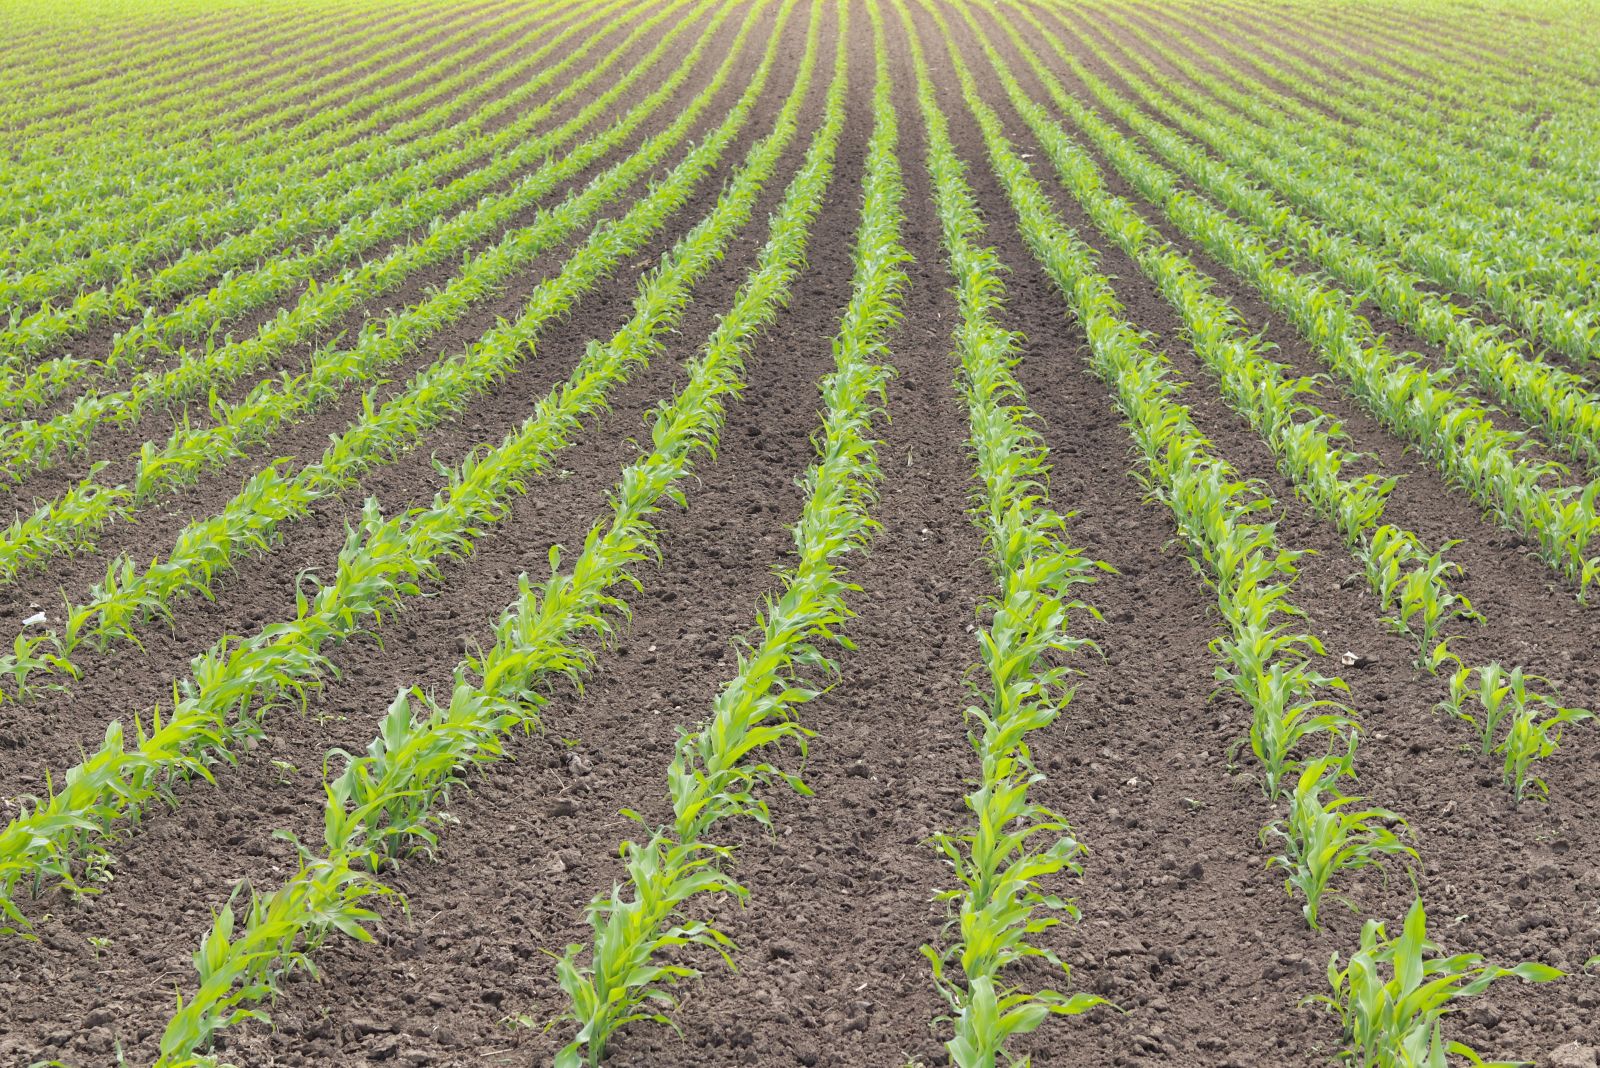
Soybeans Correct Lower on Thursday Ahead of Friday USDA Reports
Soybeans were down 10 to 15 ¼ cents in the front months, with other contracts fractionallt to 8 cents lower. The cmdtyView national average Cash Bean...
"Shootin' the Bull" about increasing assumption of risk
Price erosion continues, with basis remaining wide.

Wheat Showing Midday Strength on Thursday
The wheat complex is posting Thursday gains at midday, to lead the grain complex. Chicago SRW contracts are showing are up 8 to 11 ½ cents higher. There...
Corn Trading with Thursday Losses
Corn futures are showing 2 to 4 ¼ cent losses so far on Thursday. There were 88 deliveries issued against July futures overnight. The CmdtyView national...

This Blue-Chip Dividend Stock Is Outperforming the S&P 500 in 2026
Merck & Co. has outperformed the S&P 500 in 2026, rising 19% year-to-date while offering a 2.61% dividend yield supported by 15 consecutive years of dividend...
Corn Fades Lower on Thursday
Corn futures closed the Thursday session with contracts 2 to 4 ¼ cents lower, as nearby July was down 7 cents. The CmdtyView national average Cash Corn...
Wheat Posts Strength on Thursday
The wheat complex led the grain complex higher on Thursday, holding with gains across the three exchanges. Chicago SRW contracts posted gains of 4 ¾ to...

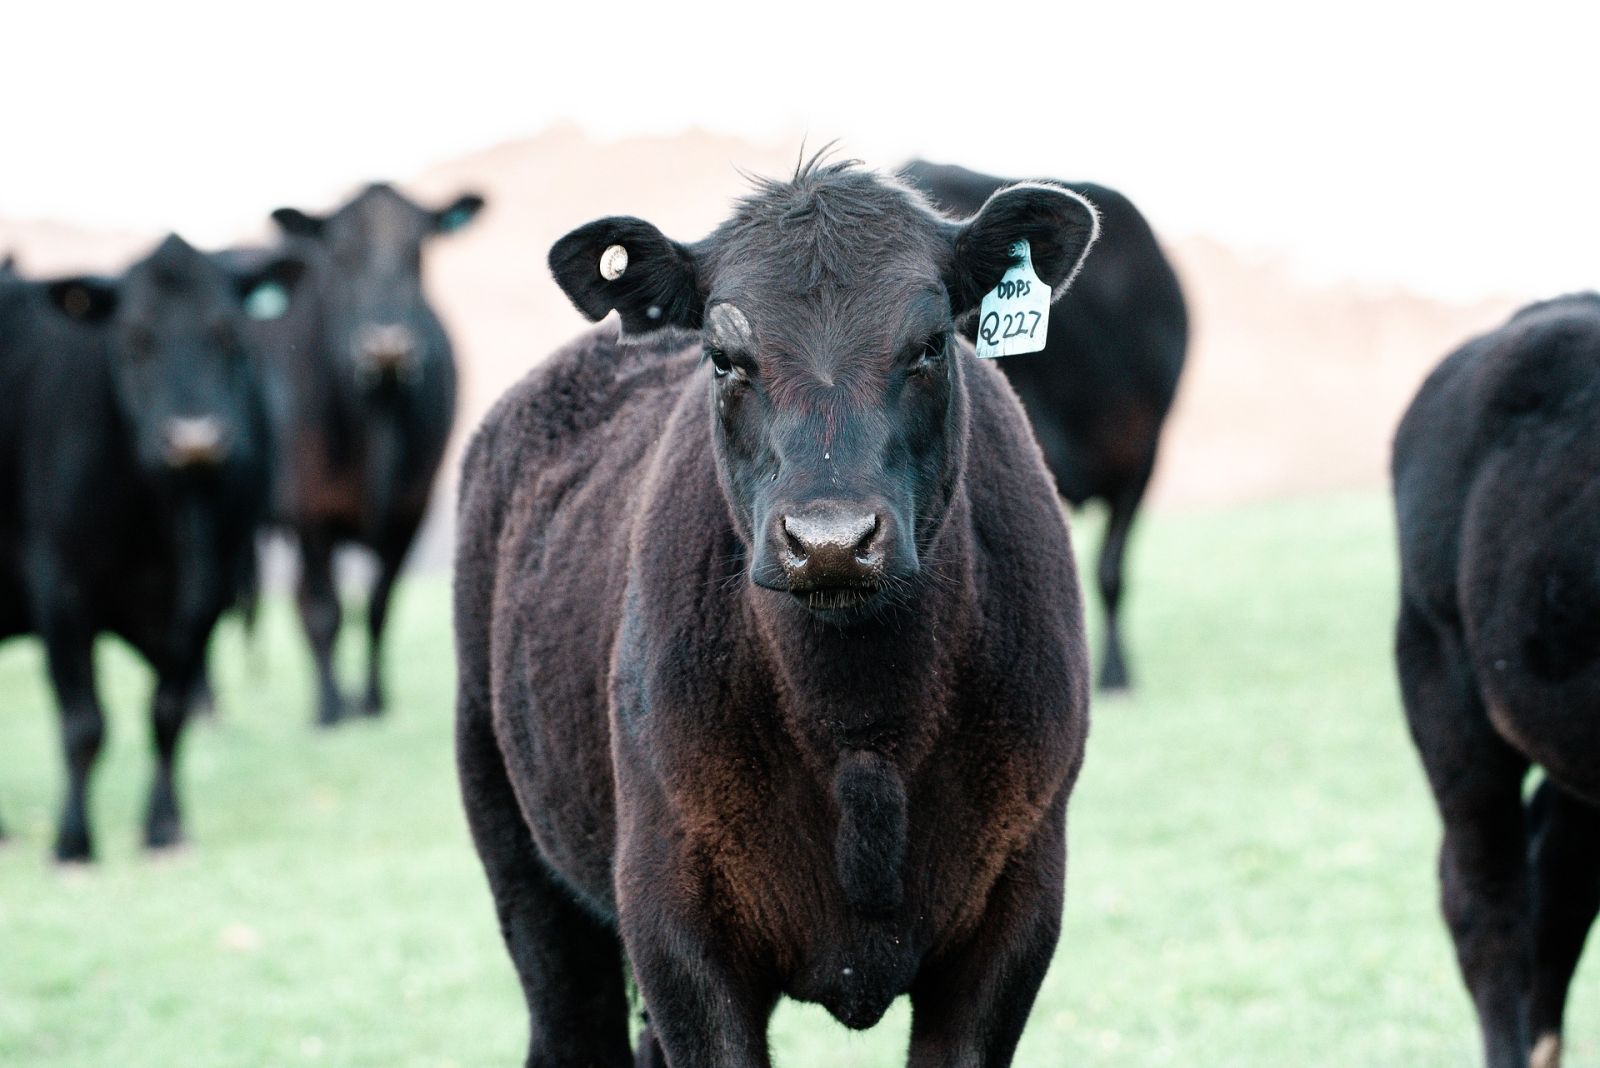
Cattle Post Weakness on Thursday
Live cattle futures were falling on Thursday, with contracts down $1.80 to $2.47 at the close. Cash trade kicked off on Thursday at $247-248 across the...

Cotton Faces Moderate Thursday Weakness
Cotton futures were down 4 to 24 points across the board at the Thursday close. Crude oil corrected back lower on Thursday despite back and forth strikes...
Soybeans Correct Lower on Thursday Ahead of Friday USDA Reports
Soybeans were down 10 to 15 ¼ cents in the front months, with other contracts fractionallt to 8 cents lower. The cmdtyView national average Cash Bean...

Hogs Close with Mixed Trade on Thursday
Lean hog futures were mixed at the final bell on Thursday, with contracts down $1.50 in August to as much as 30 cents higher in the deferreds. USDA’s...
/Server%20racks%20by%20dotshock%20via%20Shutterstock.jpg)
SMCI Stock Likely to Reverse from Oversold Levels as DCBBS Gains Growth Traction
Supermicro announced a new partnership with Red Hat.