
FTSE 100 Dec '18 (XZ18)
[[ item.lastPrice ]] [[ item.priceChange ]] ([[ item.percentChange ]]) [[ item.tradeTime ]] [ICE]
[[ item.bidPrice ]] x [[ item.bidSize ]] [[ item.askPrice ]] x [[ item.askSize ]]
for [[ item.sessionDateDisplayLong ]]
Find the latest FTSE 100 prices and FTSE 100 futures quotes for all active contracts below.
[[ timeframe ]] futures price quotes as of Thu, Jun 4th, 2026.
Latest price quotes as of [[ snapshotDate ]].
[[ timeframe ]] futures price quotes, based on [[ timeframe ]] data.
Looking for expired contracts? Check out our FTSE 100 Historical Prices page.
Stocks Rebound on Strength in Banks and Managed Healthcare
The S&P 500 Index ($SPX ) (SPY ) on Thursday closed up +0.41%, the Dow Jones Industrial Average ($DOWI ) (DIA ) closed up +1.73%, and the Nasdaq 100 Index...

Stocks Mixed as Tech Weakness Weighs
The S&P 500 Index ($SPX ) (SPY ) today is up +0.02%, the Dow Jones Industrial Average ($DOWI ) (DIA ) is up +1.49%, and the Nasdaq 100 Index ($IUXX ) (QQQ...
Weakness in Technology Stocks Pressures Stock Indexes
The S&P 500 Index ($SPX ) (SPY ) today is down -0.16%, the Dow Jones Industrial Average ($DOWI ) (DIA ) is up +1.41%, and the Nasdaq 100 Index ($IUXX )...

Nasdaq Futures Plunge as Broadcom Sinks on Disappointing AI Chip Sales Forecast
June Nasdaq 100 E-Mini futures (NQM26) are trending down -1.12% this morning as a disappointing forecast from Broadcom led investors to hit pause on the...
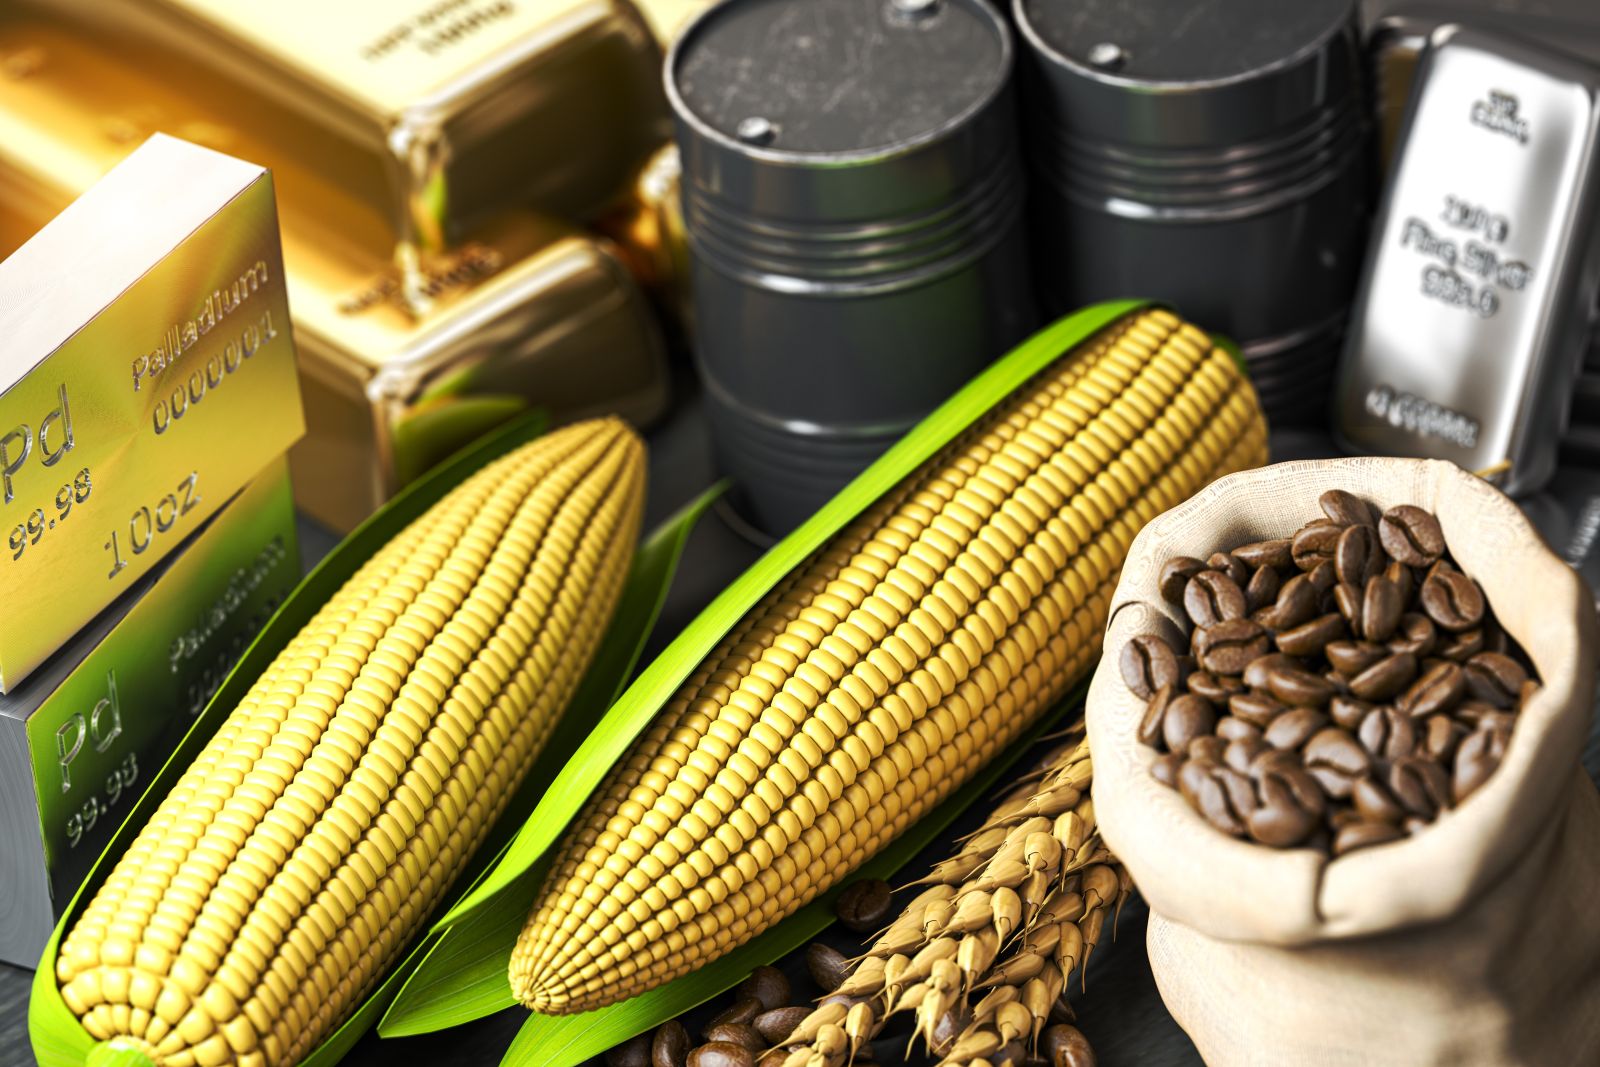
Why Was the Commodities Complex Like a Sailboat Race Thursday Morning?
A lack of headlines left the commodity complex adrift, for the most part, overnight through early Thursday morning.
Stocks Retreat as US-Iran Peace Hopes in Doubt
The S&P 500 Index ($SPX ) (SPY ) on Wednesday closed down -0.74%, the Dow Jones Industrial Average ($DOWI ) (DIA ) closed down -1.21%, and the Nasdaq 100...

UnitedHealth Just Raised Its Dividend 5%. Why You Should Buy UNH Stock Here.
UnitedHealth Group raised its quarterly dividend by 5% to $2.32 per share, marking its 16th consecutive year of dividend increases amid a challenging health...

Wheat Weakness Pushes to Thursday
The wheat complex extended the weakness on Thursday, with losses across the three markets. Chicago SRW futures fell 5 1/2 to 7 1/2 cents on Thursday. KC...
Corn Collapse Continues on Thursday
Corn futures continued their death spiral liquidation from the last few weeks, with contracts down another 5 to 8 1/4 cents at the close. The CmdtyView...

Hogs Slips Lower on Thursday
Lean hog futures posted 30 to 70 cent losses on Thursday. USDA’s national base hog price was reported at $95.66 on Thursday PM, up $1.30 from the day...

Cattle Buy the Fact on Screwworm Confirmation, with Feeders Rallying the Limit
Live cattle futures were in rally mode on Thursday with gains of $2.55 to $4.80. Cash trade has crept up to $256-257 the week, with sales of $403-407 in...

Soybeans Face Product Pressure on Thursday, with Double Digit Losses
Soybeans fell 20 to 27 cents across most contracts on Thursday, as product values added some pressure. The cmdtyView national average Cash Bean price...

Cotton Falls on Thursday, with Modest Outside Pressure
Cotton futures closed the Thursday session with most contracts 136 to 216 points lower on the day. The US dollar index was down $0.080 at $99.425. Crude...
/A%20Palantir%20sign%20displayed%20on%20an%20office%20building%20by%20Poetra_RH%20via%20Shutterstock.jpg)
Michael Burry Takes Aim at Palantir Stock Again, But He’s Missing the Bigger Picture
The "Big Short" investor has questioned the company's bullish momentum.