SAFEX Sunflower May '25 (HLK25)
[[ item.lastPrice ]] [[ item.priceChange ]] ([[ item.percentChange ]]) [[ item.tradeTime ]] [SAFEX]
[[ item.bidPrice ]] x [[ item.bidSize ]] [[ item.askPrice ]] x [[ item.askSize ]]
for [[ item.sessionDateDisplayLong ]]
Find the latest SAFEX Sunflower prices and SAFEX Sunflower futures quotes for all active contracts below.
[[ timeframe ]] futures price quotes as of Mon, Aug 3rd, 2026.
Latest price quotes as of [[ snapshotDate ]].
[[ timeframe ]] futures price quotes, based on [[ timeframe ]] data.
Looking for expired contracts? Check out our SAFEX Sunflower Historical Prices page.
Building Better Commodity Spreads – Part 3: Why the Front Month Matters
Selecting the right entry week is only one part of timing a seasonal spread. This article explores why the front-month contract can have a significant...

Cattle rally from key support while profit-taking presses grains
More heat to start August
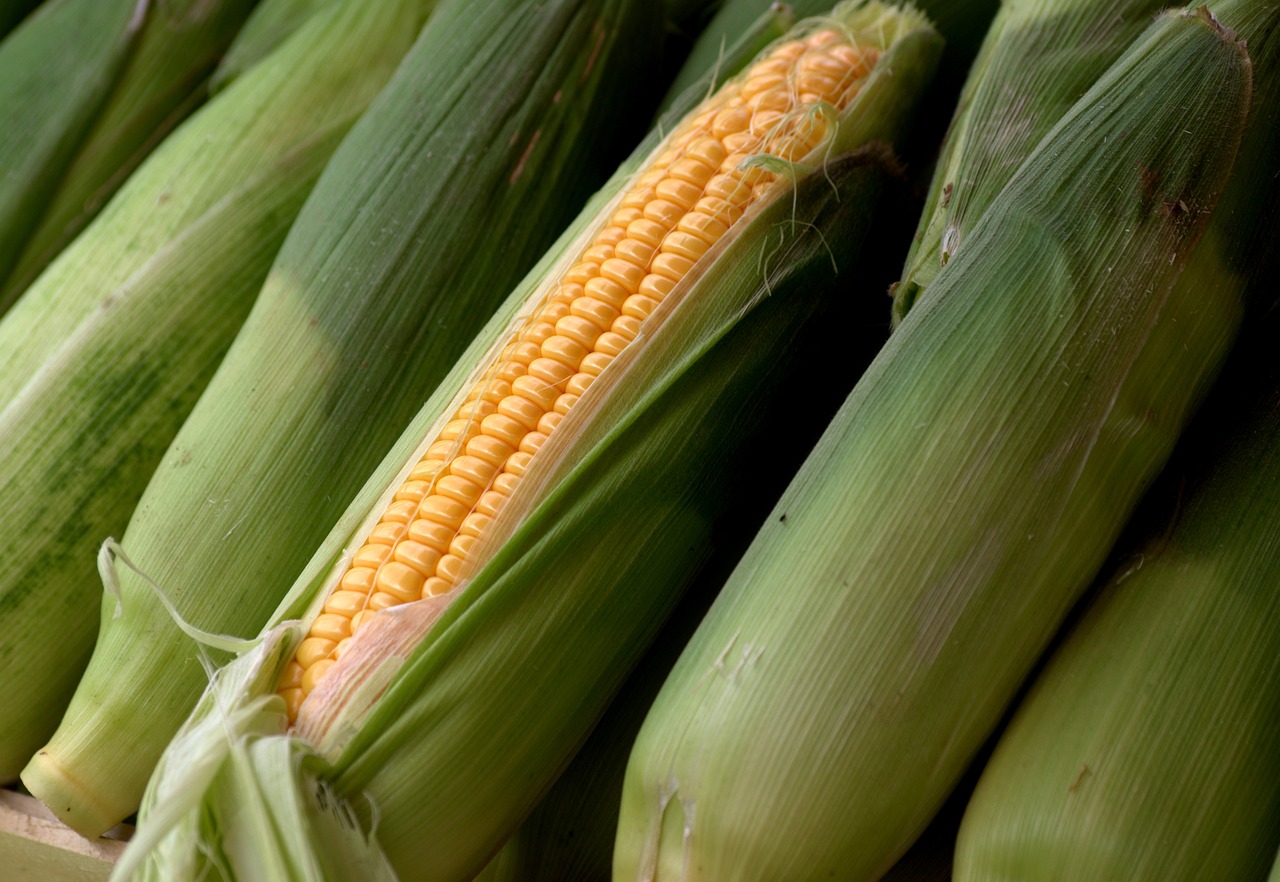
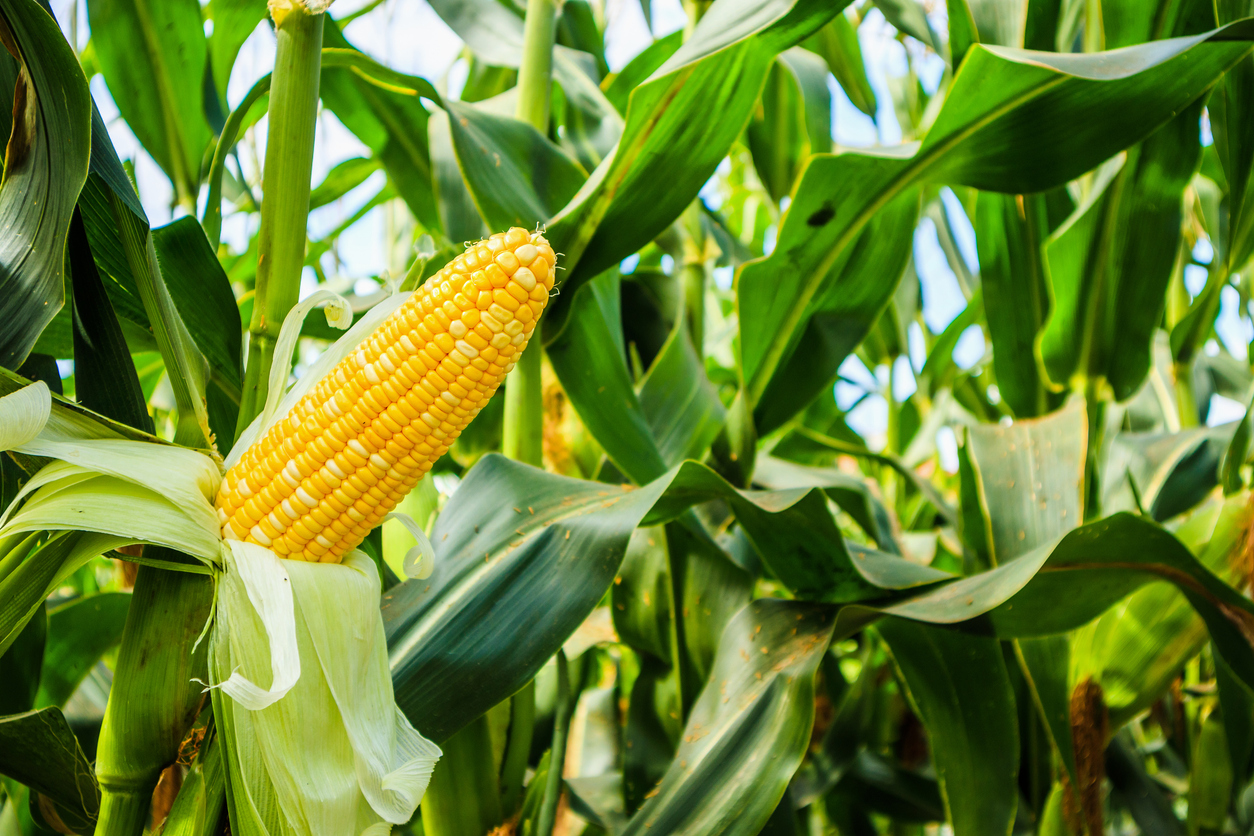
Corn Closes July with Weakness
Corn futures posted losses of 1 ½ to 5 cents on the Friday session, as September and December both closed the week with a 23 ½ cent loss. Spillover weakness...

Soybeans Face Weakness to Close the Week
Soybeans posted 1 to 5 ¼ cent losses across most contracts on Friday. August was down 76 cents on the week, with November dropping 66 cents. November...

Wheat Collapses to Close out July
The wheat complex fell into the weekend, with losses across the three exchanges as money was coming out at the end of the month. Chicago SRW contracts...
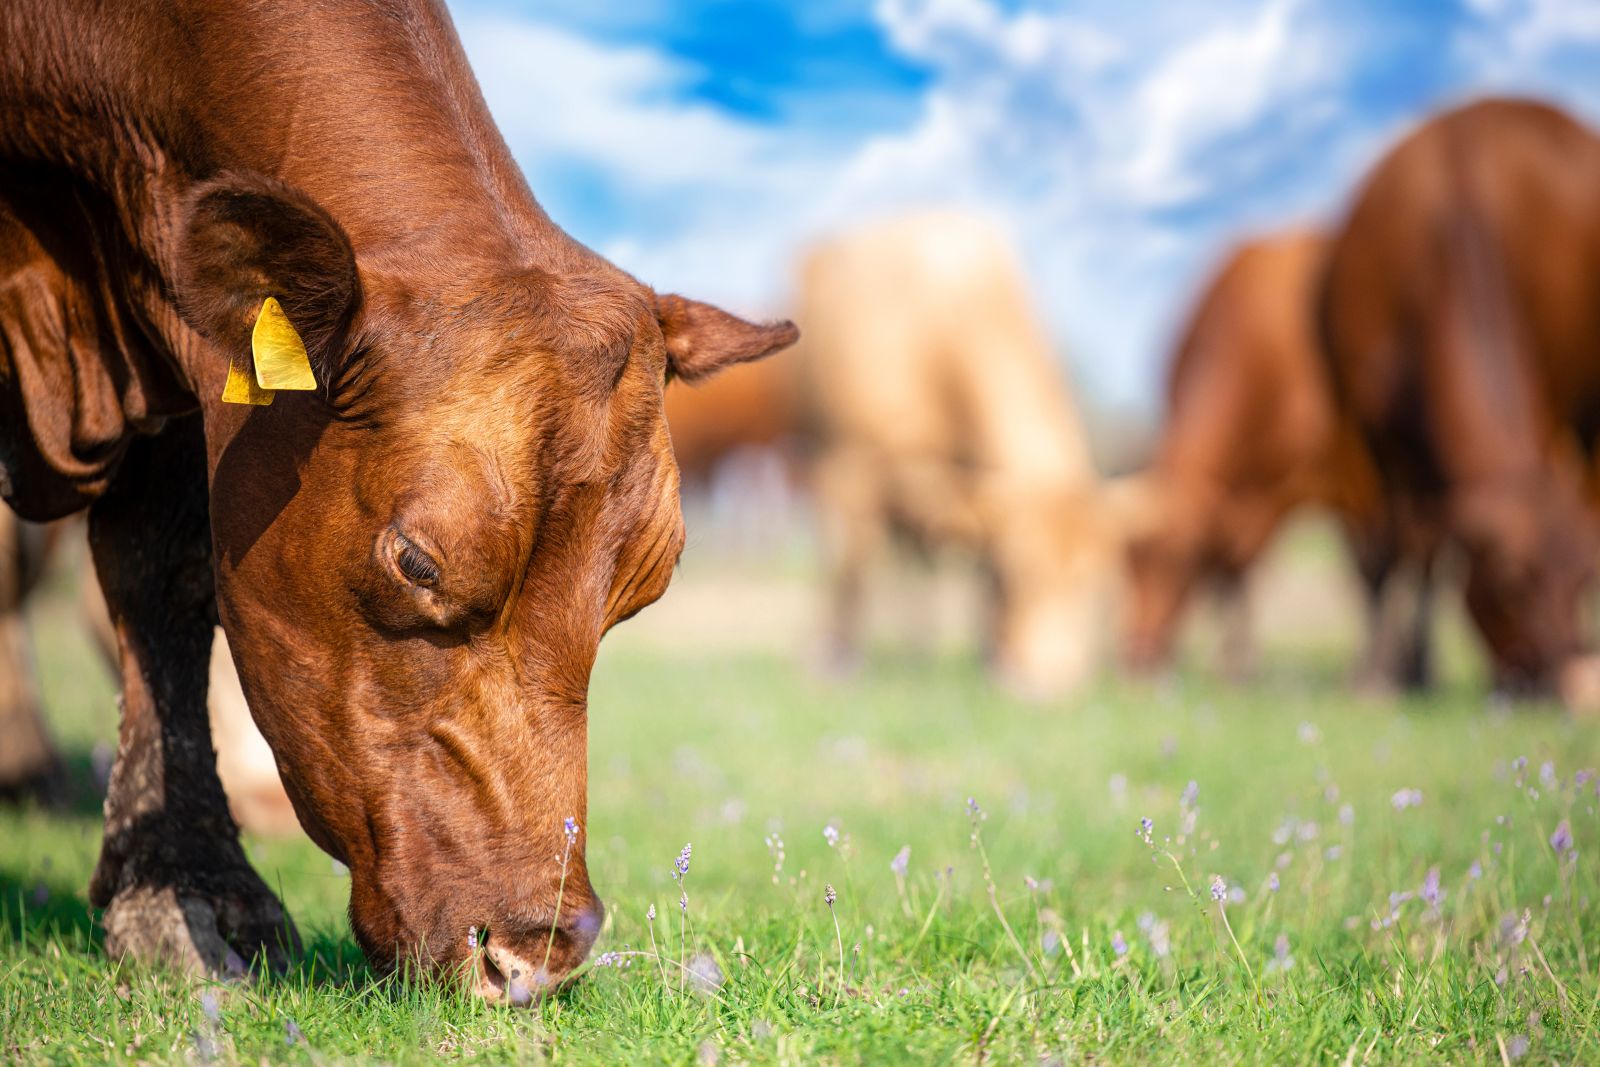
Cattle Markets Rally Early to Weekly High and Pull Back
Markets rally early and can't hold rally
Do Wall Street Analysts Like EOG Resources Stock?
EOG Resources’ shares have outperformed the broader S&P 500 Index but fallen short of matching its industry peers’ gains over the past year. Even so,...
/AI%20(artificial%20intelligence)/Ai%20chip%20by%20Quality%20Stock%20Arts%20via%20Shutterstock.jpg)
Here’s What Magnificent 7 Earnings Tell Us About the AI Trade in 2026
The Magnificent 7 companies, except Nvidia, have reported their June quarter earnings. Here are the key takeaways from their earnings and the implications...
/Row%20of%20server%20racks%20in%20data%20center%20by%20elbanco%20via%20Adobe%20Stock.jpeg)
Is Wall Street Bullish or Bearish on Vertiv Holdings Stock?
Vertiv Holdings has outperformed the broader market over the past year, and analysts remain highly bullish about the stock’s prospects.
Option Volatility And Earnings Report For Aug 3 - 7
It is another big week on the earnings front with a lots of big name companies reporting. This week could make or break the market. This week we have SpaceX,...

Stocks Set to Open Higher as Oil Sinks on U.S.-Iran Deal Hopes, Jobs Data and Earnings Awaited
September S&P 500 E-Mini futures (ESU26) are up +0.57%, and September Nasdaq 100 E-Mini futures (NQU26) are up +0.47% this morning, pointing to a higher...
/Elements%20of%20cardboard%20boxes%20collected%20in%20stack%20packaging%20by%20Aleksandr%20Matveev%20via%20Adobe%20Stock.jpeg)
Are Wall Street Analysts Bullish on International Paper Stock?
International Paper has lagged behind the broader market over the past year, yet analysts remain highly bullish about the stock’s prospects.
/Amazon%20-%20Image%20by%20bluestork%20via%20Shutterstock.jpg)
Wall Street Is Rewarding AI Results, Not Just AI Spending
The market is buying CEO Andy Jassy's spending plan for Amazon.
/Palantir%20by%20Hiroshi-Mori-Stock%20via%20Shutterstock.jpg)
Wall Street Can’t Agree on Palantir Stock. Earnings Will Reveal Who’s Right.
Palantir heads into earnings on Aug. 3 with Wall Street divided as bullish growth expectations clash with concerns over commercial demand.